")
Back to Journals » Diabetes, Metabolic Syndrome and Obesity » Volume 14
Serum Uric Acid Levels and Metabolic Indices in an Obese Population: A Cross-Sectional Study
Authors Li F , Chen S, Qiu X, Wu J, Tan M , Wang M
Received 28 October 2020
Accepted for publication 12 January 2021
Published 11 February 2021 Volume 2021:14 Pages 627—635
DOI https://doi.org/10.2147/DMSO.S286299
Checked for plagiarism Yes
Review by Single anonymous peer review
Peer reviewer comments 3
Editor who approved publication: Prof. Dr. Antonio Brunetti
Fen Li,1,2 Sheng Chen,2 Xinwen Qiu,2 Jing Wu,1 Min Tan,1 Min Wang1
1Department of Endocrinology, Xiangya Hospital, Central South University, Changsha, People’s Republic of China; 2Department of Endocrinology and Metabolism, Liuyang People’s Hospital, Changsha, People’s Republic of China
Correspondence: Min Wang
Department of Endocrinology, Xiangya Hospital, Central South University, Changsha, People’s Republic of China
Tel +86-135-0731-5620
Email [email protected]
Objective: To analyze the association between serum uric acid (SUA) and metabolic state in obese inpatients and preliminarily explore potential mechanisms of hyperuricemia in obesity.
Methods: A total of 153 obese inpatients were selected and assigned based on SUA level to the normal uric acid (NC group) or high uric acid (HUA) group. Patients’ sex, age, height, weight, blood pressure, BMI, and prevalence of metabolic syndrome were collected and recorded. SUA, FPG, FIns, HOMA-IR, HOMA-IS, HbA1c, TGs, TC, LDL-C, and HDL-C levels were tested. Pearson correlation analysis was performed to analyze the correlation between SUA and related metabolic indicators. Logistic regression was performed to analyze independent risk factors of hyperuricemia in obesity.
Results: In the HUA group, the patients were predominantly males, and BMI, DBP, TGs, FPG, FIns, HOMA-IR, HOMA-IS, and metabolic syndrome were higher than those in the NC group (P< 0.05), while HDL-C was lower than that in the NC group (P< 0.05). There were no significant differences between the groups in TC or LDL-C. Pearson correlation analysis showed that in obese patients, SUA was positively correlated with BMI, FIns, HOMA-IR, HOMA-IS, TGs, andmetabolic syndrome and negatively correlated with age and HDL-C. Logistic regression showed that BMI, hyperinsulinemia, and insulin resistance were independent risk factors of hyperuricemia.
Conclusion: Development of hyperuricemia in obese populations might be correlated with hyperinsulinemia or insulin resistance.
Keywords: obesity, hyperuricemia, insulin resistance
Introduction
Obesity is an increasingly serious public health problem on a global level, with a sustained increase in global mortality and incidence of chronic diseases. Obesity exhibits an intimate correlation with multiple diseases (eg, hypertension, atherosclerosis, cardiopulmonary disease, metabolic syndrome, and cancer) and is also an induction factor responsible for increased risk of cardiovascular disease and all-cause mortality. In addition, 25-hydroxyvitamin D Levels are negatively and independently associated with fat mass in healthy overweight and obese subjects.1 The obese population in China ranks first in the world. Evidence2 supports the fact that patients with obesity, especially those with abdominal obesity, may experience a higher risk of hyperuricemia (high uric acid [HUA]): 2.1 times that of nonobese patients. Furthermore, uric acid is an end product of purine metabolism in human body. Elevated serum uric acid (SUA) can not only lead to gout but also is an essential risk factor of obesity,3 which may result in increased incidence of metabolic syndrome.4 It has been confirmed that SUA is independently and positively correlated with the risk of obesity.5
The relationship between HUA and obesity may be explained through a variety of mechanisms. Obesity or excessive body fat may be related to excessive production of uric acid and its poor excretion, due to insulin resistance (IR), resulting in impaired uric acid metabolism and even HUA.6 Meanwhile, HUA can induce obesity by accelerating liver and peripheral fat production.7 Both glycolipid- and uric acid–metabolism disorders may promote the coexistence of the two factors. There is substantial evidence8 that HUA is a risk factor of hypertension and cardiovascular and cerebrovascular diseases. Elevated SUA is significantly associated with the prevalence of metabolic syndrome and its components.9 In moderate nondiabetic chronic kidney disease, SUA ≥9 mg/dL is associated with higher all-cause mortality.10 A significant positive relationship between SUA and obesity has been demonsrated among Bangladeshi adults.11 According to the latest report, HUA has become a major health problem among urban adults aged 35–79 years in southwestern China, and special attention should be paid to men. Comorbidities associated with HUA and causality are worth further investigation.12 Accordingly, the present study was carried out to analyze the metabolic status and related influential factors of obese inpatients with HUA, so as to explore possible risk factors and mechanisms of HUA in obese patients. It is expected to provide strong clinical evidence for early prevention and treatment of the disease.
Methods
Study Population
Subjects comprised 153 obese patients (105 males and 48 females) admitted to Xiangya Hospital of Central South University from January 2017 to September 2019. In strict accordance with International Classification of Disease Coding, all enrolled patients were definitely diagnosed as obese at discharge. The departments surveyed were principally Internal Medicine, Surgery, and Gynecology. Inclusion criteria were age 18–65 years, BMI meeting the 2017 diagnostic criteria for obesity (28 kg/m2), avbailability of complete clinical data, and patients being informed and agreeing to participate in the study. Exclusion criteria were secondary obesity, combined severe hepatic and renal insufficiency (eGFR <30 mL/min/1.73 m2 or alanine aminotransferase 2.5 times of the normal upper limit), severe cardiovascular and cerebrovascular diseases (cerebrovascular events, myocardial infarction, or acute heart failure within 3 months) use of uric acid–lowering drugs, angiotensin-receptor blockers or diuretics within 3 months before admission, and pregnant or breastfeeding.
Procedure
The present research was designed as a cross-sectional study. All procedures were performed in accordance with ethical standards. Surveyed were the Department of Internal Medicine (eg, respiratory medicine, endocrinology, nephrology, cardiology, general medicine, international medicine), Department of Surgery (eg, throat surgery, gastrointestinal surgery, plastic surgery, stomatology) and Department of Gynecology. The top five divisions of the Department of Internal Medicine and the main reasons for treatment were endocrinology (metabolic syndrome, simple obesity preoperative preparation), cardiology (metabolic syndrome, dilated cardiomyopathy, coronary heart disease), international medicine (metabolic syndrome), intervention medicine (metabolic syndrome), and respiratory medicine (sleep apnea–hypopnea syndrome, pulmonary infection). Divisions of the Department of Surgery and corresponding primary reasons for treatment were throat surgery (sleep apnea–hypopnea syndrome, tongue hypertrophy) and gastrointestinal surgery (surgical intervention for severe obesity). Visits to the Department of Gynecology were mainly due to polycystic ovary syndrome.
General Data Collection
Clinical data were recorded and collected in all patients at admission: sex, age, height, weight, and BMI — weight/height2 (kg/m2). For measurement of height and weight, the subject needed to be barefoot and take off any hat, wearing only lightweight clothes. Subjects took a 10-minute seated rest, then standardized mercury sphygmomanometers were used to measure their sitting blood pressure (BP). Systolic BP (SBP) and diastolic BP (DBP) were recorded at the first appearance and disappearance of Korotkoff sounds. Two BP readings were obtained and averaged.
Blood-Sample Collection and Laboratory Measurements
Following a fast of 8–12 hours, venous blood was collected from each patient to measure SUA, fasting plasma glucose (FPG), fasting insulin (FIns), glycosylated hemoglobin (HbA1c), triglycerides (TGs), total cholesterol (TC), low density–lipoprotein cholesterol (LDL-C), and high density–lipoprotein cholesterol (HDL-C) the next day. HbA1c was determined by high-speed liquid chromatography (Arkray 8160). FPG, blood lipids, and SUA were measured by immunoturbidimetry (Beckman AU680). Thyroid-stimulating hormone levels and FIns were determined by immunochemiluminescence (chemiluminescence microparticle immunoassay; i2000SR, Abbott). The IR index (HOMA-IR) was calculated using the formulaIFPG × FIns/22.5 and HOMA-IS with 20 × FIns/(FPG – 3.5). Diagnosis of HUA wasin accordance with the 2019 Chinese guidelines for iagnosis and treatment of HUA and gout: fasting SUA >420 µmol/L (adults, regardless of sex). Metabolic syndrome was diagnosed according to the Diagnostic Criteria of Diabetes Society of the Chinese Medical Association in 2004: overweight or obese — BMI ≥25 kg/m2; hyperglycemia — FPG ≥6.1 mmol/L or blood-glucose ≥7.8 mmol/L at 2 hours after glucose loading and/or those who have been diagnosed with diabetes and treated; hypertension — BP ≥140/90 mmHg (1 mmHg = 0.133 kPa) and/or those who have been diagnosed with hypertension and treated; and fasting TGs ≥1.7mmol/L andor fasting HDL-L <0.9 mmol/L (male) or <1 mmol/L (female). Diagnosis can be confirmed when meeting at least three of these criteria.
Statistical Analysis
SPSS 22.0 was used for data analysis. Measurement data in line with normal distribution are expressed as mean ± SD, and those of abnormal distribution were transformed into their natural logarithm. Comparison between groups was performed by t-tests. Count data are expressed as percentages, and comparison was conducted by χ2 tests. Pearson analysis was used to compare correlations between SUA and related indicators, and partial correlation analysis was used for linear correlation after controlling for other confounding factors. In addition, logistic regression was used to analyze influential factors. P<0.05 was considered statistically significant.
Results
General Data of Subjects
Of the enrolled 153 obese patients, there were 105 males and 48 females of average age 39.57±11.39 and 42.85±13.91 years, respectively, with no significant difference (P=0.126). There were 80 cases of normal uric acid (NC group) and 73 cases of high uric acid (58 males and 15 females, with significant difference between sexes). BMI, DBP, TGs, FIns, HOMA-IR, HOMA-IS, and metabolic syndrome in the HUA group were higher than the NC group (P<0.05), while age and HDL-C were lower(P<0.05). After adjustment for sex, age and BMI, FPG in the HUA group was significantly higher than the NC group (P<0.05). Meanwhile, there was no significant difference in the prevalence of SBP, TC, LDL-C, diabetes, or hypertension between the groups (P>0.05, Tables 1 and 2 and Figures 1 and 2).
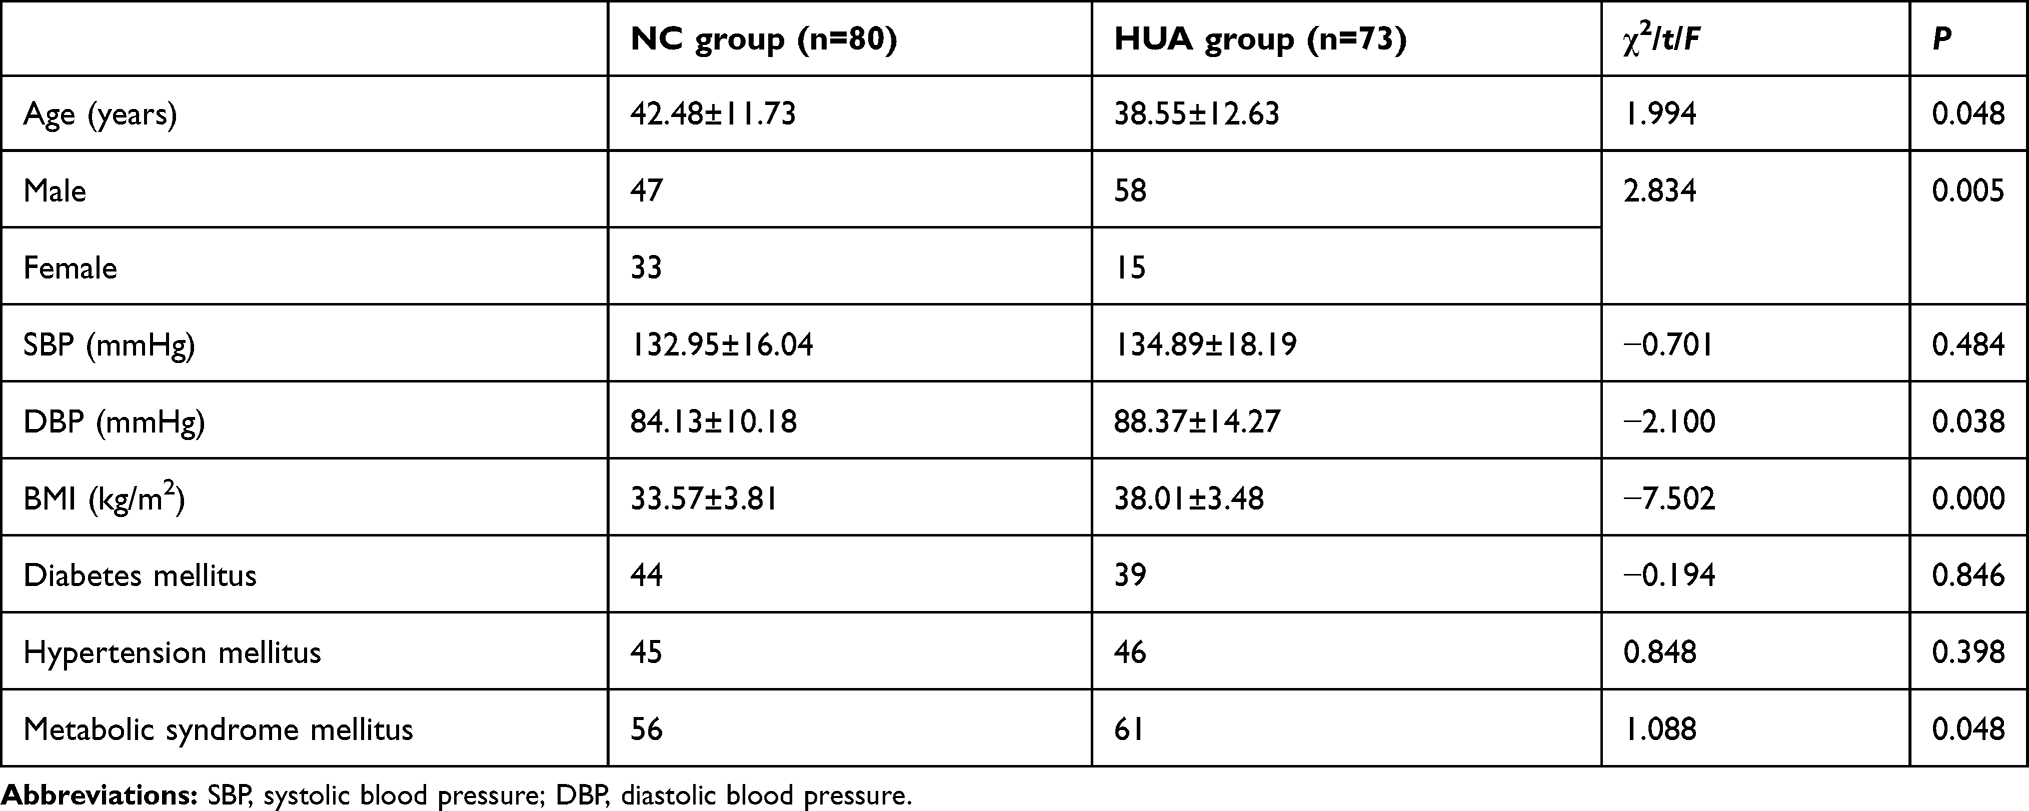 |
Table 1 Baseline Characteristics of the Study Groups |
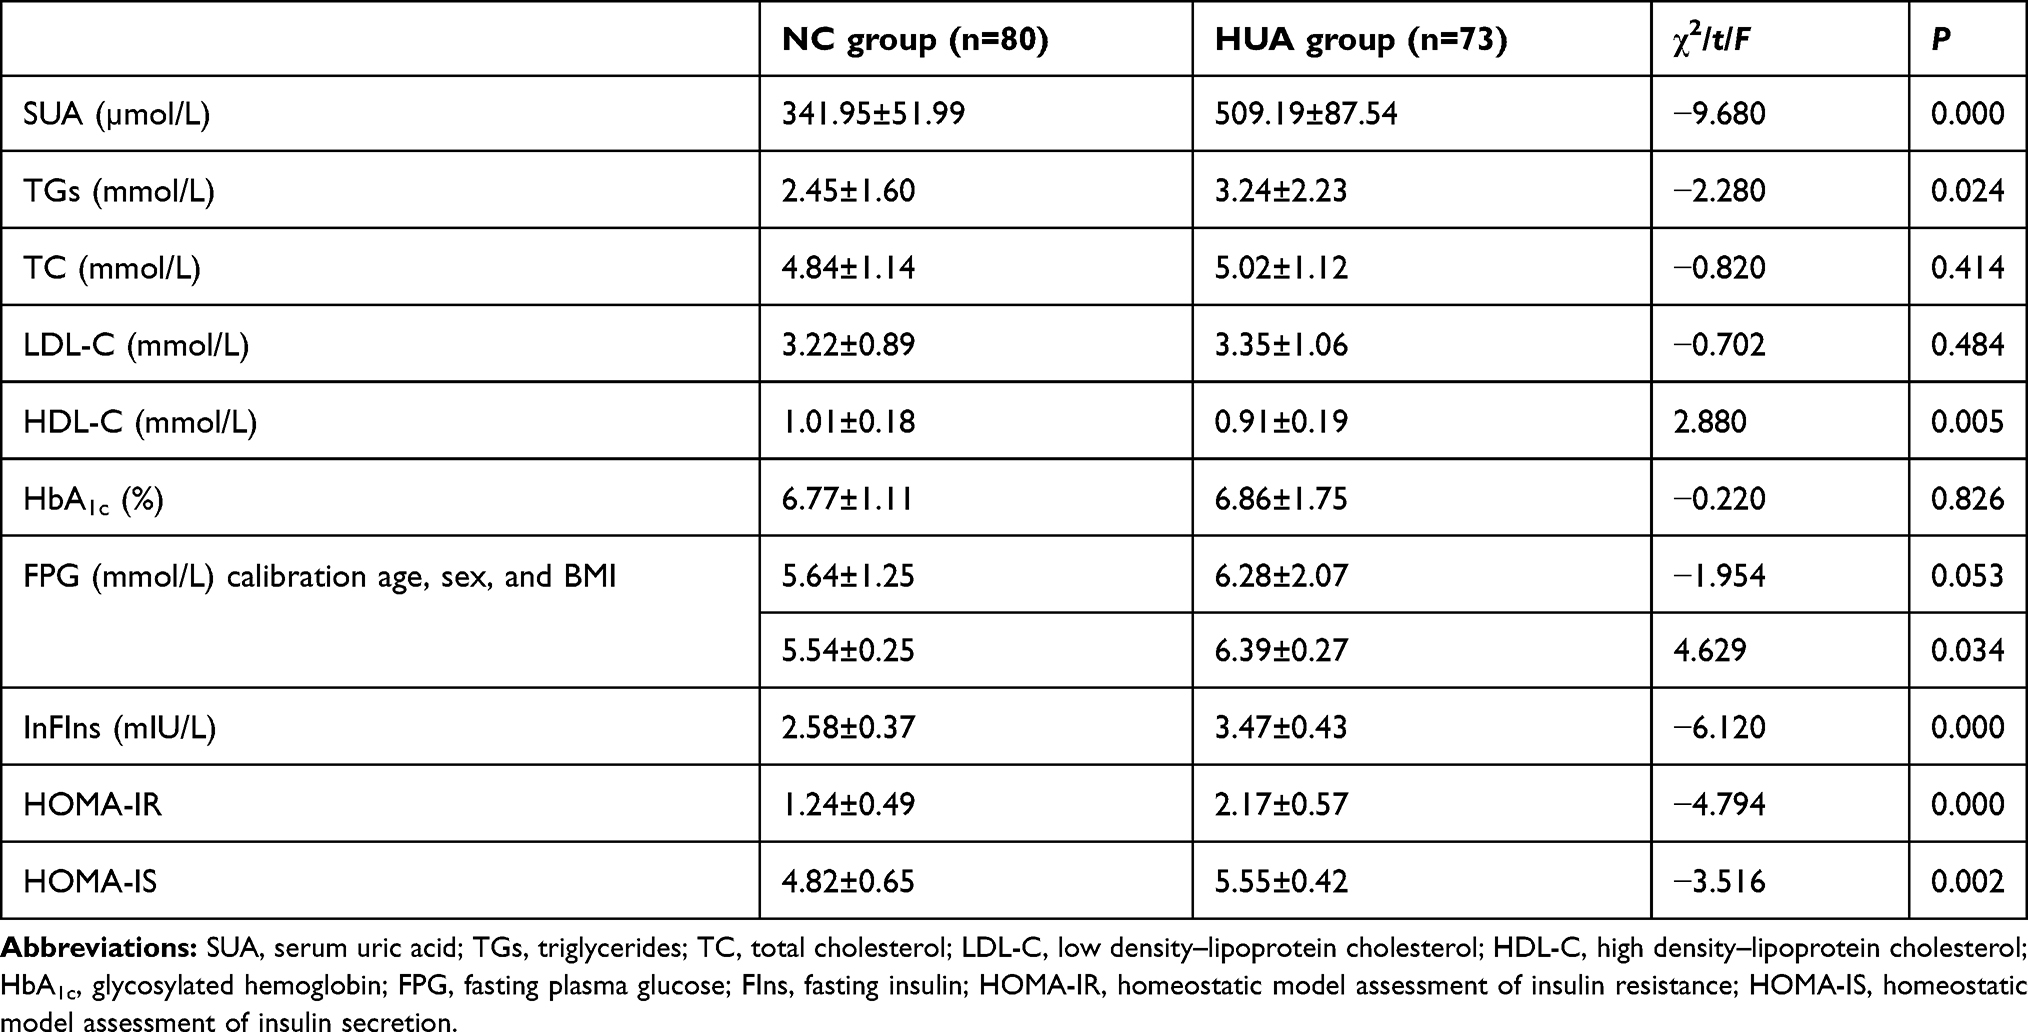 |
Table 2 Laboratory Data of the Study Cohort |
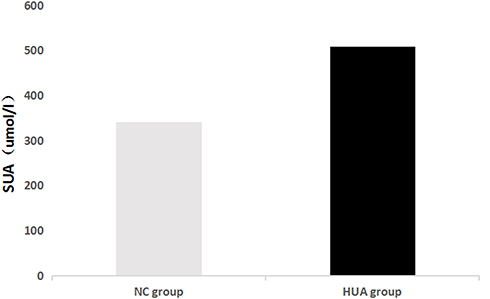 |
Figure 1 Comparison of serum uric acid levels between the NC and HUA groups. |
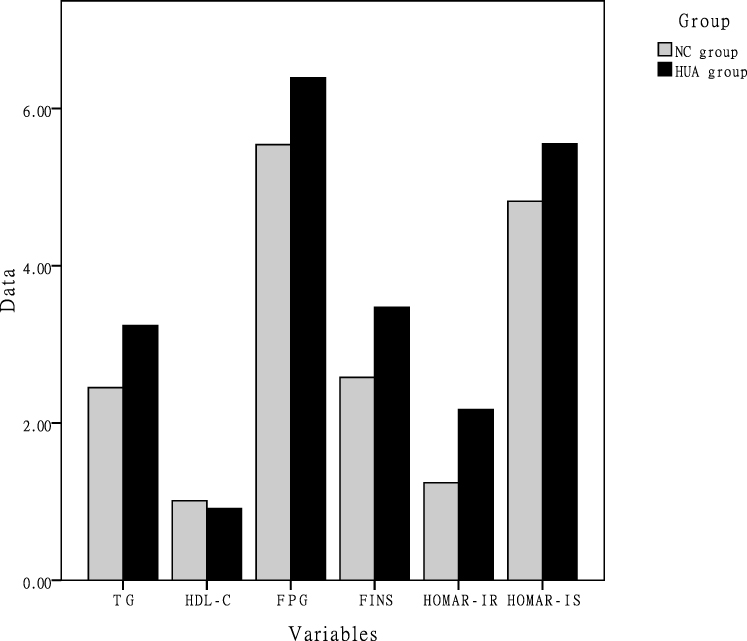 |
Figure 2 Comparison of laboratory data between the NC and HUA groups. |
Pearson Correlation Analysis of SUA Levels and Each Index
Further analysis was performed concerning correlation of SUA with age, BMI, SBP, DBP, TGs, TC, HDL-C, LDL-C, FPG, FIns, HOMA-IR, HOMA-IS, and HbA1c. SUA was positively correlated with BMI, DBP, TGs, FIns, HOMA-IR, HOMA-IS, and metabolic syndrome (P<0.05, while it exhibited negative correlations with age and HDL-C (P<0.05). After adjustment for sex and age, SUA was still positively correlated with BMI, FIns, HOMA-IR, and metabolic syndrome (P<0.05, Table 3).
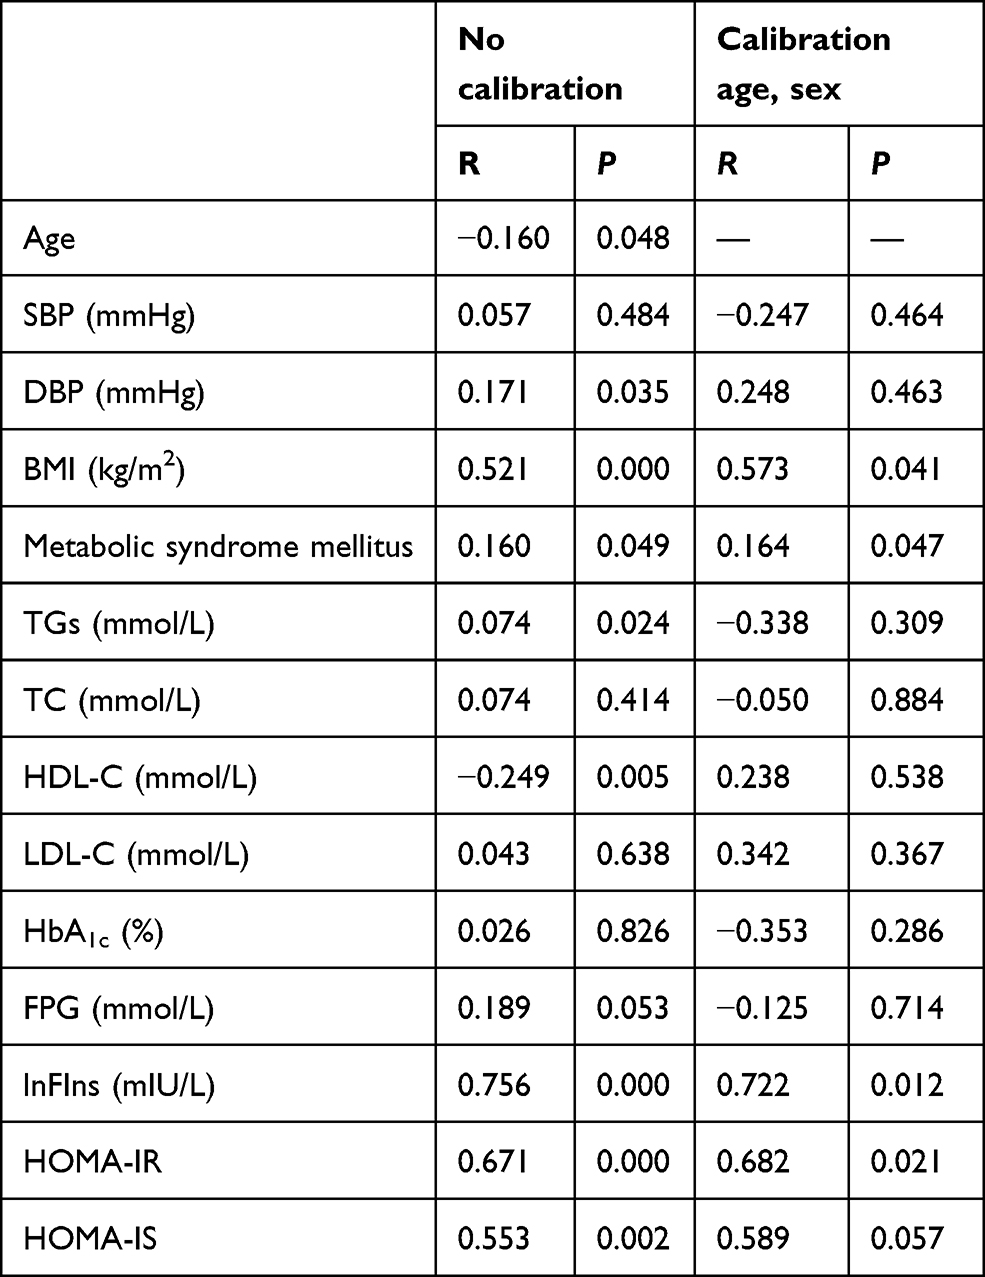 |
Table 3 Correlation Coefficients Between SUA and all Parameters |
Logistic Regression Analysis of Obesity Complicated with HUA
Univariate logistic regression analysis showed that sex, BMI, DBP, TGs, HDL-C, FIns, HOMA-IR, HOMA-IS, and metabolic syndrome were all associated with the coexistence of obesity and HUA (P<0.05). These factors were then included in the multivariate logistic regression model as independent variables. Corresponding results revealed that BMI, FIns, and HOMA-IR were independent risk factors of obesity with HUA (P<0.05). Specifically, higher values of BMI, FIns, and HOMA-IR indicated a higher risk of obesity complicated with HUA (Tables 4 and 5).
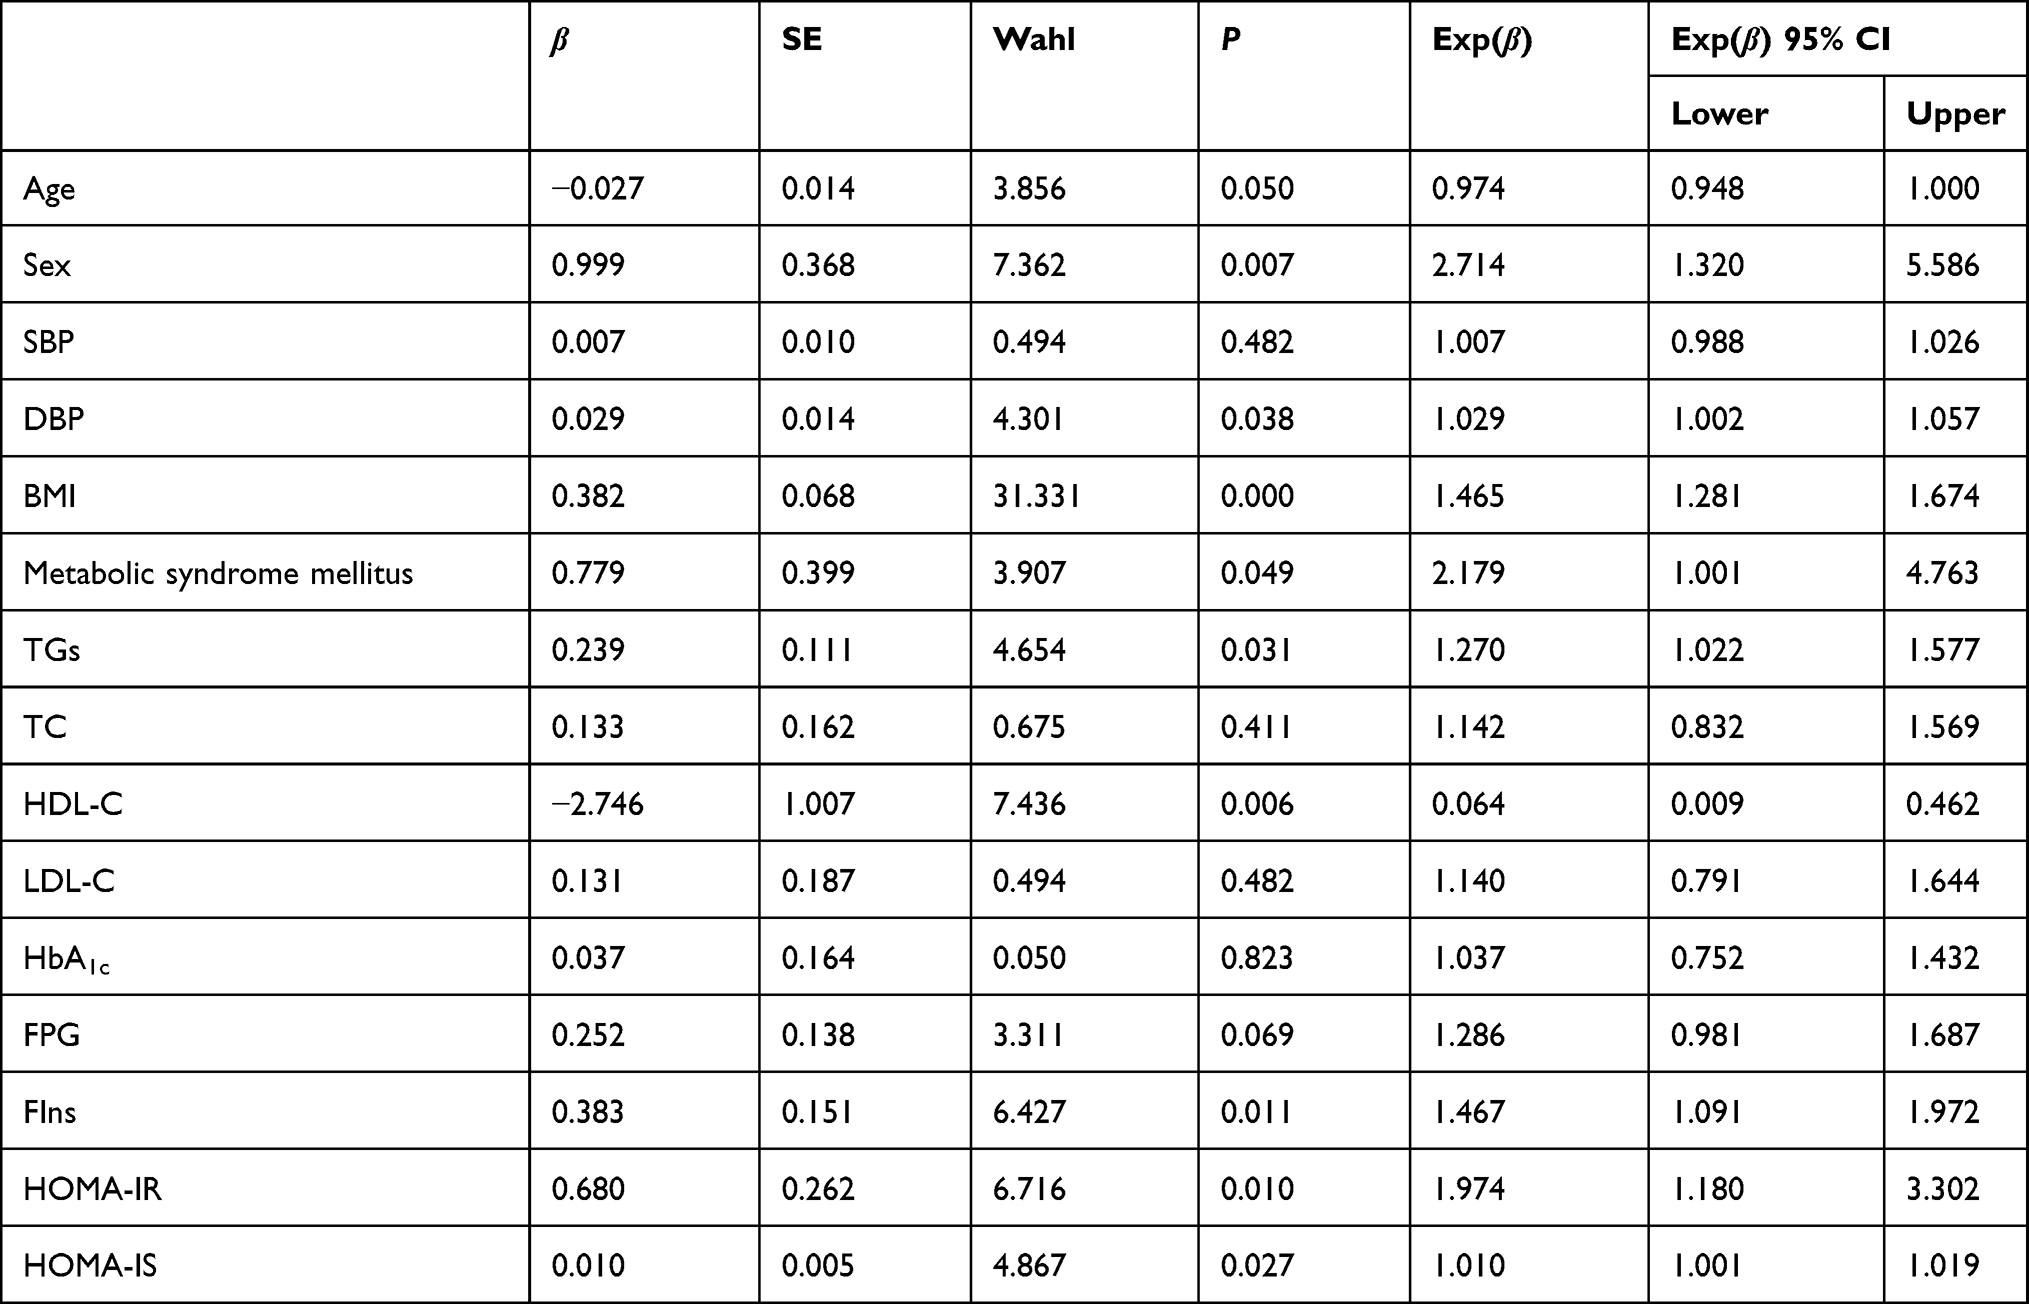 |
Table 4 Univariate Logistic Regression Analysis of Obesity with Hyperuricemia |
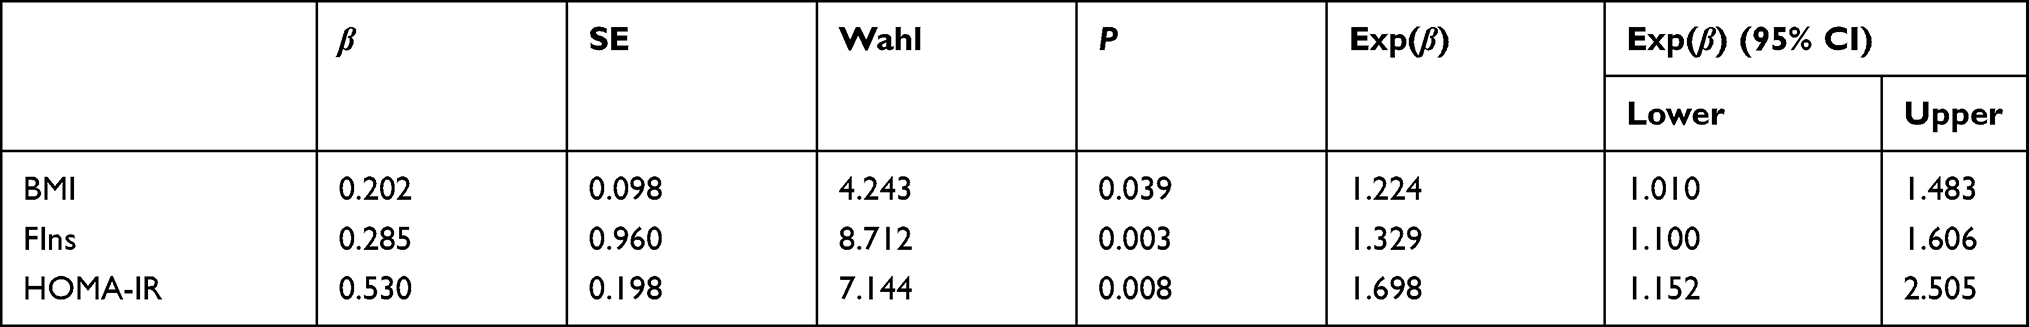 |
Table 5 Multivariate Logistic Regression Analysis of Obesity with Hyperuricemia |
Discussion
The incidence of obesity and HUA has been increasing in recent decades. Coexistence of obesity and HUA may aggravate the progress of disease, accompanied by increased medical and economic burden, which brings new challenges to the prevention and treatment of chronic diseases. Furthermore, obesity is an independent risk factor of cardiovascular diseases. The risk of sudden death in obese patients is quite high, even in the absence of organic heart disease, which may be associated with metabolic syndrome.13 It has been shown by various prospective studies that HUA is an independent risk factor of obesity.2 Compared with subjects with normal weight, obese subjects have significantly higher levels of SUA and components of metabolic syndrome. Meanwhile, obese patients exhibit higher risk of HUA. These two factors in turn increase the risk of cardiac diseases and metabolic syndrome, and SUA levels arehigher in morbidly obese patients than normal or overweight ones.14 At present, there are few studies on the level of SUA in obese subjects outside endocrinology departments. Accordingly, the present study was carried out to analyze the relationship between HUA and metabolic status in obese inpatients, with an aim to explore possible mechanisms of HUA combined with obesity.
In this study, a retrospective analysis was done on the basis of the involvement of 153 obese patients. Compared with simple obesity NC group, BMI, TGs, and metabolic syndrome in the HUA group were significantly increased, with an obvious decrease in HDL-L (P<0.05). This is attributable to decreased HDL-L and increased TGs, both of which may have an effect on the utilization of uric acid. Furthermore, following subsequent correction for sex, age, and BMI, there was still a significant difference in FPG between groups, suggesting that HUA may be a practical index to evaluate levels of glucose and lipid metabolism. This finding is consistent with Cuiling et al concerning the positive correlation between SUA and various metabolic abnormalities (including obesity, hypertension, hyperglycemia, and hyperlipidemia).15 There may be complex glucose mechanisms involved in lipid metabolism and uric acid metabolism. For example, it has been documented that SUA is associated strongly with abnormal glucose metabolism and glycotoxic aggregation.16 SUA has been revealed to be intimately related to visceral fat, but not subcutaneous fat. Different adipose-tissue repositories may have different effects on uric acid metabolism.17 Resistin/uric acid may exert a predictive role in the effect of lifestyle intervention on adolescent obese patients.18 Uric acid in saliva may also be a marker for predicting fat accumulation in young obese patients.19 Moreover, as indicated by our research, the risk of obesity with HUA was higher in males, basically consistent with a recent study in Japan,20 which also supported higher SUA in obese males, while SUA in females showed a closer relationship with metabolic syndrome and cardiovascular risk.
The BMI is a commonly recognized index to evaluate obesity. It has certain predictive value for β-cell dysfunction in different ethnic groups and populations with different glucose metabolism.21 In this study, it was discovered that increased SUA was correlated with BMI in obese patients. As shown in Figure 2, along with increased BMI, SUA in obese patients increased gradually. With further adjustment for sex and age in Pearson correlation analysis, SUA still showed a positive correlation with BMI. This is similar to previous research:22 SUA in in overweight/obese patients was significantly higher than in normal-weight subjects. However, it should be noted that the present study was performed on a Chinese population, with a relatively small sample of confirmed obese subjects. A recent study in Peru14 showed significantly increases SUA in morbidly obese patients23 (BMI ≥40 kg/m2) than normal-weight subjects, and the incidence of metabolic syndrome increased significantly, which was basically consistent with our research findings. Considering a relatively limited sample of <200 cases in this study, there was an absence of focus on the relationship between BMI and SUA in subgroups based on BMI. At present, it is still unclear what the specific mechanism of the interaction between obesity and HUA is. It is speculated to be related to an imbalance of inflammatory factors and fat factors caused by chronic inflammation and oxidative stress, as well as IR.24
In this study, there was an obvious increased trend in relevant indices of IR in the HUA group. Further multivariate logistic regression showed that BMI, hyperinsulinemia or IR were independent risk factors of HUA. Neither blood glucose nor blood lipids were involved on further regression analysis, suggesting that hyperinsulinemia and/or IR may occupy a more important role in the occurrence of HUA in obese inpatients than disorders of glucose and lipid metabolism. In this regard, there is a need to carry out weight management for obese patients with HUA, undertake timely assessments, and improve hyperinsulinemia and IR, which may obtain greater benefits than controlling glucose and lipid metabolism alone. For instance, Xiang et al25 revealed that obese patients developed hyperinsulinemia and IR and that IR exhibited a significant correlation with BMI and TGs. Meanwhile, a survey in Israel showed that HUA was a characteristic of changed hyperinsulinemia or IR.26 These results are basically consistent with this study. Both obesity and HUA may be related to IR and function significantly in the interaction between the two factors. In terms of the mechanism of IR induced by SUA, it may be related to the development of mitochondrial oxidative stress and nitric oxide damage in endothelial cells.27
It has been documented that following the quantification of IR by HOMA-IR, obesity was still associated with IR in young overweight and obese people. IR appeared earlier in this population, accompanied by a higher risk of dyslipidemia and hypertension.28 Furthermore, HUA-induced oxidative stress in adipocytes may have an effect on the development of obesity. To be specific, uric acid has a strong antioxidant function extracellularly. It can enter adipocytes through certain anion transporters (eg, URAT1) to make adipocytes dysfunctional, thus enhancing the lipolysis of adipose tissue, resulting in the increase of some adipocytokine (eg, TNFα, IL6, and resistin) secretion, a decrease in adiponectin secretion, and eventually a reduction in the sensitivity of IR. On the other hand, uric acid can lead to IR by reducing nitric oxide production and bioavailability. On the contrary, IR can induce HUA by affecting the excretion of uric acid by the kidneys. In addition, disorders of glucose and lipid metabolism may also constitute an indirect influence in the development of IR-induced HUA.29
In obese people with HUA, weight management is an effective nonmedical therapy to reduce SUA,30 especially in males and postmenopausal females.14 SUA possesses the functions of oxidative stress and proinflammatory reaction similar to cytokines, and may also be one of the triggers of obesity. Attention should be paid to uric acid metabolism as well as glucose and lipid metabolism in such populations. Early interventions based on SUA may have a role in improving clinical outcomes of obesity, metabolic syndrome, and cardiovascular disease.31 Furthermore, high insulin or IR in obese patients may be associated with the occurrence and development of HUA. In the clinical setting, there is a need to carry out weight management for subjects with obesity and HUA, address of glucose and lipid-metabolism disorders, and evaluate and improve hyperinsulinemia and IR in timely fashion. Simultaneously, attention should also be paid to the prevention of and intervention for obesity-related complications. There is still a lack of large-scale prospective studies to verify whether early intervention of HUA in obese patients can delay the occurrence of obesity-related complications. However, the present study was retrospective with a relatively small sample. More large-scale clinical randomized controlled trials are needed to evaluate the relationship between uric acid metabolism and lipid metabolism, so as to provide new insights for the prevention and treatment of obesity and HUA.
Limitations
Our study has several limitations. First, this was a cross-sectional study, meaning that the findings cannot explicitly point to a causal relationship. Second, the participants were recruited from south China, so the conclusions cannot represent the situation in other regions of China. Third, we did not perform detailed body-composition analysis (eg, visceral fat), due to budget constraints. Nocturnal BP could not be monitored dynamically, because subjects were involved with multiple departments.
Conclusion
High insulin levels or IR in obese patients may be associated with the occurrence and development of HUA. In the clinical setting, there is a need to carry out weight management for subjects with obesity and HUA, address glucose and lipid-metabolism disorders, and evaluate and improve hyperinsulinemia and IR in timely fashion. Aggressive strategies aimed at the prevention and treatment of obesity-related metabolic problems are needed, especially metabolic disorders involving uric acid.
Ethics Approval and Consent to Participate
The study was approved by the ethics committee of Xiangya Hospital of Central South University (Changsha, China) and was conducted in accordance with the Declaration of Helsinki. All procedures were performed in accordance with ethical standards. All study participants were informed that data obtained from them would be used only for this study purpose. Confidentiality of the data was maintained, and their names were not recorded. The methods in the study were in accordance with relevant guidelines, and informed consent was obtained from all participants.
Funding
This work was supported by the National Natural Science Foundation (81873643) and the Foundation of Hunan Provincial Science and Technology Department (2018ZK4033, 2019JJ40517), China.
Disclosure
No potential conflict of interest is reported by the authors.
References
1. De Pergola G, Martino T, Zupo R, et al. 25 hydroxyvitamin D levels are negatively and independently associated with fat mass in a cohort of healthy overweight and obese subjects. Endocrinol Metab. 2019;19(6):838–844.
2. Rospleszcz S, Dermyshi D, Müller-Peltzer K, et al. Association of serum uric acid with visceral, subcutaneous and hepatic fat quantified by magnetic resonance imaging. Sci Rep. 2020;10(1):1–9. doi:10.1038/s41598-020-57459-z
3. Yoo HG, Lee SI, Chae HJ, et al. Prevalence of insulin resistance and metabolic syndrome in patients with gouty arthritis. Rheumatol Int. 2011;31(4):485–491. doi:10.1007/s00296-009-1304-x
4. Chang JB, Chen YL, Hung YJ, et al. The role of uric acid for predicting future metabolic syndrome and type 2 diabetes in older people. J Nutr Health Aging. 2017;21(3):329–335. doi:10.1007/s12603-016-0749-3
5. Chu FY, Chang CC, Huang PH, et al. The association of uric acid calculi with obesity, prediabetes, type 2 diabetes mellitus, and hypertension. Biomed Res Int. 2017;2017:1–6.
6. Matsuura F, Yamashita S, Nakamura T, et al. Effect of visceral fat accumulation on uric acid metabolism in male obese subjects: visceral fat obesity is linked more closely to overproduction of uric acid than subcutaneous fat obesity. Metabolism. 1998;47(8):929–933. doi:10.1016/S0026-0495(98)90346-8
7. Ozalp Kizilay D, Sen S, Ersoy B. Associations between serum uric acid levels and cardiometabolic risk, renal injury in obese and overweight children. Clin Res Pediatr Endocrinol. 2019;11(3):262–269. doi:10.4274/jcrpe.galenos.2018.2019.0241
8. Bardin T, Richette P. Impact of comorbidities on gout and hyperuricaemia: an update on prevalence and treatment options. BMC Med. 2017;15(1):123. doi:10.1186/s12916-017-0890-9
9. Drenick EJ, Bale GS, Seltzer F, et al. Excessive mortality and causes of death in morbidly obese men. JAMA. 1980;243(5):443–445. doi:10.1001/jama.1980.03300310031018
10. Ali N, Miah R, Hasan M, et al. Association between serum uric acid and metabolic syndrome: a cross-sectional study in Bangladeshi adults. Scientific Rep. 2020;(10).
11. Lee C-L, Tsai S-F. Association between mortality and serum uric acid levels in non-diabetes-related chronic kidney disease: an analysis of the national health and nutrition examination survey, USA, 1999–2010. Nature Res. 2020;10(1):75–85.
12. Ali N, Perveen R, Rahman S, et al. Prevalence of hyperuricemia and the relationship between serum uric acid and obesity: a study on Bangladeshi adults. PLoS One. 2018.
13. Huang X-B, Zhang W-Q, Tang -W-W, et al. Prevalence and associated factors of hyperuricemia among urban adults aged 35–79 years in southwestern China: a community-based cross-sectional Study. Nature Res. 2020;10:15683.
14. Inanir M. Serum uric acid (SUA) in morbidly obese patients and its relationship with metabolic syndrome. Aging Male. 2020;1–5. doi:10.1080/13685538.2020.1713742
15. Zhu C, Cui R, Gao M, et al. The associations of serum uric acid with obesity-related acanthosis nigricans and related metabolic indices. Int J Endocrinol. 2017;2017:1–9.
16. Bin L, Cui-ping L, Ye-hua Y, et al. Relevant factors of hyperuricemia in elderly patients with type 2 diabetes. Chin J Cardiovasc Med. 2013;18(5):350–353.
17. Kim TH, Lee SS, Yoo JH, et al. The relationship between the regional abdominal adipose tissue distribution and the serum uric acid levels in people with type 2 diabetes mellitus. Diabetol Metab Syndr. 2012;4(1):3. doi:10.1186/1758-5996-4-3
18. Zurita-Cruz J, Villasis-Keever M, Manuel-Apolinar L, et al. Resistin/uric acid index as a prognostic factor in adolescents with obesity after lifestyle intervention. J Pediatr. 2020;219:38–42. doi:10.1016/j.jpeds.2019.12.006
19. Araujo DS, de Oliveira Scudine KG, Pedroni-Pereira A, et al. Salivary uric acid is a predictive marker of body fat percentage in adolescents. Nutr Res. 2020;74:62–70. doi:10.1016/j.nutres.2019.11.007
20. Tani S, Matsuo R, Imatake K, et al. The serum uric acid level in females may be a better indicator of metabolic syndrome and its components than in males in a Japanese population. J Cardiol. 2020;59(3):1–9.
21. Liu -M-M, Wang M, Wu J, et al. Waist-to-hip ratio is the most relevant obesity index at each phase of insulin secretion among obese patients. J Diabetes Complications. 2018;32(7):670–676. doi:10.1016/j.jdiacomp.2018.04.006G
22. Yue-liang H, Ma J, Bi-wen T, et al. Relationship between serum uric acid level and subclinical target organ damage. Shanghai Kiatong Univ Med Sci. 2019;39(2):160–164.
23. Jensen MD, Ryan DH, Apovian CM, et al. 2013 AHA/ACC/TOS guideline for the management of overweight and obesity in adults: a report of the American College of Cardiology/American Heart Association task force on practice guidelines and the obesity society. J Am Coll Cardiol. 2014;63(25):2985–3023. doi:10.1016/j.jacc.2013.11.004
24. Yoo TW, Sung KC, Shin HS, et al. Relationship between serum uric acid concentration and insulin resistance and metabolic syndrome. Circ J. 2005;69(8):928–933. doi:10.1253/circj.69.928
25. Xiang SZ, Jing W, Xiang LM. Alterations of serum insulin, true insulin in patients with simple obesity and analyses of factors affecting insulin resistance. Chin Physician. 2003;5(3):301–303.
26. Xiaojie QU, Bai X, Xiuying WU, et al. Role of glucose transporter 2 and 4 in insulin resistance in spontaneous hyperuricemia mice. Chin J Endocrinol MetaB. 2018;34(10):862–866.
27. King C, Lanaspa MA, Jensen T, et al. Uric acid as a cause of the metabolic syndrome. Contrib Nephrol. 2018;192:88–102.
28. Sakou II, Psaltopoulou T, Sergentanis TN, et al. Insulin resistance and cardiometabolic risk factors in obese children and adolescents: a hierarchical approach. J Pediatr Endocrinol Metab. 2015;28(5–6):589–596. doi:10.1515/jpem-2014-0431
29. Clausen JO, Borch-Johnsen K, Ibsen H, et al. Analysis of the relationship between fasting serum uric acid and the insulin sensitivity index in a population-based sample of 380 young healthy Caucasians. Eur J Endocrinol. 1998;138:63–69. doi:10.1530/eje.0.1380063
30. Ishizaka N, Ishizaka Y, Toda A, et al. Changes in waist circumference and body mass index in relation to changes in serum uric acid in Japanese individuals. J Rheumatol. 2010;37(2):410–416. doi:10.3899/jrheum.090736
31. Goicoechea M, de Vinuesa SG, Verdalles U, et al. Allopurinol and progression of CKD and cardiovascular events: long-term follow-up of a randomized clinical trial. Am J Kidney Dis. 2015;65(4):543–549. doi:10.1053/j.ajkd.2014.11.016
 © 2021 The Author(s). This work is published and licensed by Dove Medical Press Limited. The full terms of this license are available at https://www.dovepress.com/terms.php and incorporate the Creative Commons Attribution - Non Commercial (unported, v3.0) License.
By accessing the work you hereby accept the Terms. Non-commercial uses of the work are permitted without any further permission from Dove Medical Press Limited, provided the work is properly attributed. For permission for commercial use of this work, please see paragraphs 4.2 and 5 of our Terms.
© 2021 The Author(s). This work is published and licensed by Dove Medical Press Limited. The full terms of this license are available at https://www.dovepress.com/terms.php and incorporate the Creative Commons Attribution - Non Commercial (unported, v3.0) License.
By accessing the work you hereby accept the Terms. Non-commercial uses of the work are permitted without any further permission from Dove Medical Press Limited, provided the work is properly attributed. For permission for commercial use of this work, please see paragraphs 4.2 and 5 of our Terms.