")
Back to Journals » International Journal of Nephrology and Renovascular Disease » Volume 15
Serum Phosphorus and Pill Burden Among Hemodialysis Patients Prescribed Sucroferric Oxyhydroxide: One-Year Follow-Up on a Contemporary Cohort
Authors Kendrick JB, Zhou M, Ficociello LH , Parameswaran V, Mullon C , Anger MS , Coyne DW
Received 9 December 2021
Accepted for publication 19 March 2022
Published 11 April 2022 Volume 2022:15 Pages 139—149
DOI https://doi.org/10.2147/IJNRD.S353213
Checked for plagiarism Yes
Review by Single anonymous peer review
Peer reviewer comments 2
Editor who approved publication: Professor Pravin Singhal
Jessica B Kendrick,1 Meijiao Zhou,2 Linda H Ficociello,2 Vidhya Parameswaran,2 Claudy Mullon,2 Michael S Anger,2,3 Daniel W Coyne4
1University of Colorado Anschutz Medical Campus, Aurora, CO, USA; 2Fresenius Medical Care Global Medical Office, Waltham, MA, USA; 3Unversity of Colorado School of Medicine, Denver, CO, USA; 4Washington University School of Medicine, St. Louis, MO, USA
Correspondence: Daniel W Coyne, Washington University School of Medicine, 660 S. Euclid Ave, St. Louis, MO, 63110, USA, Tel +1 314-362-7603, Fax +1 314-747-5213, Email [email protected]
Purpose: In prior analyses of real-world cohorts of hemodialysis patients switched from one phosphate binder (PB) to sucroferric oxyhydroxide (SO), SO therapy has been associated with improvements in serum phosphorus (sP) and reductions in daily PB pill burden. To characterize how SO initiation patterns have changed over time, we examined the long-term effectiveness of SO in a contemporary (2018– 2019) cohort.
Patients and Methods: Adult Fresenius Kidney Care hemodialysis patients first prescribed SO monotherapy as part of routine care between May 2018 and May 2019 (N = 1792) were followed for 1 year. All patients received a non-SO PB during a 91-day baseline period before SO prescription. Mean PB pills/day and laboratory parameters were compared before and during SO treatment. Results were divided into consecutive 91-day intervals (Q1–Q4) and analyzed using linear mixed-effects regression and Cochran’s Q test. These results were contrasted with findings from a historical (2014– 2015) cohort (N = 530).
Results: The proportion of patients achieving sP ≤ 5.5 mg/dl increased after switching to SO (from 27.0% at baseline to 37.8%, 45.1%, 44.7%, and 44.0% at Q1, Q2, Q3, and Q4, respectively; P < 0.0001 for all). The mean daily PB pill burden decreased from a baseline of 7.7 to 4.4, 4.6, 4.8, and 4.9, respectively, across quarters (P < 0.0001 for all). Patients in the contemporary cohort had improved sP control (27.0% achieving sP ≤ 5.5 mg/dl vs 17.7%) and lower daily PB pill burden (mean 7.7 vs 8.5 pills/day) at baseline than those in the historical cohort. Overall use of active vitamin D was similar between cohorts, although higher use of oral active vitamin D (63.9% vs 15.7%) and lower use of IV active vitamin D lower (23.4% vs 74.2%) was observed in the contemporary cohort.
Conclusion: Despite evolving treatment patterns, switching to SO resulted in improved sP control with fewer pills per day in this contemporary hemodialysis cohort.
Keywords: sucroferric oxyhydroxide, hemodialysis, pill burden, serum phosphorus, phosphate binder
Introduction
Hyperphosphatemia is a common complication of advanced chronic kidney disease (CKD), accompanied by hypocalcemia and low serum levels of vitamin D that often lead to secondary hyperparathyroidism and defects in bone mineral metabolism.1 Without treatment, high serum phosphorus (sP) levels are associated with increased cardiovascular morbidity and mortality.1–3
Because dietary phosphate restriction and dialysis treatment are often inadequate to manage hyperphosphatemia, administration of oral phosphate binders (PBs) that limit phosphorus absorption from ingested food is essential to maintain sP levels for most CKD patients on dialysis.4,5 Both calcium-based binders (eg, calcium acetate and calcium carbonate) and non–calcium-based binders, including sevelamer, lanthanum carbonate, and iron-based binders (eg, sucroferric oxyhydroxide and ferric citrate), have been shown to effectively lower sP levels.6,7 However, most PBs are associated with high daily pill burden (hereinafter “pill burden”) and low treatment adherence, which can in turn lead to increased sP concentrations.8,9 Additionally, high doses of calcium-based binders are associated with an increased risk of hypercalcemia, vascular calcification, and cardiovascular disease.10,11
Sucroferric oxyhydroxide (SO; Velphoro®, Fresenius Medical Care Renal Therapies Group, Waltham, MA, USA) is a non-calcium, chewable, iron-based PB indicated for the treatment of hyperphosphatemia in CKD patients undergoing dialysis.12 Clinical trial and real-world data have demonstrated the effectiveness of SO in managing sP levels with reduced pill burdens among dialysis patients.12–14 Previous real-world evidence includes data from a large (N = 530) cohort analysis of patients prescribed SO within the first 2 years following SO availability in the United States (2014 cohort).14 Within a year of switching to SO, the proportion of patients in this cohort achieving target sP levels (sP ≤5.5 mg/dl) increased from 17.7% at baseline to 36.0% and the mean PB pill burden decreased from 8.5 to 4.0–4.3 pills/day. Improvements in sP were seen independent of baseline PB (ie, calcium acetate, lanthanum carbonate, sevelamer, or others). Improvements in sP control and reductions in PB pill burden were also observed in prespecified subgroups of interest (ie, Black/African American patients, Hispanic/Latino patients, and women). Transitioning to SO appeared to allow for improved nutritional status and was associated with significant increases in phosphorus-attuned albumin and phosphorus-attuned protein intake (normalized protein catabolic rate [nPCR]).
With continued availability of SO and increased clinical experience with this agent, prescription patterns may have changed over time. The current retrospective study aimed to assess the characteristics, treatment patterns, and changes in sP and PB pill burden over 1 year of follow-up in a real-world population of hemodialysis patients prescribed SO in 2018–2019 (2018 cohort) and to compare these results with prior findings.14
Methods
Data Source and Patient Population
De-identified demographic and clinical data as well as medication prescription information were retrospectively extracted from the Fresenius Kidney Care (FKC) data warehouse and Fresenius pharmacy database. Adult (≥18 years) in-center hemodialysis patients from FKC who switched from another PB monotherapy to SO monotherapy between May 2018 and May 2019 as part of routine care were included. Eligible patients had 1 year of uninterrupted SO prescriptions and at least 1 sP measurement during the 3 months before SO prescription. Observation periods were divided into consecutive 91-day intervals and defined as baseline (−Q1; 3 months before SO prescription) and SO follow-up (Q1 through Q4; 12 months of SO prescription). This study was reviewed by the New England Independent Review Board (NEIRB) and determined to be exempted under the Common Rule and applicable guidance. Data were stored electronically on a network drive only accessible to our staff.
Data Assessments and Clinical Parameters
Demographic and treatment patterns were characterized at baseline. Clinical and laboratory parameters included mineral bone disorder (MBD) markers (sP, serum calcium, and serum intact parathyroid hormone [iPTH]); nutritional and clearance parameters (serum albumin, pre-dialysis weight, nPCR, and equilibrated Kt/V); anemia and iron indices (ferritin, transferrin saturation [TSAT], and hemoglobin); and dose and use of MBD medications (PB, active vitamin D, and calcimimetics) and anti-anemia therapies (intravenous [IV] iron sucrose and IV erythropoiesis-stimulating agents [ESAs]). Corrected serum calcium was calculated using the formula of Orrell to account for albumin binding.15
Blood samples were collected as part of routine clinical care (generally on the same day of each week), using standardized methods at FKC clinics, and analyzed at Spectra Laboratories, a subsidiary of Fresenius Medical Care North America (Rockleigh, NJ, USA). Laboratory tests were measured monthly except for hemoglobin, which was measured weekly, and serum ferritin and iPTH, which were measured quarterly per standard practice at FKC facilities. Data regarding the use and dosages of concomitant medications were evaluated quarterly. Categorical evaluation of sP concentrations (ie, sP ≤5.5 mg/dl per National Kidney Foundation [NKF]–Kidney Disease Outcomes Quality Initiative [KDOQI] recommendations and sP ≤4.5 mg/dl per Kidney Disease: Improving Global Outcomes [KDIGO] guidelines)6,16,17 was conducted quarterly.
Statistical Analysis
Baseline characteristics are presented as median (interquartile range, IQR) for continuous variables and number of patients (percentage) for categorical variables. To further characterize sP levels, they were categorized as ≤5.5 mg/dl, 5.6–6.5 mg/dl, 6.6–7.5 mg/dl, 7.6–8.5 mg/dl, and >8.5 mg/dl. Quarterly means of continuous data were calculated using linear mixed-effects regression. Summary statistics are presented as least-squares means (standard error [SE]) with comparison across treatment periods (overall P values) and comparisons between baseline and follow-up periods. Cochran’s Q test and McNemar chi-square test were used to evaluate differences in categorical variables. A stratified analysis by baseline PB was performed, as well as subgroup analyses for Black/African American patients, Hispanic/Latino patients, and women. Two-tailed P values <0.05 were considered statistically significant. Formal statistical testing was not conducted on monthly data. All analyses were carried out with SAS (version 9.4; SAS Institute Inc, Cary, NC, USA).
A sensitivity analysis was conducted among all patients who switched from non-SO PB monotherapy at baseline to SO monotherapy during follow-up between May 2018 and May 2019. In contrast with the primary analysis, in addition to including all patients with 1 year of uninterrupted SO prescriptions, it also included patients who 1) died, 2) transferred to a non-Fresenius facility, 3) received a kidney transplant, or 4) discontinued SO for other reasons. Quarterly analyses included all those patients with SO prescriptions and sP data in the quarter being analyzed.
Results
Study Participants
Patients initiating SO monotherapy between May 2018 to May 2019, were eligible for one year follow up analysis if they were prescribed a non-SO PB monotherapy during a 3-month baseline, had serum phosphorus measured during that baseline and at least one measure during follow-up, and were not discharged from an FKC clinic during one-year follow-up (n=3479). Patients who stopped the prescription of SO (n= 1508) or continued SO with another PB (n=179) during the follow up year were not included, leaving a total of 1792 for the present analysis. Demographic and baseline characteristics of this cohort are summarized in Table 1. The median age of patients in the cohort was 57 years and the median dialysis vintage was 33.9 months. Black/African American patients comprised 42.2% of the cohort and nearly 15% of the patients were Hispanic/Latino. Diabetes was the most common primary cause of kidney failure, accounting for nearly half of the cases in the group. Sevelamer was the most prescribed (46.9%) PB monotherapy at baseline, followed by calcium acetate (36.0%), ferric citrate (6.4%), and lanthanum carbonate (3.0%).
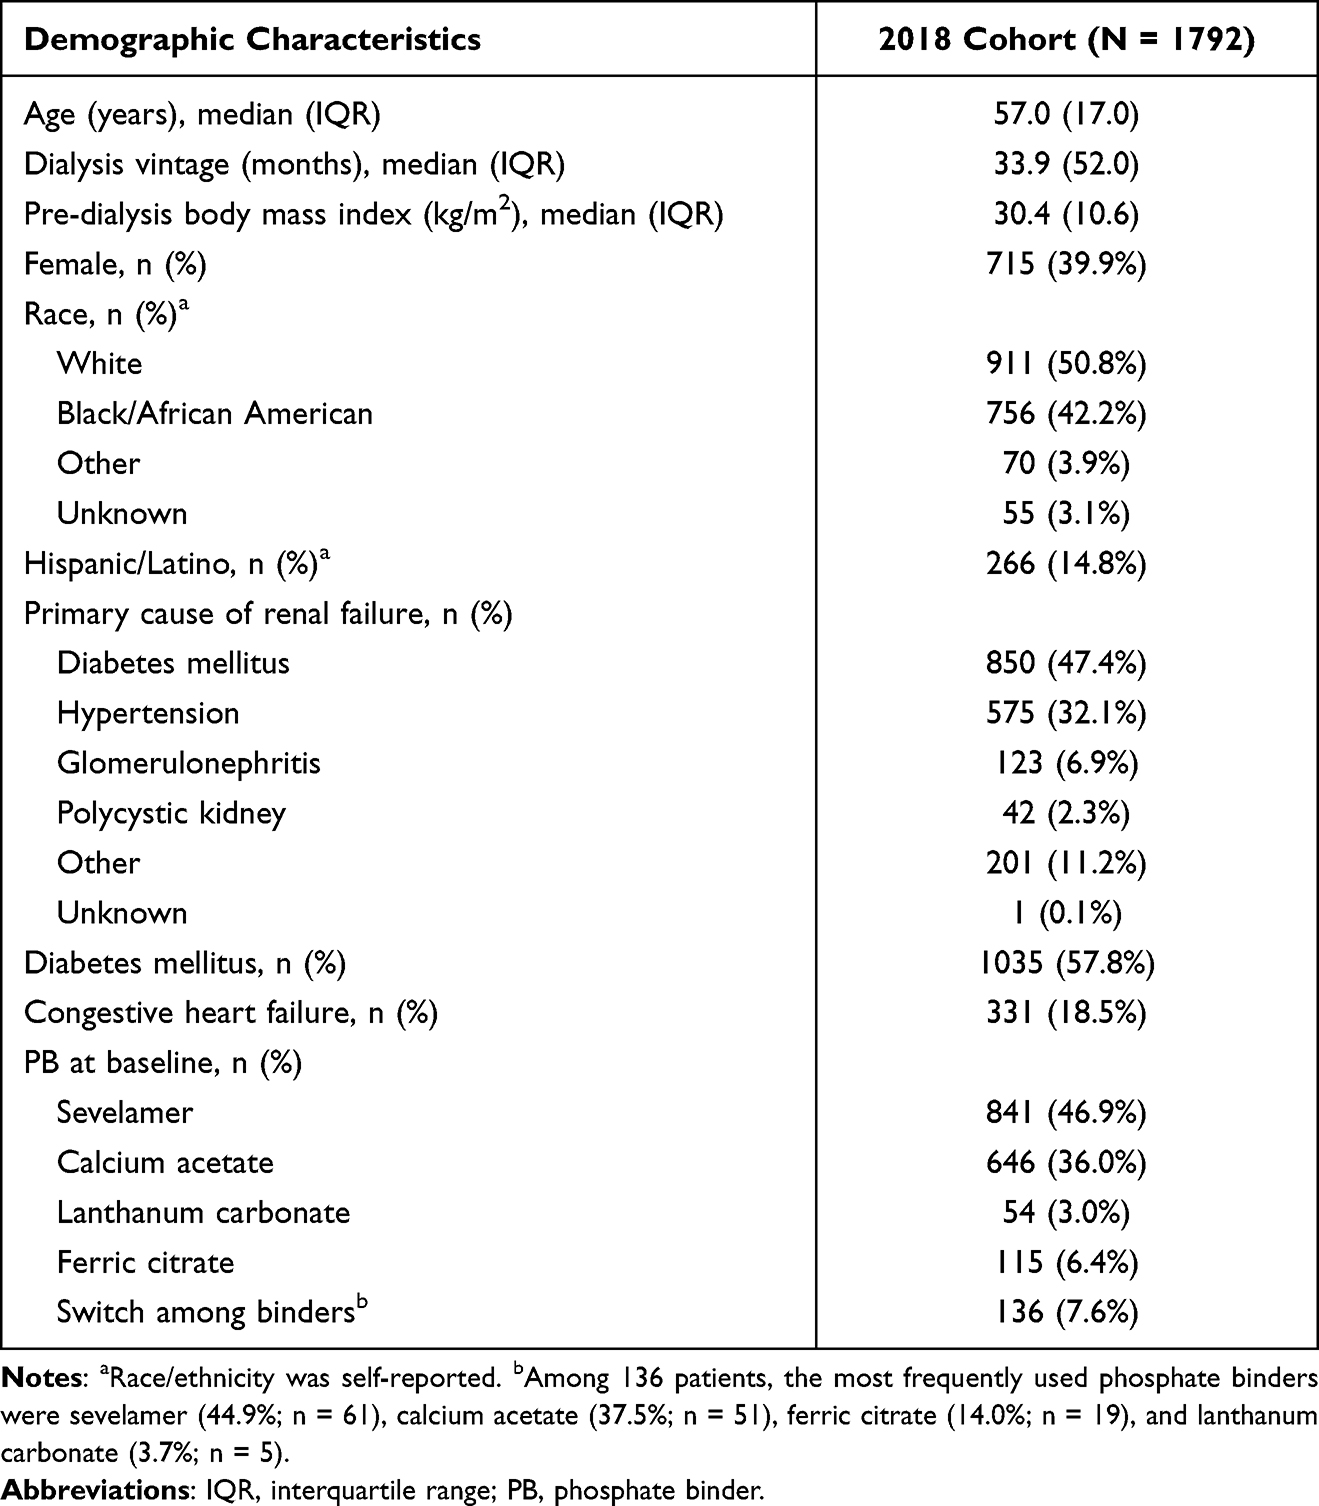 |
Table 1 Patient Characteristics at Baseline |
Serum Phosphorus and Pill Burden in the Overall Cohort
Changes in sP and pill burden among the 2018 cohort after switching to SO are shown in Figure 1 and Table 2. At baseline, the mean (SE) sP was 6.38 (0.03) mg/dl, with 27.0% of patients having achieved in-range sP concentrations (ie, sP ≤5.5 mg/dl) prior to switching to SO. After switching to SO, mean sP was reduced during the entire follow-up period (P < 0.0001) and at each follow-up quarter (P < 0.0001 vs baseline), with a nadir of 5.88 (0.03) mg/dl in Q3. Similarly, the proportion of patients achieving target sP was higher (vs baseline) throughout the SO treatment period (37.8%, 45.1%, 44.7%, and 44.0% at Q1, Q2, Q3, and Q4, respectively; P < 0.0001 for each quarter vs baseline and overall). The proportion of patients achieving more stringent sP control (ie, sP ≤4.5 mg/dl) increased from 8.4% at baseline to 12.7%, 16.8%, 17.4%, and 17.0% at Q1, Q2, Q3, and Q4, respectively (P < 0.0001 for each quarter vs baseline and overall).
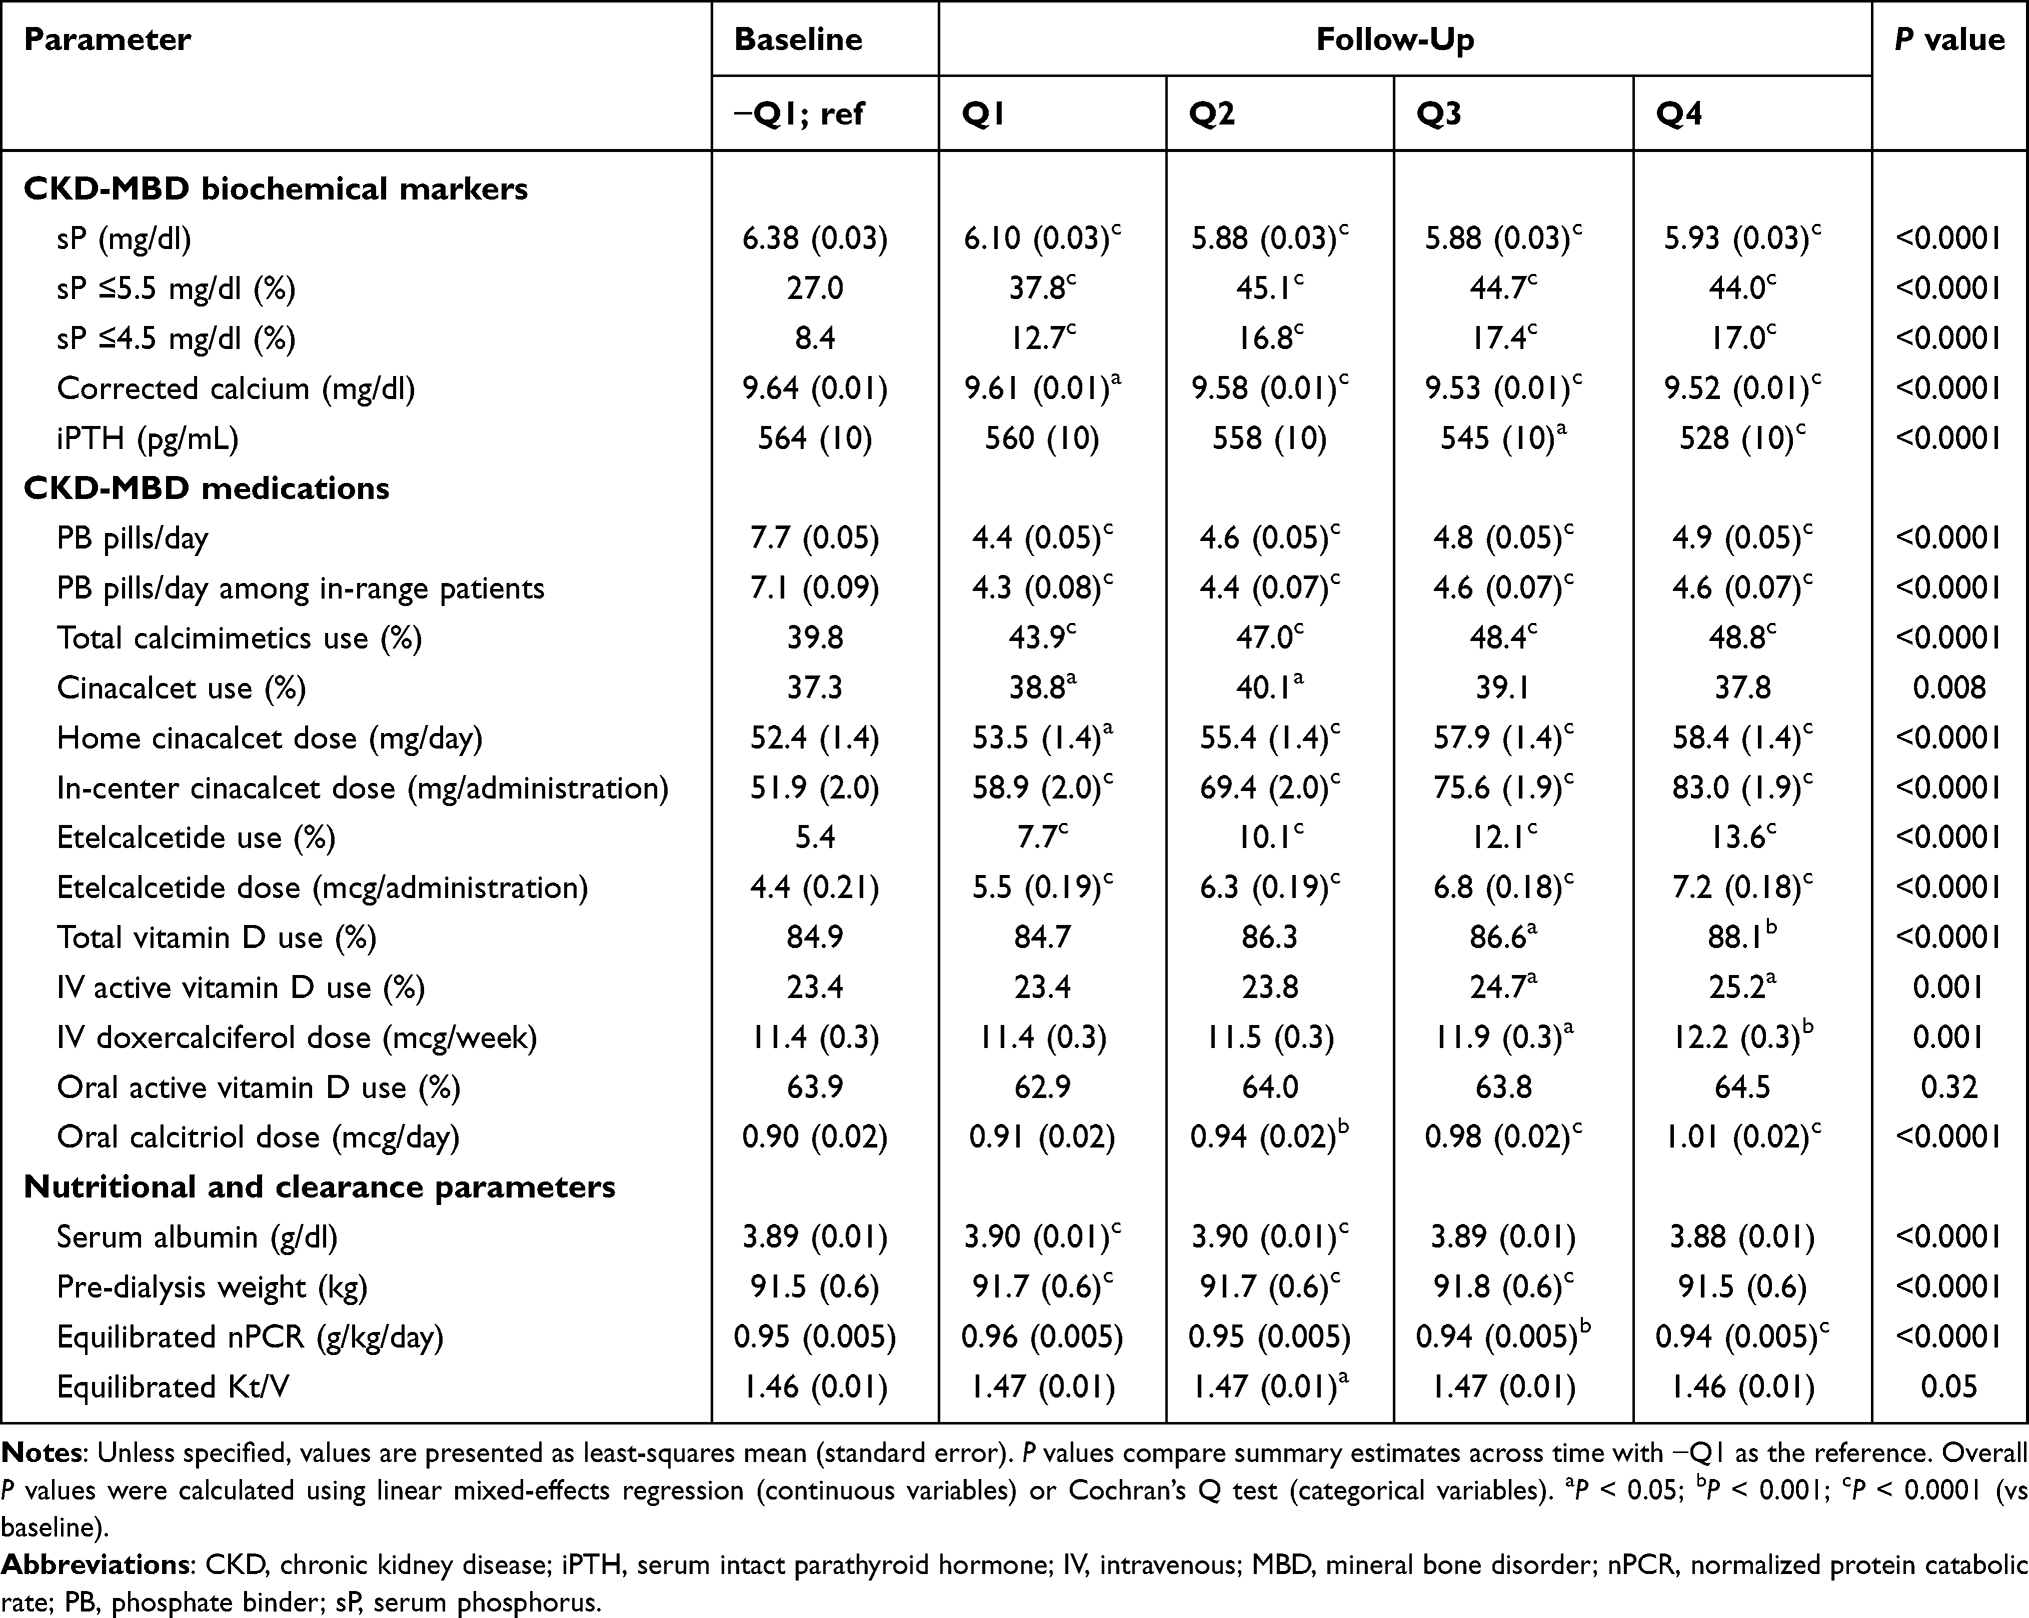 |
Table 2 Comparison of Changes in Clinical Parameters and CKD-MBD Medication Use |
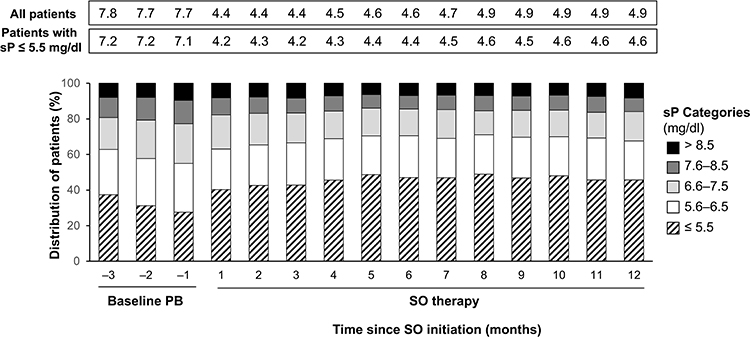 |
Figure 1 Monthly distribution of patients stratified by sP level. Abbreviations: PB, phosphate binder; SO, sucroferric oxyhydroxide; sP, serum phosphorus. |
The mean (SE) baseline PB pill burden of 7.7 (0.05) decreased to 4.4 (0.05) (P < 0.0001) 3 months after switching to SO (ie, Q1). This represents a 43% reduction following the switch to SO monotherapy. Mean (SE) pill burden increased throughout the treatment period to 4.6 (0.05), 4.8 (0.05), and 4.9 (0.05) at Q2, Q3, and Q4, respectively, but remained significantly lower than that reported at baseline (P < 0.0001).
Proportion of Patients Achieving sP ≤5.5 mg/dl and Pill Burden Stratified by Baseline PB
Among the 841 patients who switched from sevelamer to SO, mean sP levels decreased after SO initiation from 6.5 mg/dl at baseline to 6.1, 5.9, 5.9, and 6.0, respectively, across progressive quarters of SO treatment (P < 0.0001 vs baseline) (Figure 2A). These changes were associated with significant increases in the proportion of patients achieving sP ≤5.5 mg/dl, from 21% at baseline to up to 44% at Q2 of SO treatment. In this subgroup, mean PB pill burden was significantly reduced, from 8.4 pills/day at baseline to 4.9 pills/day at Q4 (P < 0.0001).
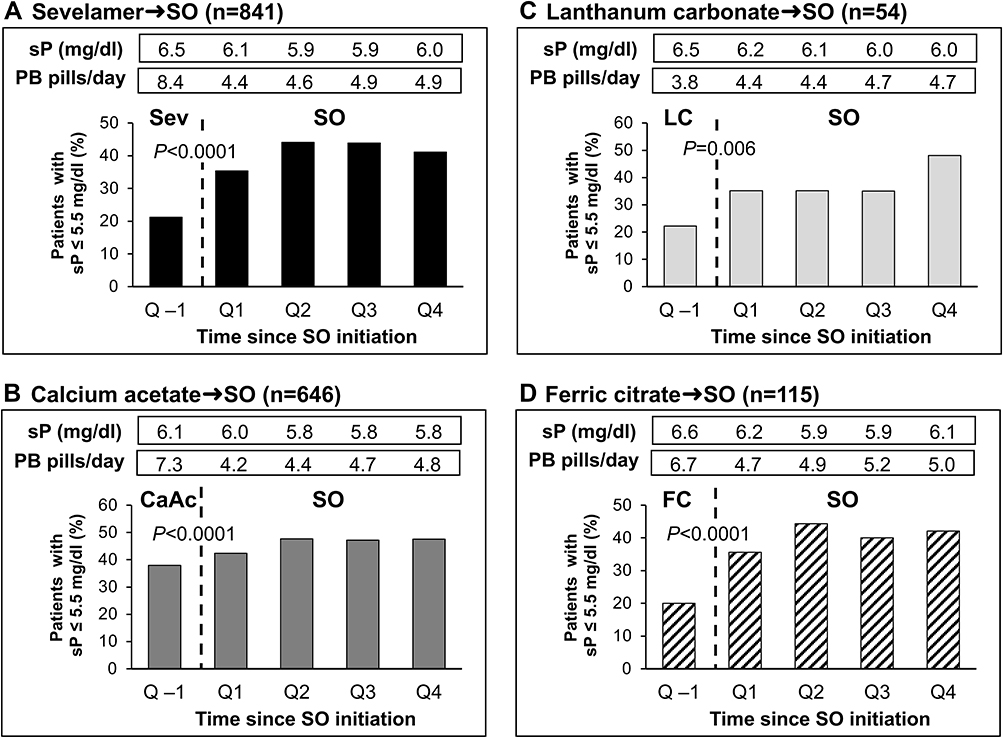 |
Figure 2 Percentage of patients achieving sP ≤5.5 mg/dl stratified by baseline PB type: (A) Sevelamer → SO, (B) Calcium acetate → SO, (C) Lanthanum carbonate → SO, (D) Ferric citrate → SO. Abbreviations: PB, phosphate binder; SO, sucroferric oxyhydroxide; sP, serum phosphorus. |
Similar changes were observed after switching to SO among patients taking other PBs at baseline. Among 646 patients who switched from calcium acetate (Figure 2B), changing to SO was associated with a significant reduction in mean sP from 6.1 mg/dl at baseline to 5.8 mg/dl at Q4 (P < 0.0001). The proportion of patients achieving target sP increased from 37.9% at baseline to 47.5% at Q4 of SO treatment, and the mean daily number of PB pills decreased from 7.3 pills/day to 4.8 pills/day across the same timepoints (P < 0.0001).
Patients switching from lanthanum carbonate to SO (n = 54) experienced a reduction in mean sP from 6.5 mg/dl at baseline to 6.0 mg/dl at Q4 (P = 0.006), with the proportion of patients achieving target sP more than doubling (from 22.2% at baseline to 48.2% at Q4) (Figure 2C). In contrast with patterns observed with other PBs, the mean number of PB pills in this subgroup increased after switching to SO, from a baseline of 3.8 pills/day to 4.7 pills/day at Q4 of SO treatment (P < 0.0001).
After switching from ferric citrate to SO (n = 115) (Figure 2D), mean sP decreased from 6.6 mg/dl at baseline to 6.1 mg/dl at Q4 (P < 0.0001), whereas the proportion of patients achieving target sP more than doubled from 20.0% at baseline to 42.1% at Q4. These changes were accompanied by a significant reduction in mean pill burden (6.7 pills/day vs 5.0 pills/day at Q4; P < 0.0001).
Additional Clinical Parameters
Beyond the above changes in sP and PB pill burden, patients exhibited significant reductions in corrected calcium and iPTH (P < 0.0001 for each) during SO treatment (Table 2). Minimal changes in pre-dialysis weight and equilibrated Kt/V were also observed after switching to SO.
Changes in calcimimetics and/or active vitamin D analogs over the follow-up year are detailed in Table 2. After switching to SO, small but significant increases in the proportion of patients receiving vitamin D (P < 0.0001) were reported. The proportion of patients using calcimimetics increased from 39.8% at baseline to 48.8% (Q4; P < 0.0001) after switching to SO.
Changes in iron indices and anemia therapies are summarized in Table 3. Mean ferritin increased from a baseline of 1009 ng/mL to 1138 ng/mL at Q4 (P < 0.0001). Increases in TSAT and hemoglobin were also observed during the SO treatment period (P < 0.0001). Reductions in the use of IV iron and ESAs were observed during SO treatment. Specifically, use of IV iron sucrose decreased from 77.7% at baseline to 69.4% at Q4 (P < 0.0001), and use of ESAs decreased from 85.6% at baseline to 83.3% at Q4 (P < 0.05).
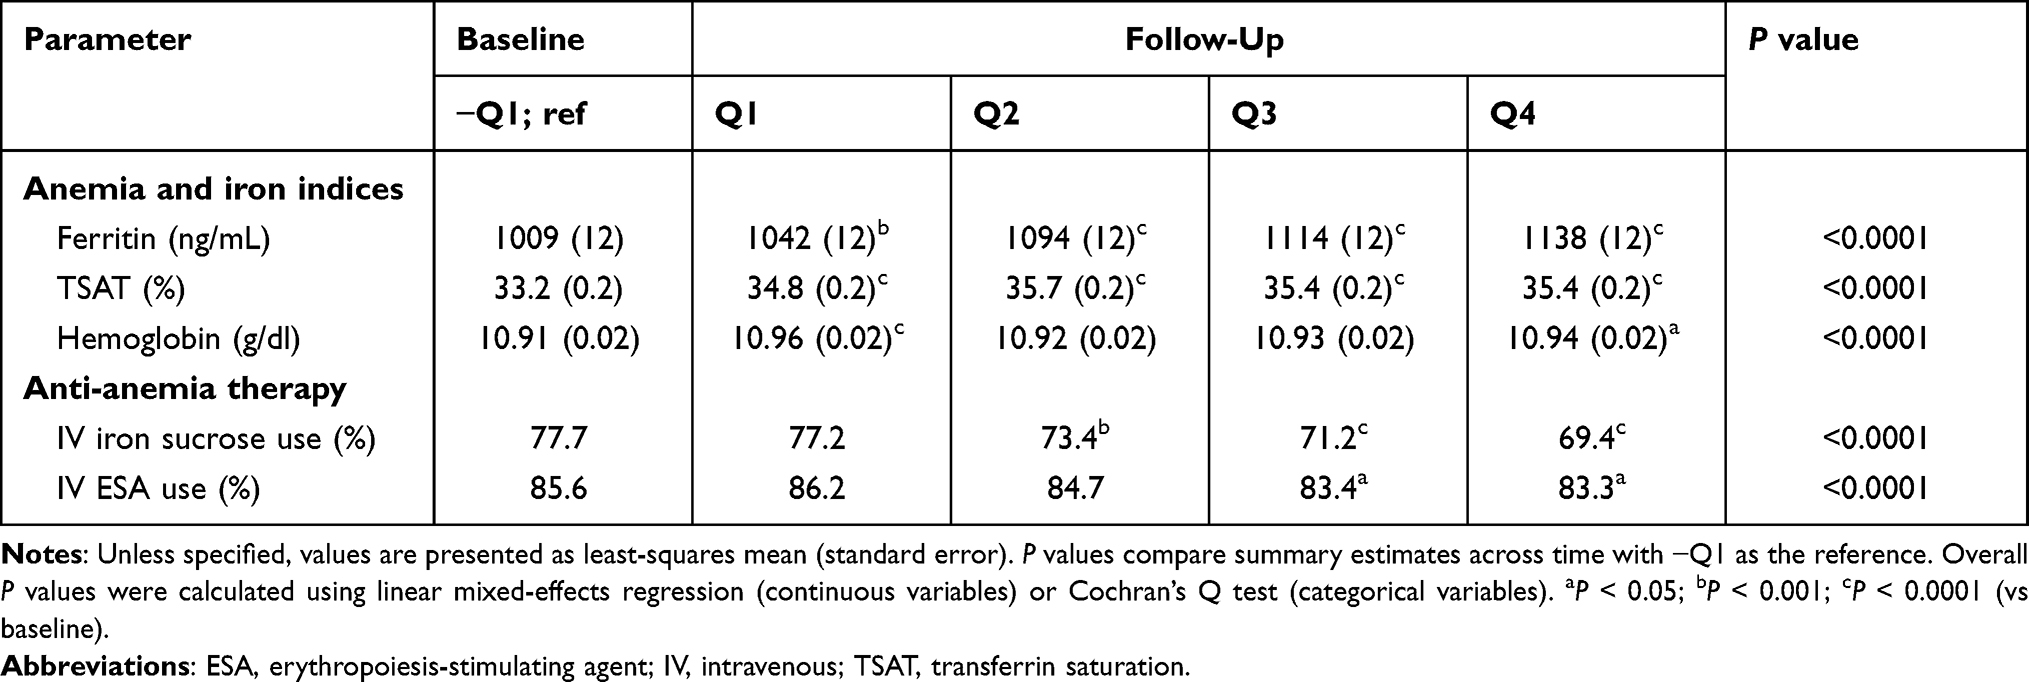 |
Table 3 Comparison of Changes in Anemia and Iron Indices and in Anemia Therapies |
Pill Burden and Phosphorus Control in Predefined Subgroups
The mean pill burden and sP stratified by predefined subgroups are detailed in Table S1. Consistent with findings in the overall cohort, improvement in sP control and PB pill burden was demonstrated in prespecified analyses among subgroups of Black/African American patients, Hispanic/Latino patients, and women. Among Black/African American patients, switching to SO was associated with a 37.5% to 45% reduction in pill burden across quarters (P < 0.0001), with a significant increase in the proportion of patients achieving sP ≤5.5 mg/dl (from 28.4% at baseline to 42.3% at Q4; P < 0.0001). Hispanic/Latino patients experienced a 40% to 46% reduction in mean pill burden after switching to SO (P < 0.0001), accompanied by a 67% relative increase in the proportion of patients achieving sP ≤5.5 mg/dl from baseline to Q4 (P < 0.0001). Similar improvements were observed in women after switching to SO (36% to 43% reduction in pill burden [P < 0.0001], and 60% relative increase in the proportion of patients achieving sP ≤5.5 mg/dl from baseline to Q4 [P < 0.0001]).
Sensitivity Analyses
A total of 4368 HD patients were switched from non-SO PB monotherapy to SO monotherapy during the study period and were included in the sensitivity analysis (Figure S1). Data were available for 4366, 3546, 2828, and 2299 patients for Q1, Q2, Q3, and Q4, respectively. Monotherapy with SO was associated with a significantly greater likelihood of achieving sP ≤5.5 mg/d at for each 3-month period analyzed (Figure S2). Daily PB pill burden was reduced by more than 35% at each quarter.
Discussion
In this retrospective analysis of a contemporary cohort of hemodialysis patients, we found that switching to SO significantly improved sP levels while also reducing pill burden throughout a 1-year follow-up period. These findings are consistent with our observations in a 2014 cohort of hemodialysis patients (Figure 3),14 as well as those of previous studies.12,13,18 In our contemporary cohort, mean sP decreased from a baseline of 6.38 mg/dl to 5.93 mg/dl (P < 0.0001), and the proportion of patients achieving sP ≤5.5 mg/dl increased from 27% to 44% (P < 0.0001) during the year after switching to SO. These changes were accompanied by an approximate 40% reduction in PB pill burden, from 7.7 to 4.4–4.9 pills/day during the follow-up year. SO therapy was associated with improved sP levels regardless of the baseline PB received by patients.
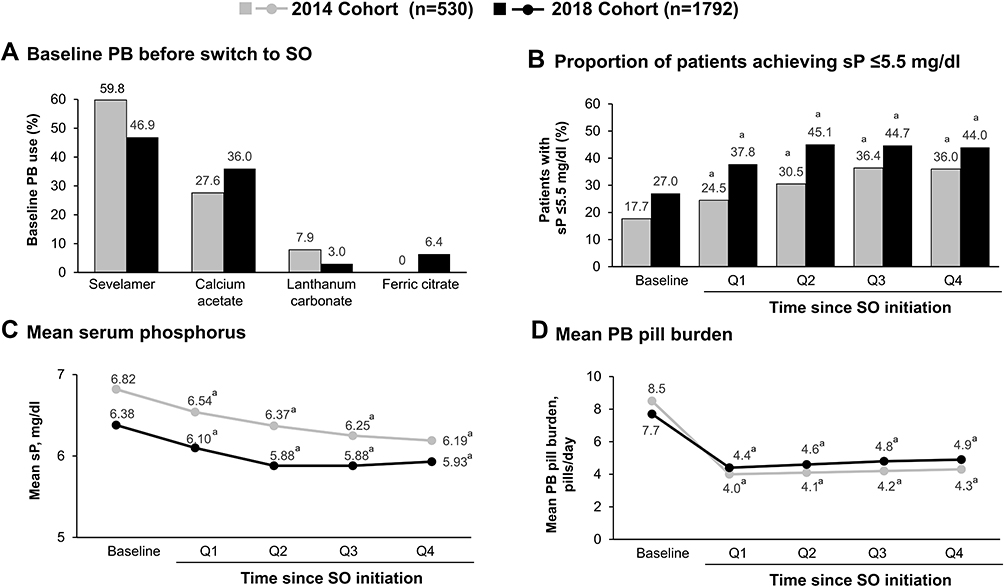 |
Figure 3 Observations in the 2014 and 2018 cohorts: (A) Baseline PB before switch to SO, (B) Proportion of patients achieving sP ≤5.5 mg/dl, (C) Mean serum phosphorus, and (D) Mean PB pill burden. aP < 0.0001 vs baseline. Abbreviations: PB, phosphate binder; SO, sucroferric oxyhydroxide; sP, serum phosphorus. |
Consistent with the overall population, we found that SO improved sP levels while reducing pill burden in prespecified analyses of Black/African American and Hispanic/Latino patients, populations at increased risk of end-stage kidney disease (ESKD) compared with white patients.19,20 In addition to being disproportionately represented in the ESKD population,21 Black/African American patients have a higher burden of ESKD-related complications, including secondary hyperparathyroidism and cardiovascular mortality due to elevated sP.21–24 Our findings in this subgroup of patients are consistent with those of a post hoc analysis of a Phase 3, open-label trial demonstrating that SO achieved sP control in Black/African American patients with comparable efficacy as sevelamer but offered a lower pill burden.24 The effectiveness of SO was also confirmed in a prespecified analysis in women, in whom PB use has been previously found to be an independent predictor of improved survival.25
Given the need for PB regimens to balance phosphate control with convenience, the ability of SO to improve sP while reducing pill burden—nearly by half in our cohorts—has important clinical implications. High pill burden is a well-recognized barrier to adherence in hemodialysis patients,8 a population already burdened with a high daily pill intake that may exceed 20 pills/day.26 A number of studies have shown PB pill burden to correlate inversely with sP control.27,28 A recent Dialysis Outcomes and Practice Patterns Study (DOPPS) analysis of 895 European hemodialysis patients found that self-reported difficulty, inconvenience, and dissatisfaction in taking PB medication were associated with higher odds of having sP ≥6 mg/dl.28 Furthermore, nonadherence, difficulty, inconvenience, or dissatisfaction with PB medication were associated with higher mortality risk. Although the mechanism for this association is unclear, these data reinforce the importance of considering patient satisfaction with their PB regimens.
In addition to demonstrating the effectiveness of SO in a real-world cohort, the present analysis, when contrasted with data from our 2014 cohort, provides insight into evolving trends in contemporary management of hemodialysis patients. Compared with the 2014 cohort of hemodialysis patients switched to SO (n = 530), the present cohort was older (57 vs 55 years of age, respectively) and had been on maintenance dialysis for less time (34 vs 45 months).14 We also observed changes in baseline PB use (Figure 3A). Ferric citrate, approved in late 2014 for the control of sP levels in dialysis populations, was being used by more than 6% of the cohort prior to initiation of SO. The relative proportion of patients switching from sevelamer and lanthanum carbonate to SO was reduced in the present cohort, while switching from calcium acetate increased slightly. It is particularly notable that 37.9% of patients switching from calcium acetate in the present analysis had in-range sP compared with 18.5% in the 2014 cohort. These changes may reflect adherence to the updated 2017 KDIGO recommendation to restrict the dose of calcium-based phosphate binders17 due to concerns that high doses of calcium-based binders may contribute to hypercalcemia, vascular calcification, and cardiovascular disease.10,11 Switching patients from calcium acetate to SO may have occurred due to concerns of patients’ calcium intake. Although our findings are consistent with previously reported reductions in calcium-based PB use,29 current data from DOPPS indicate that more than 40% of US patients receiving PBs are prescribed calcium acetate.30
Patients in the present cohort had lower mean sP on their baseline (ie, non-SO) PB than those in the 2014 cohort (6.38 mg/dl vs 6.82 mg/dl) (Figure 3C) and were more likely to have sP ≤5.5 mg/dl (27.0% vs 17.7%) (Figure 3B) and ≤4.5 mg/dl (8.4% vs 4.7%).14 Further, this level of control was achieved with a lower baseline pill burden compared with the 2014 cohort (mean, 7.7 vs 8.5 pills/day). After switching to SO, patients in the contemporary cohort had better sP control (37.8–45.1% patients with sP ≤5.5 mg/dL vs 24.5–36.4%). Improved sP control appears to be the result of higher doses of SO in the contemporary cohort (4.4–4.9 vs 4.0–4.3 pills/day in 2014). These data are consistent with previous reports of dose-dependent improvements in sP levels with SO dose of up to 3000 mg (6 tablets/day)31 and suggest an increased comfort of prescribers to up-titrate the dose of SO.
Several differences in MBD medications and markers were observed between the historical (ie, 2014) and contemporary (ie, 2018) cohorts.14 Compared with the historical cohort, a greater proportion of patients in the contemporary cohort were receiving oral active vitamin D (63.9% vs 15.7%, respectively) at baseline, whereas the use of IV vitamin D was considerably lower (23.4% vs 74.2%). These changes likely reflect the updated KDIGO guidelines for the management of CKD-MBD published in 2017.17 Using data from 2014, we documented significant decreases in corrected serum calcium levels and numerical increases in iPTH following the switch to SO.14 These changes were accompanied by an increase in oral calcitriol use and concurrent decrease in IV doxercalciferol use. In contrast, in the present analysis we document a significant reduction in iPTH during SO treatment. This was accompanied by significant reductions in corrected calcium levels.
Although small reductions in serum albumin and nPCR were observed during SO treatment, these parameters should be considered in relation to sP (which decreased with SO).32 As such, these results suggest that initiating SO did not impair nutritional status. Although the effect of SO on protein handling has not been evaluated, patients taking SO may be able to increase their dietary intake due to the lower pill burden and consequent impact on appetite relative to regimens with higher pill burdens.33,34
This analysis provides important insight into the impact of SO therapy on sP control, pill burden, MBD, and nutritional parameters in a contemporary large population of hemodialysis patients. Given the broad range of patients and varying baseline sP levels in our cohort, we believe our results to be generalizable to real-world hemodialysis patients encountered in clinical practice. Further, comparing our findings to those observed in the 2014 cohort provides useful information regarding trends in the management of the hemodialysis population. However, our findings should be interpreted in light of the study design, which was retrospective in nature and lacked a comparator group followed over the same study period. Other limitations include the potential for missing information in the clinical records used for data extraction and the use of prescription data for assessing pill burden. These data cannot assess adherence or exclude the possibility that patients obtained their medication through pharmacy services other than those we reviewed. Further, we cannot determine whether observed changes in outcomes such as calcimimetic use and serum ferritin are attributable to SO use or the result of increased time on dialysis (ie, dialysis vintage), as previously reported by others.35,36 Additionally, we did not capture all potentially relevant information, including the clinical rationale for switching to SO, data regarding safety and tolerability of SO, or nutritional information (eg, dietary phosphorus intake, use of protein supplements).
Conclusion
In conclusion, results from this contemporary cohort of hemodialysis patients support the benefits of SO monotherapy in reducing sP levels while reducing pill burden. Increasing clinical experience with SO appears to have contributed to further dose titration and improved sP control than previously reported. Considering increased concerns about higher doses of calcium-based PBs, SO represents an effective option for hemodialysis patients requiring phosphate-lowering therapy.
Acknowledgments
Medical writing and editing support were provided by NorthStar Strategic Consulting, LLC, via funding by Fresenius Medical Care Renal Therapies Group, LLC.
Disclosure
JBK has participated in advisory boards for Fresenius Medical Care Renal Therapies Group, LLC. MZ, LHF, VP, CM, and MSA are employees of Fresenius Medical Care. CM owns stock in Fresenius Medical Care AG & Co. KGaA. DWC is a consultant for Fresenius Medical Care Renal Therapies Group, LLC, and a consultant for Akebia, GSK, AstraZeneca, FibroGen, Otsuka, and MediBeacon. The authors report no other conflicts of interest in this work.
References
1. Tonelli M, Pannu N, Manns B. Oral phosphate binders in patients with kidney failure. N Engl J Med. 2010;362(14):1312–1324. doi:10.1056/NEJMra0912522
2. Block GA, Klassen PS, Lazarus JM, Ofsthun N, Lowrie EG, Chertow GM. Mineral metabolism, mortality, and morbidity in maintenance hemodialysis. J Am Soc Nephrol. 2004;15(8):2208–2218. doi:10.1097/01.ASN.0000133041.27682.A2
3. Sprague SM, Marcuccilli M, Rakov V. Clinical rationale of sucroferric oxyhydroxide for controlling hyperphosphatemia in patients with chronic kidney disease. Clin Investig (Lond). 2015;5(1):9–21. doi:10.4155/CLI.14.110
4. Cupisti A, Gallieni M, Rizzo MA, Caria S, Meola M, Bolasco P. Phosphate control in dialysis. Int J Nephrol Renovasc Dis. 2013;6:193–205. doi:10.2147/IJNRD.S35632
5. Ketteler M, Wüthrich RP, Floege J. Management of hyperphosphataemia in chronic kidney disease—challenges and solutions. Clin Kidney J. 2013;6(2):128–136. doi:10.1093/ckj/sfs173
6. National Kidney Foundation. K/DOQI clinical practice guidelines for bone metabolism and disease in chronic kidney disease. Am J Kidney Dis. 2003;42(4 suppl 3):S1–S201.
7. Greig SL, Plosker GL. Sucroferric oxyhydroxide: a review in hyperphosphataemia in chronic kidney disease patients undergoing dialysis. Drugs. 2015;75(5):533–542. doi:10.1007/s40265-015-0366-1
8. Fissell RB, Karaboyas A, Bieber BA, et al. Phosphate binder pill burden, patient-reported non-adherence, and mineral bone disorder markers: findings from the DOPPS. Hemodial Int. 2016;20(1):38–49. doi:10.1111/hdi.12315
9. Floege J, Covic AC, Ketteler M, et al. One-year efficacy and safety of the iron-based phosphate binder sucroferric oxyhydroxide in patients on peritoneal dialysis. Nephrol Dial Transplant. 2017;32(11):1918–1926. doi:10.1093/ndt/gfw460
10. Emmett M. A comparison of clinically useful phosphorus binders for patients with chronic kidney failure. Kidney Int Suppl. 2004;66(90):S25–S32. doi:10.1111/j.1523-1755.2004.09005.x
11. Moe SM, Chertow GM. The case against calcium-based phosphate binders. Clin J Am Soc Nephrol. 2006;1(4):697–703. doi:10.2215/CJN.00560206
12. Floege J, Covic AC, Ketteler M, et al. PA21 Study Group. A Phase III study of the efficacy and safety of a novel iron-based phosphate binder in dialysis patients. Kidney Int. 2014;86(3):638–647. doi:10.1038/ki.2014.58
13. Coyne DW, Ficociello LH, Parameswaran V, et al. Real-world effectiveness of sucroferric oxyhydroxide in patients on chronic hemodialysis: a retrospective analysis of pharmacy data. Clin Nephrol. 2017;88(8):59–67. doi:10.5414/CN109021
14. Kendrick J, Parameswaran V, Ficociello LH, et al. One-year historical cohort study of the phosphate binder sucroferric oxyhydroxide in patients on maintenance hemodialysis. J Ren Nutr. 2019;29(5):428–437. doi:10.1053/j.jrn.2018.11.002
15. Clase CM, Norman GL, Beecroft ML, Churchill DN. Albumin-corrected calcium and ionized calcium in stable haemodialysis patients. Nephrol Dial Transplant. 2000;15(11):1841–1846. doi:10.1093/ndt/15.11.1841
16. Kidney Disease: Improving Global Outcomes (KDIGO) CKD–MBD Work Group. KDIGO clinical practice guideline for the diagnosis, evaluation, prevention, and treatment of chronic kidney disease–mineral and bone disorder (CKD–MBD). Kidney Int. 2009;76(suppl113):S1–S130.
17. Kidney Disease: Improving Global Outcomes (KDIGO) CKD-MBD Update Work Group. KDIGO 2017 clinical practice guideline update for the diagnosis, evaluation, prevention, and treatment of chronic kidney disease–mineral and bone disorder (CKD-MBD). Kidney Int Suppl. 2017;7(1):1–59. doi:10.1016/j.kisu.2017.04.001.
18. Floege J, Covic AC, Ketteler M, et al.; Sucroferric Oxyhydroxide Study Group. Long-term effects of the iron-based phosphate binder, sucroferric oxyhydroxide, in dialysis patients. Nephrol Dial Transplant. 2015;30(6):1037–1046. doi:10.1093/ndt/gfv006
19. Bock F, Stewart TG, Robinson-Cohen C, et al. Racial disparities in end-stage renal disease in a high-risk population: the Southern Community Cohort Study. BMC Nephrol. 2019;20(1):308. doi:10.1186/s12882-019-1502-z
20. Norris KC, Williams SF, Rhee CM, et al. Hemodialysis disparities in African Americans: the deeply integrated concept of race in the social fabric of our society. Semin Dial. 2017;30(3):213–223. doi:10.1111/sdi.12589
21. Norton JM, Moxey-Mims MM, Eggers PW, et al. Social determinants of racial disparities in CKD. J Am Soc Nephrol. 2016;27(9):2576–2595. doi:10.1681/ASN.2016010027
22. Newsome BB, Kilpatrick RD, Liu J, et al. Racial differences in clinical use of cinacalcet in a large population of hemodialysis patients. Am J Nephrol. 2013;38(2):104–114. doi:10.1159/000353298
23. Scialla JJ, Parekh RS, Eustace JA, et al. Race, mineral homeostasis and mortality in patients with end-stage renal disease on dialysis. Am J Nephrol. 2015;42(1):25–34. doi:10.1159/000438999
24. Sprague SM, Ketteler M, Covic AC, et al. Long-term efficacy and safety of sucroferric oxyhydroxide in African American dialysis patients. Hemodial Int. 2018;22(4):480–491. doi:10.1111/hdi.12663
25. Hecking M, Bieber BA, Ethier J, et al. Sex-specific differences in hemodialysis prevalence and practices and the male-to-female mortality rate: the Dialysis Outcomes and Practice Patterns Study (DOPPS). PLoS Med. 2014;11(10):e1001750. doi:10.1371/journal.pmed.1001750
26. Cozzolino M, Galassi A, Ciceri P. Phosphate binders in dialysis: better satisfied than sorry. Clin Kidney J. 2021;14(8):1859–1860. doi:10.1093/ckj/sfab093
27. Wang S, Alfieri T, Ramakrishnan K, Braunhofer P, Newsome BA. Serum phosphorus levels and pill burden are inversely associated with adherence in patients on hemodialysis. Nephrol Dial Transplant. 2014;29(11):2092–2099. doi:10.1093/ndt/gft280
28. McCullough K, Port FK, de Sequera P, et al.; DOPPS Country Investigators. European hemodialysis patient satisfaction with phosphate binders is associated with serum phosphorus levels: the dialysis outcomes and practice patterns study. Clin Kidney J. 2021;14(8):1886–1893. doi:10.1093/ckj/sfab098
29. St Peter WL, Wazny LD, Weinhandl ED. Phosphate-binder use in US dialysis patients: prevalence, costs, evidence, and policies. Am J Kidney Dis. 2018;71:2. 246–253. doi:10.1053/j.ajkd.2017.09.007
30. US-DOPPS (Dialysis Outcomes and Practice Patterns Study) Practice Monitor. Phosphate binder use, last 3 months; 2020. Available from: https://www.dopps.org/DPM-HD/DPMSlideBrowser.aspx.
31. Koiwa F, Terao A. Dose-response efficacy and safety of PA21 in Japanese hemodialysis patients with hyperphosphatemia: a randomized, placebo-controlled, double-blind, Phase II study. Clin Exp Nephrol. 2017;21(3):513–522. doi:10.1007/s10157-016-1299-z
32. Kalantar-Zadeh K, Parameswaran V, Ficociello LH, et al. Real-world scenario improvements in serum phosphorus levels and pill burden in peritoneal dialysis patients treated with sucroferric oxyhydroxide. Am J Nephrol. 2018;47(3):153–161. doi:10.1159/000487856
33. Fouque D, Horne R, Cozzolino M, Kalantar-Zadeh K. Balancing nutrition and serum phosphorus in maintenance dialysis. Am J Kidney Dis. 2014;64(1):143–150. doi:10.1053/j.ajkd.2014.01.429
34. Kalantar-Zadeh K, Ficociello LH, Parameswaran V, et al. Changes in serum albumin and other nutritional markers when using sucroferric oxyhydroxide as phosphate binder among hemodialysis patients: a historical cohort study. BMC Nephrol. 2019;20(1):396. doi:10.1186/s12882-019-1582-9
35. Fuller DS, Xing S, Belozeroff V, et al. Variability in cinacalcet prescription across US hemodialysis facilities. Clin J Am Soc Nephrol. 2019;14(2):241–249. doi:10.2215/CJN.09550818
36. Karaboyas A, Zee J, Morgenstern H, et al. Understanding the recent increase in ferritin levels in United States dialysis patients: potential impact of changes in intravenous iron and erythropoiesis-stimulating agent dosing. Clin J Am Soc Nephtrol. 2015;10(10):1814–1821. doi:10.2215/CJN.02600315
 © 2022 The Author(s). This work is published and licensed by Dove Medical Press Limited. The full terms of this license are available at https://www.dovepress.com/terms.php and incorporate the Creative Commons Attribution - Non Commercial (unported, v3.0) License.
By accessing the work you hereby accept the Terms. Non-commercial uses of the work are permitted without any further permission from Dove Medical Press Limited, provided the work is properly attributed. For permission for commercial use of this work, please see paragraphs 4.2 and 5 of our Terms.
© 2022 The Author(s). This work is published and licensed by Dove Medical Press Limited. The full terms of this license are available at https://www.dovepress.com/terms.php and incorporate the Creative Commons Attribution - Non Commercial (unported, v3.0) License.
By accessing the work you hereby accept the Terms. Non-commercial uses of the work are permitted without any further permission from Dove Medical Press Limited, provided the work is properly attributed. For permission for commercial use of this work, please see paragraphs 4.2 and 5 of our Terms.