")
Back to Journals » Cancer Management and Research » Volume 11
Serum pepsinogen assay is not recommended for the diagnosis of esophageal squamous cell carcinoma: a systematic review and meta-analysis
Authors Liu XB, Gao ZY, Zhang QH, Jin S, Gao B, Yang GL, Li SB
Received 2 December 2018
Accepted for publication 16 May 2019
Published 27 June 2019 Volume 2019:11 Pages 5643—5654
DOI https://doi.org/10.2147/CMAR.S196760
Checked for plagiarism Yes
Review by Single anonymous peer review
Peer reviewer comments 2
Editor who approved publication: Dr Antonella D'Anneo
Xiao-Bo Liu,1* Zi-Ye Gao,2* Qing-Hui Zhang,1* Shu Jin,1 Bo Gao,3 Gong-Li Yang,4 Sheng-Bao Li1
1Department of Gastroenterology, Taihe Hospital, Hubei University of Medicine, Shiyan, Hubei 442000, People’s Republic of China; 2Department of Oncology, Taihe Hospital, Hubei University of Medicine, Shiyan, Hubei 442000, People’s Republic of China; 3Department of Laboratory Medicine, Taihe Hospital, Hubei University of Medicine, Shiyan, Hubei 442000, People’s Republic of China; 4Department of Gastroenterology, Shenzhen University General Hospital, Shenzhen, Guangdong 518000, People’s Republic of China
*These authors contributed equally to this work
Background: Serum pepsinogen I (PGI) concentration and PGI/PGII ratio (PGR) are often used as serological markers for gastric fundus atrophy (AGA) and gastric carcinoma. However, their diagnostic value in esophageal carcinoma (EC) is inaccurate.
Methods: This study evaluated the diagnostic value of PGI and PGR in EC by searching the PubMed, Web of Science, Embase, Cochrane Library and Cochrane Central Register of Controlled Trials databases for literature on the diagnosis of EC with PGI and PGR from January 1, 2000 to October 2, 2018. The included literature were systematically evaluated using QUSDAS-2 software. Meta-analysis was conducted using STATA 15.0 software. The summary receiver operating characteristic curve (SROC) accuracy was plotted, the area under the curve was calculated.
Results: A total of 84 papers were selected, and after screening, nine papers on esophageal squamous cell carcinoma (ESCC) were finally included. Results showed low an ESCC-specific diagnostic sensitivity (0.27), high specificity (0.85), and 0.63 AUC of SROC when PGI≤70 ng/mL. When PGR≤3, the ESCC-specific diagnostic sensitivity was low (0.29), the specificity was high (0.83), and the AUC of SROC was 0.63.
Conclusion: According to the current research results, PGI≤70 ng/mL or PGR≤3 diagnostic ESCC sensitivity is low, and specificity is high. These findings indicate that neither PGI≤70 ng/mL nor PGR≤3 can be used as an ESCC-screening index.
Keywords: esophageal squamous cell carcinoma, PGI, PGR, diagnosis, meta-analysis
Introduction
Esophageal carcinoma (EC) is the seventh most common cancer worldwide, and its mortality ranks sixth.1 EC includes two main types: esophageal adenocarcinoma (EAC) and esophageal squamous cell carcinoma (ESCC).2 EC is dominated by EA in Western countries, whereas ESCC is predominant in Eastern countries.3 China is a high-incidence country for EC, mainly ESCC. Moreover, the incidence rate of ESCC in China mainland ranks fifth in carcinomas, and its mortality rate ranks fourth.4
The knowledge of EC pathogenesis remains incomplete. Most patients are diagnosed in the middle or advanced stages, and the 5-year survival is approximately 20%.5 Early diagnosis and treatment are key factors for EC prognosis. Therefore, finding an economical and noninvasive method for screening high-risk populations for EC and for monitoring patients with esophageal squamous dysplasia (ESD) is extremely urgent. The diagnostic rate of EC via endoscopy is gradually increasing, but the diagnostic approach is invasive and expensive. Moreover, certain patients fail in successful compliance, and operator skills vary. In China, the current diagnosis rate of early EC is low, and EC-specific markers are lacking. Furthermore, our previous study found that serum IL-6 and IL-8 may be an effective indicator for the early diagnosis of ESCC, but the clinical application needs further investigation.6
Serum pepsinogen (PG) mainly includes two types: pepsinogen I (PGI) and pepsinogen Ⅱ (PGⅡ).7 PG is mainly produced by the stomach and basal cells in the gastric fundus and cervical mucus cells.8 The gastric mucosa atrophy leads to a decrease in PGI, but PGⅡ shows no change nor increase, further leading to a decrease in PGI/PGII ratio (PGR). Therefore, PGI and PGR are serologically used as markers of gastric fundus atrophy (AGA), in a process “serological biopsy”.9,10 The present study aimed to evaluate the EC-specific diagnostic sensitivity and specificity of PGI and PGR via meta-analysis and to comprehensively assess their application values in EC diagnosis.
Materials and methods
Literature search strategy
The Preferred Reporting Items for Systematic reviews and Meta-Analyses statement was followed to conduct this systematic review (Table S1).11 We searched for research literature on PGI and PGR diagnostic EC in PubMed, Web of Science, Embase, Cochrane Library, and Cochrane Central Register of Controlled Trials databases. The retrieval time covered January 1, 2000 to October 2, 2018, and we used the search terms:(“PGI” or “PGⅡ” or “PGI/Ⅱ” or “PGR” or“PG”,or “pepsinogen”), and (“esophageal carcinoma” or “esophageal cancer” or “esophageal tumor” or “esophageal squamous dysplasia” or “esophageal plasma”) and (“diagnosis” or “sensitivity” or “specificity”). Search strategy is shown in Table S2. Reference lists of all selected articles were retrieved manually to identify any additional published studies. In the case of repeat reports from the same study, the one with the larger population or extended follow-up was selected. Only published clinical studies were included.
Inclusion and exclusion criteria
Inclusion criteria: (1) Patients with EC were diagnosed based on pathology. (2) The control group included adults without any history of malignant tumors, and patients with benign gastrointestinal diseases were included. (3) Peripheral blood samples were collected before patients received treatment. (4) Moreover, inclusion studies must have been followed up for more than 6 months after biomarker assessment to rule out the delayed diagnosis of malignancy. (5) The diagnostic performance evaluation indexes included sensitivity and specificity. Additionally, patient data included in the study were comprehensive and included original information. The data of true positive (TP) number, true negative (TN) number, false positive (FP) number, false negative (FN) number, or sensitivity and specificity were obtained directly or indirectly. (6) Lastly, the study should only be conducted once, and the sample size of each study should be more than 10.
Exclusion criteria: (1) Only those with esophageal and gastric junction cancer, high-grade intraepithelial neoplasia of esophagus or no difference between appeal and esophageal cancer were excluded. (2) We were unable to obtain complete data and cannot construct a diagnostic analysis in a 2×2 form. (3) Review, editorial non-experimental research literature such as case reports and conference abstracts. (4) Research specimens are basic research such as pathological tissues and animal experiments. (5) Repeated publication studies.
Data extraction
According to the above criteria, two researchers (Liu and Zhang) independently screened the literature and obtained data. In case of disagreements, a third researcher was consulted to intervene in the discussion to reach a final conclusion. The main information to be extracted in relevant literature included the following: author, year, pathological type, biomarker type and boundary point, number of cases and controls, specificity, sensitivity, negative likelihood ratio (NLR), positive likelihood ratio (PLR), relative-risk ratio and 95% confidence interval (95% CI). We converted the extracted data into a four-table data, that is, TP, FP, TN, and FN.
Data extraction and quality assessment
This study was conducted using QUADA-2 developed on the basis of (quality assessment of diagnostic accuracy studies, QUADAS).12 Risk assessment criteria were used to evaluate the quality of the literature and included four elements: case selection, trials to be evaluated, gold criteria, case flow, and progress.13 The results were divided into three types: “Yes”, “No”, and “Unknown”. When “Yes”≥7, the literature quality is good, and vice versa.
Statistical analysis
Meta-analysis was performed using STATA software (Stata Corporation, version 15.0, College Station, TX, USA). First, the between-study threshold effect was analyzed. The Spearman correlation coefficients for the logarithms of sensitivity and of (1-specificity) were calculated. If P<0.05, a threshold effect existed. Heterogeneity test was performed using Cochran’s Q test with a test value of I2. If P>0.05 or I2<50% indicated the absence of heterogeneity, and the fixed effect model was used. Otherwise, the random effects model was employed.14 The summary receiver operating characteristic curve (SROC) was plotted, and the area under the curve (AUC) and Q indexes were calculated. AUC is another indicator of the overall accuracy of diagnostic tests. The AUC value ranges from 0 to 1, wherein a value close to 1, means good diagnostic effect;meanwhile, diagnostic odds ratio (DOR) ranges from 0 to ∞, wherein large value, means good diagnostic accuracy.15 When DOR=1, diagnostic tests present difficulty in distinguishing patients from the healthy population. The present study adopted these commonly used criteria for screening gastric cancer in Japan as a cut-in point, that is, PGI≤70 ng/mL, PGR≤3 or PGI≤70 ng/mL and PGR≤3 allow merging of the effect amount without any heterogeneity.16 If no heterogeneity was observed, the effect amount was combined. Publication bias was assessed by Egger’s regression. Differences and analytical parameters were considered as statistically significant when P<0.05.
Results
Search results and characteristics of the included study
Finally, ten articles were included in the study.6–14 Figure 1 shows the literature screening process. Table 1 list the basic features of the literature, including nine articles on ESCC. The sources of funds for each study has been listed in Table S3. Three articles mentioned EAC, including two studies according to the PGR≤3 standard.17,18 At least four articles were used with the Midas instruction and were thus excluded in the study. Two reports stated that reduced PGR is associated with a high risk of ESD;19,20 however, its data were incomprehensible, and thus the study was excluded in this work.
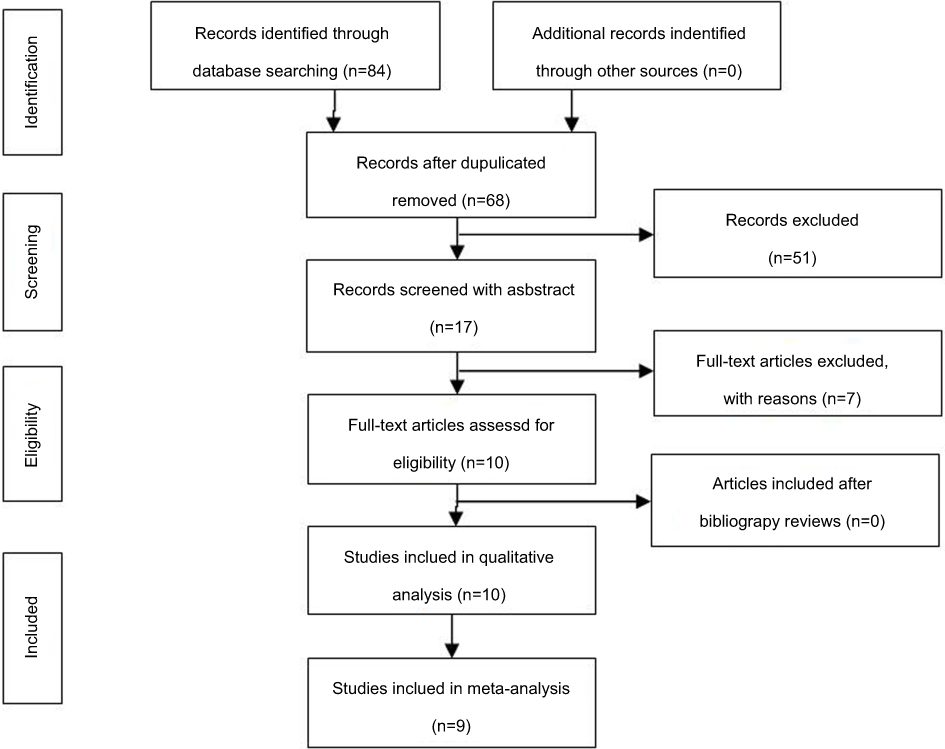 |
Figure 1 Flow diagram of study search and selection. |
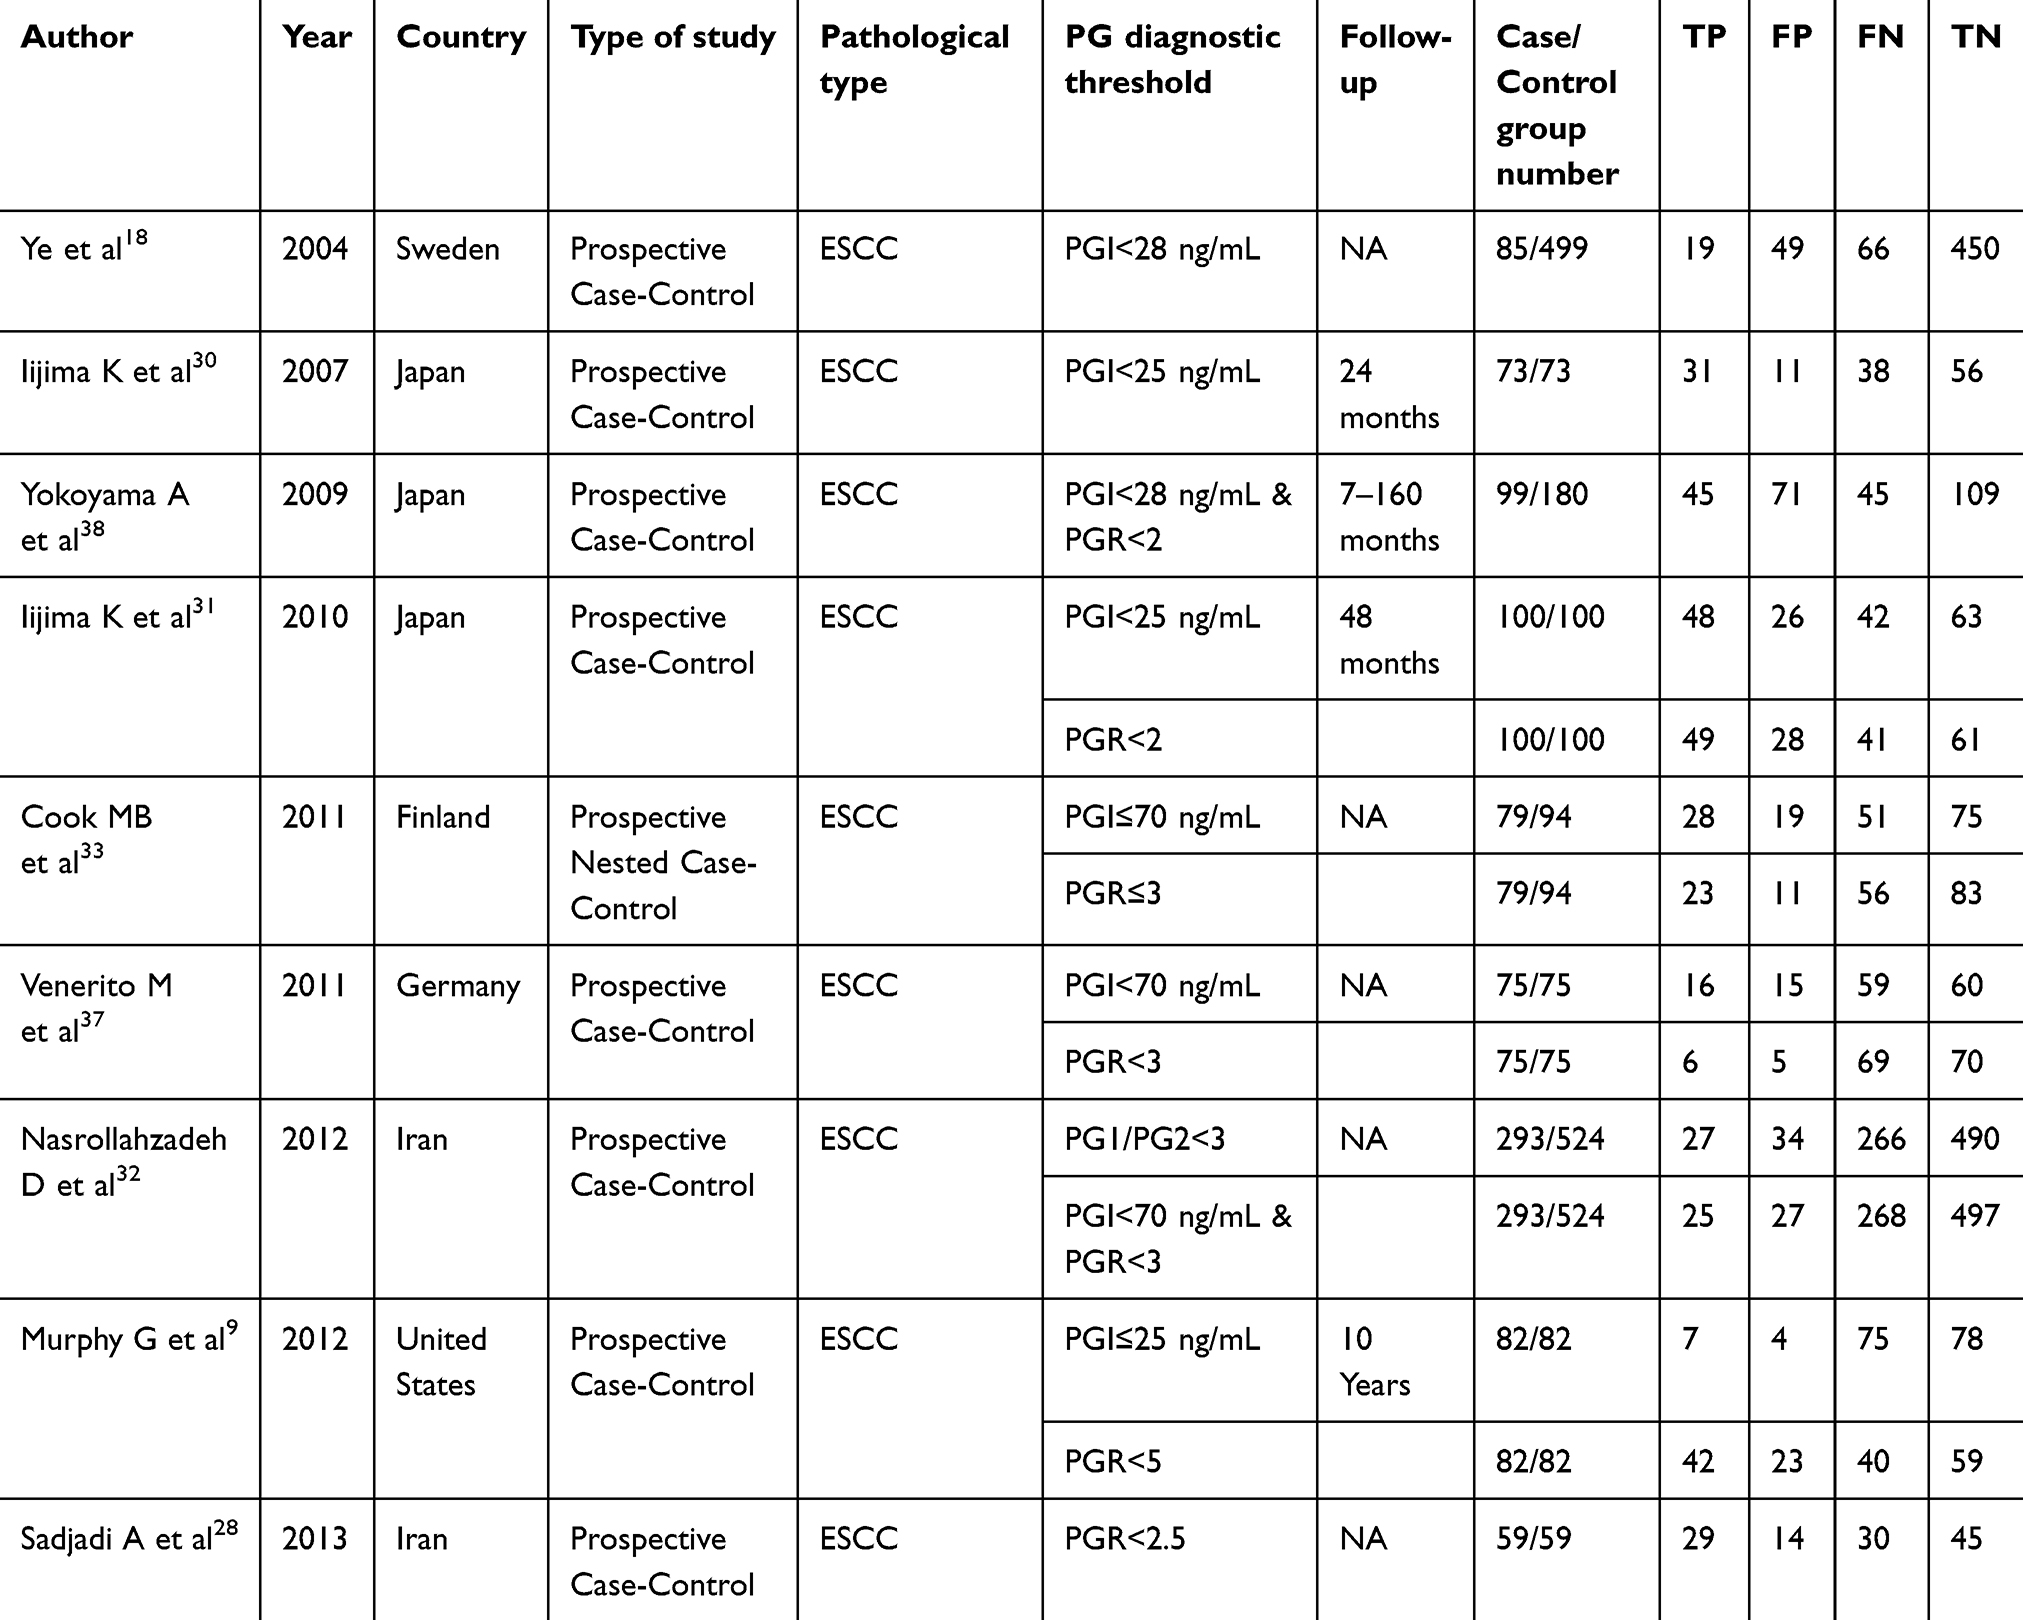 |
Table 1 Basic characteristics of the included literature |
The quality of QUADAS-2 scale was evaluated for inclusion in the literature (Table 2), and a data extraction form (Figure 2) was developed for risk bias evaluation (Figure 3). Prospective studies showed low patient-selection bias, whereas retrospective studies displayed a high bias. Regarding the “evaluation test”, that is, the bias assessment by using PGI and PGR, six articles presented a low risk and three were unclear. In the “case flow and progress” offset risk assessment, seven articles were at low risk, and two performances were unclear. We indicated that literature inclusion features a low risk of bias in case selection. Moreover, a relatively low risk in the “tests to be evaluated, gold standards, case processes, and progress” was detected and showed a low risk in terms of “clinical adaptability.” In summary, the quality of included literature is considered high.
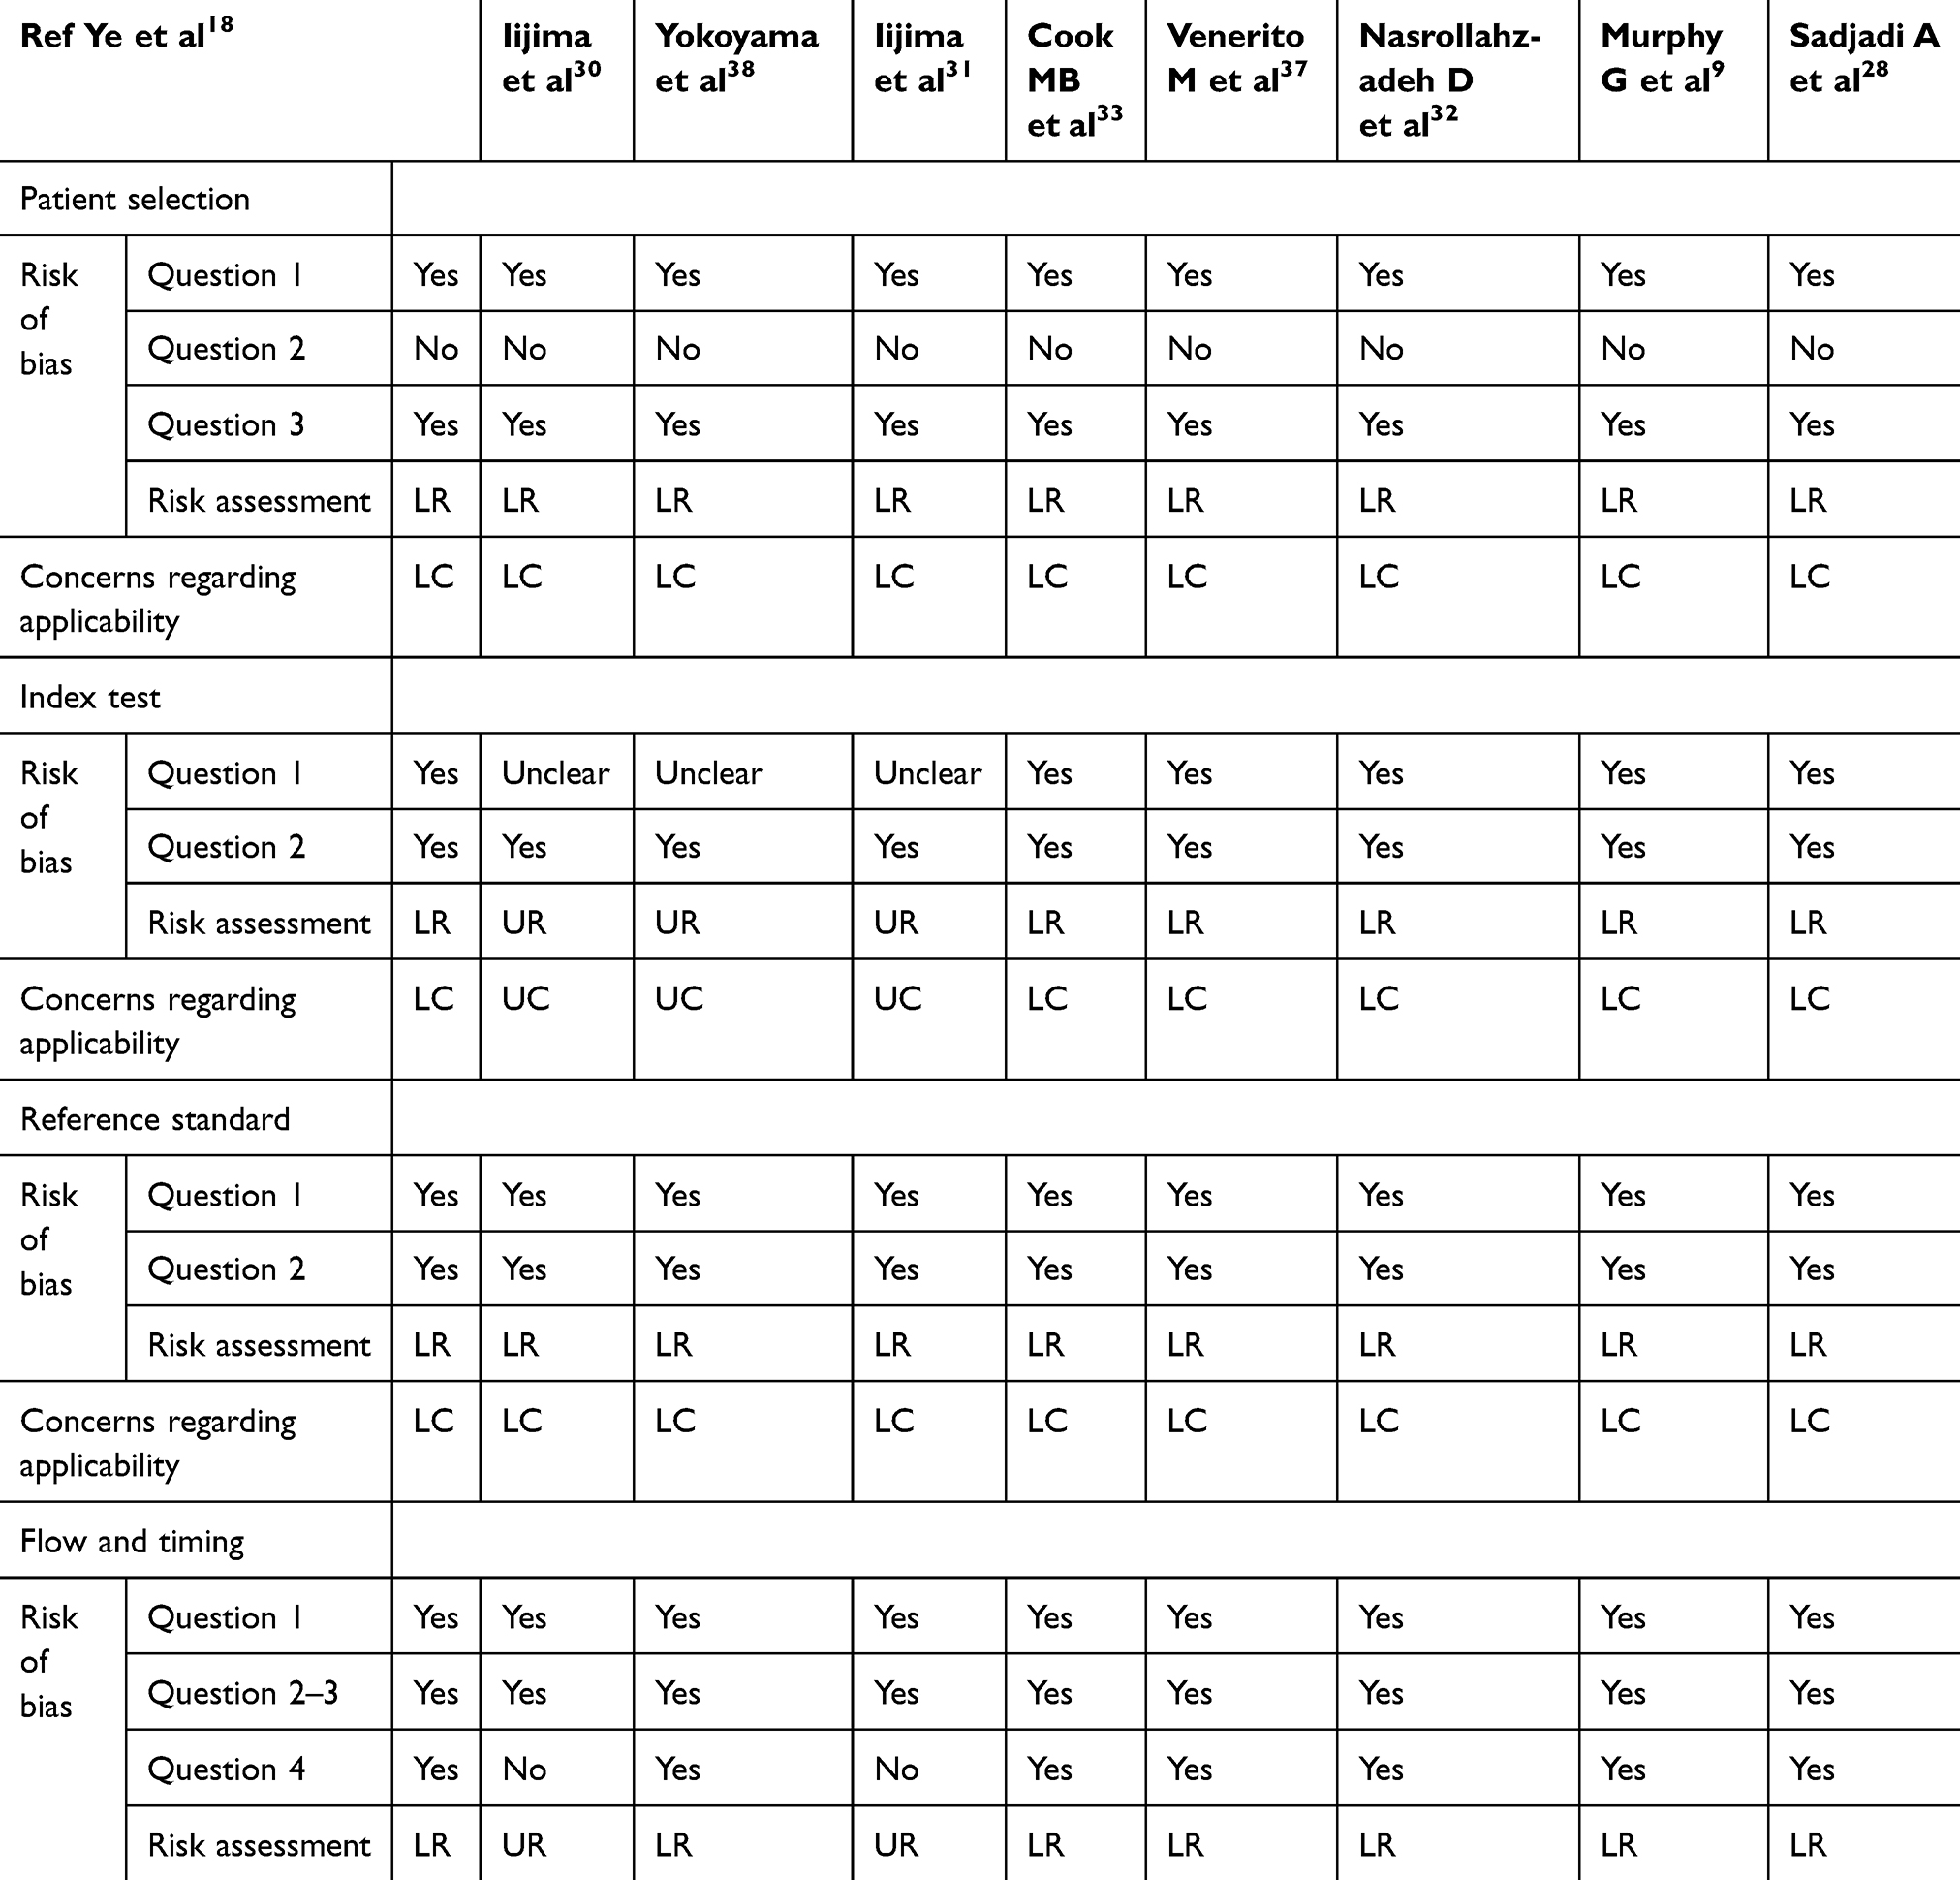 |
Table 2 Qualitative evaluation of the selected articles using the QUADAS-2 criteria |
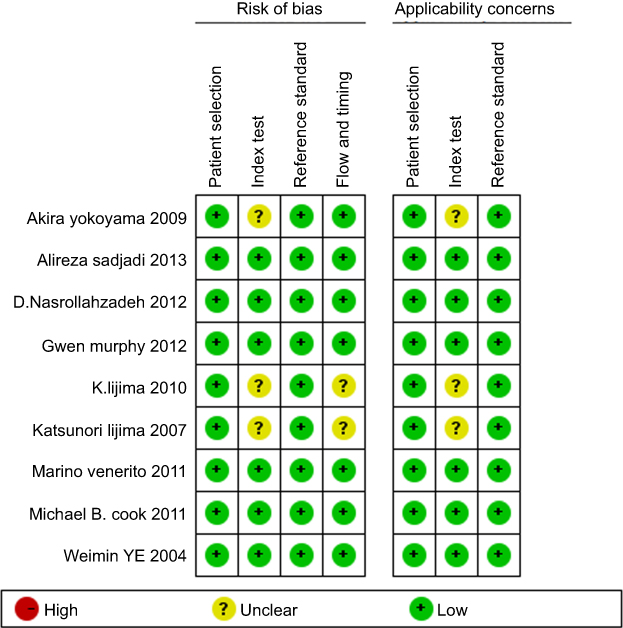 |
Figure 2 Risk of bias and applicability concerns summary: review authors’ judgements about each domain for each included study. |
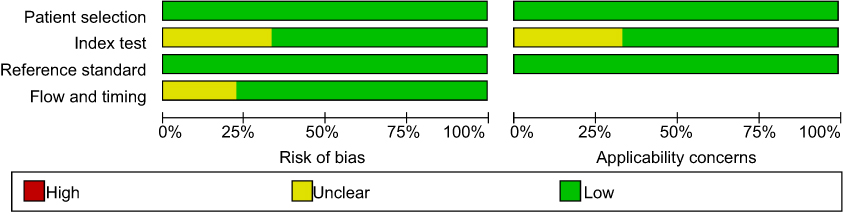 |
Figure 3 Risk of bias and applicability concerns graph: review authors’ judgements about each domain presented as percentages across included studies. |
Meta-analysis results
Meta-analysis results when PGI≤70 ng/mL is used as a diagnostic index
Heterogeneity test
The SROC curve did not show a “shoulder–arm” distribution, and as revealed by the effect test results, the Spearman correlation coefficient r was −1.00 (P=0.98), suggesting that no significant between-study threshold effect existed. When P=0.00 in the sensitivity Q test, the between-study heterogeneity was statistically significant, and the I2 statistic was 95.06%, indicating that heterogeneity was evident (Figure 4). When P=0.01 in the specificity Q test, the between-study heterogeneity was statistically significant, and the I2 statistic was 95.88%, indicating significant heterogeneity (Figure 4). Between-study DOR homogeneity was demonstrated (I2=20.2%, P=0.270) (Figure 5). Therefore, the effect merger in the meta-analysis was performed using a random effect model.
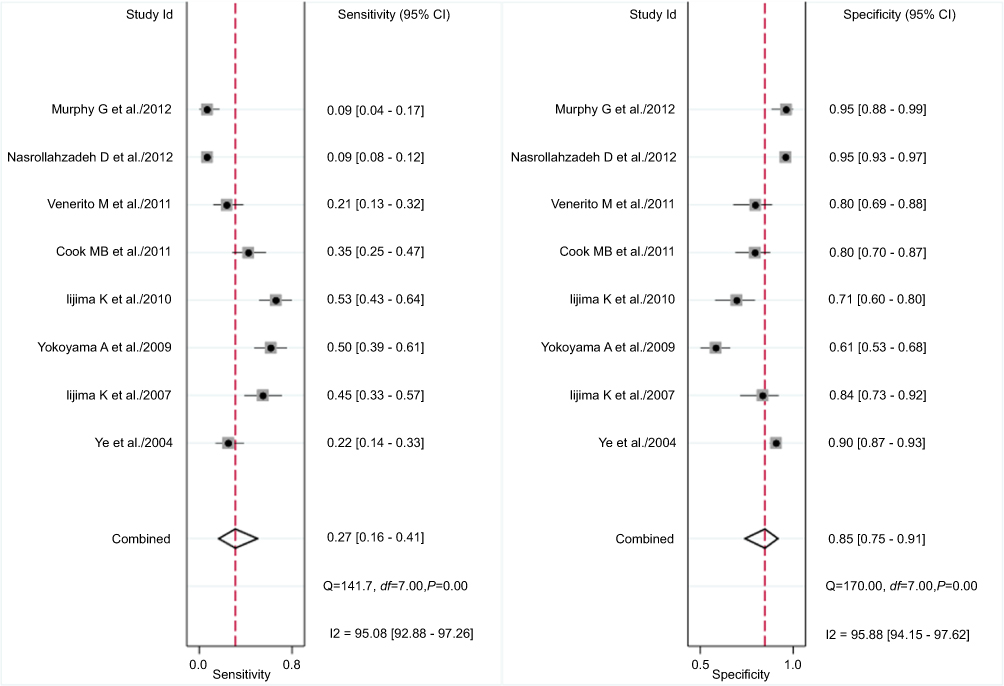 |
Figure 4 PGI≤70 ng/mL diagnosis ESCC forest plot for sensitivity and specificity. |
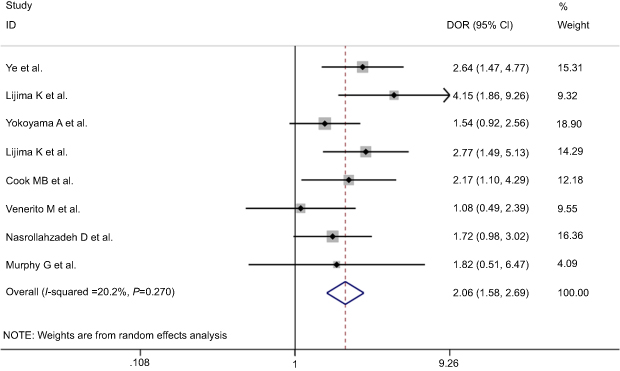 |
Figure 5 DGI forest map for diagnosis of ESCC with PGI≤70 ng/mL. |
Combined effect amount
Meta-analysis was performed using a random effects model; Table 3 presents the sensitivity, specificity, PLR, NLR, DOR, and other results.
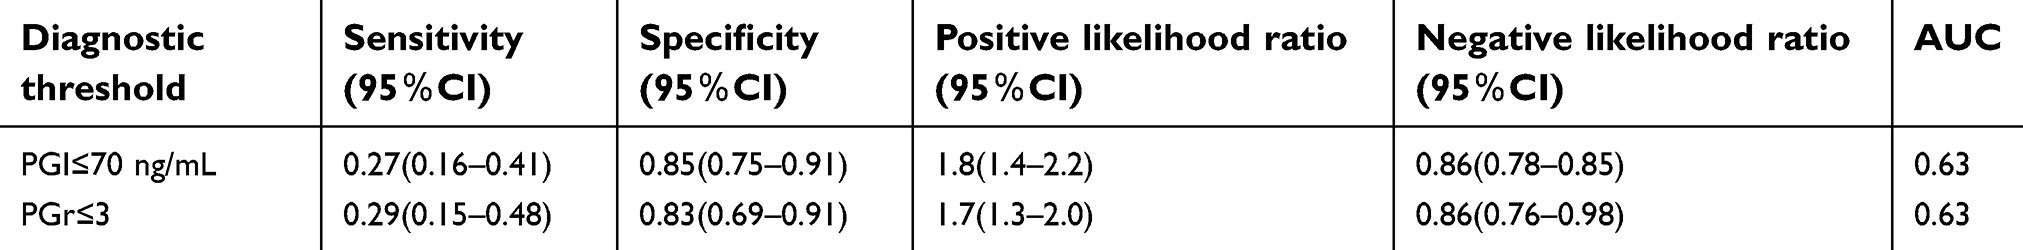 |
Table 3 Meta-analysis of pepsinogen in the diagnosis of ESCC |
Diagnostic value analysis
The AUC of SROC was 0.63 (95% CI: 0.59–0.67), suggesting that when PGI≤70 ng/mL, the ESCC diagnosis becomes less accurate (Figure 6). Fagan results showed that when PGI≤70 ng/mL, the probability of diagnosing ESCC reached 31%. When PGI>70 ng/mL, the probability totaled 18% (Figure S1). The matrix distribution map suggested that the included literature occupies the lower right quadrant and cannot be used for disease diagnosis and screening (Figure 7).
 |
Figure 6 SROC curve for diagnosis of ESCC with PGI ≤ 70ng/mL. |
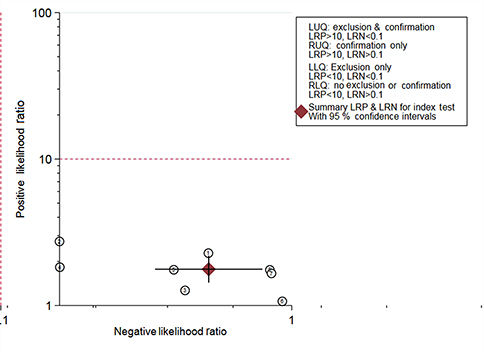 |
Figure 7 Matrix diagram of diagnostic ESCC with PG ≤ 70ng/mL. |
Publication bias
Deek test results showed that the funnel plot was symmetrical without any significant bias (P=0.47) (Figure 8).
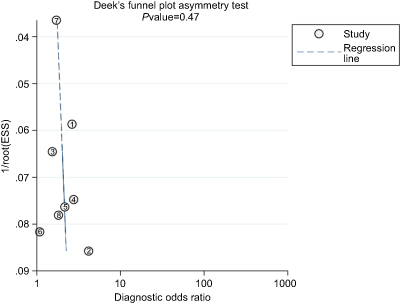 |
Figure 8 Funnel plot incorporating literature bias analysis. |
Meta-analysis results when PGR≤3 is used as a diagnostic index
Heterogeneity test
The SROC curve did not show a “shoulder–arm” distribution, and as revealed by the effect test results, the Spearman correlation coefficient r was −1.00 (P=1.00), suggesting that no significant between-study threshold effect existed. When P=0.00 in the sensitivity Q test, the between-study heterogeneity was statistically significant, and the I2 statistic was 96.33%, indicating that heterogeneity was evident (Figure 9). When P=0.00 in the specificity Q test, the between-study heterogeneity was statistically significant, and the I2 statistic was 96.49%, indicating significant heterogeneity (Figure 9).The DOR of each literature was homogenous (I2=17.6%,P=0.300) (Figure 10). Therefore, the effect merger in the meta-analysis was performed using a random effect model.
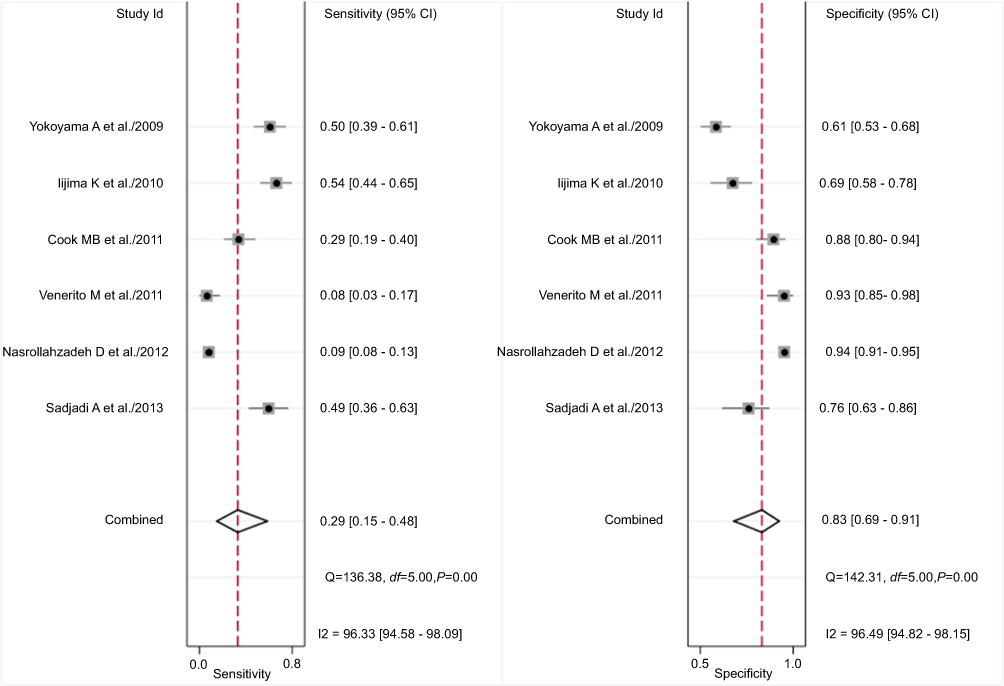 |
Figure 9 PGR≤3 forest map for diagnosis of sensitivity and specificity of ESCC. |
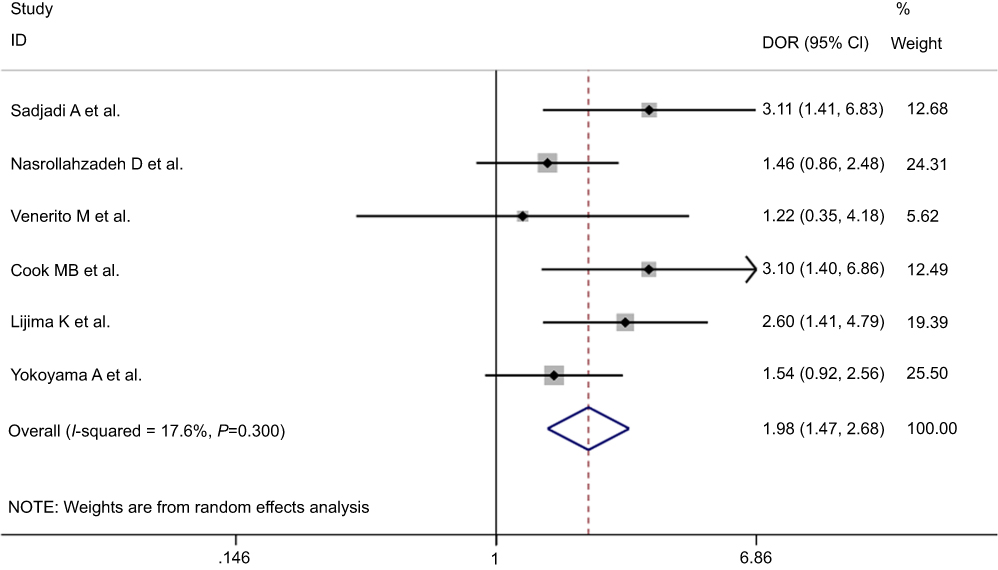 |
Figure 10 DOR forest map of PGR≤3 diagnostic ESCC. |
Combined effect amount
Meta-analysis was performed using a random effects model. Table 3 presents the sensitivity, specificity, PLR, NLR, DOR, and other results.
Diagnostic value analysis
The AUC of SROC was 0.63 (95% CI: 0.59–0.67), suggesting that when PGR≤3, the ESCC diagnosis becomes less accurate (Figure 11). Fagan results showed that when PGR≤3, the probability of diagnosing ESCC reached 29%. When PGR>3, the probability totaled 18% (Figure S2). The matrix distribution map suggested that the included literature occupy the lower right quadrant and cannot be used for disease diagnosis and screening (Figure 12).
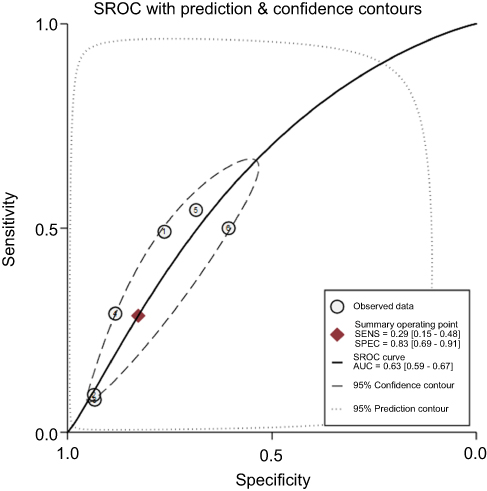 |
Figure 11 PGR≤3 diagnostic SROC curve. |
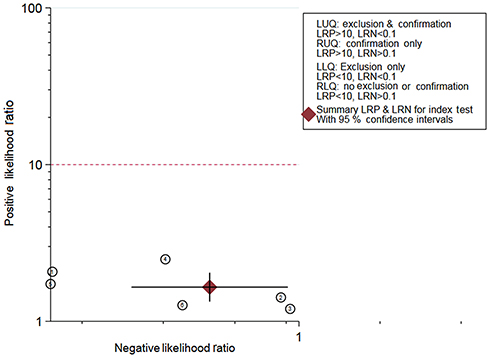 |
Figure 12 Matrix diagram of diagnostic ESCC with PGR≤3. |
Publication bias
Deek test results showed that the funnel plot was symmetrical without any significant bias (P=0.19) (Figure 13).
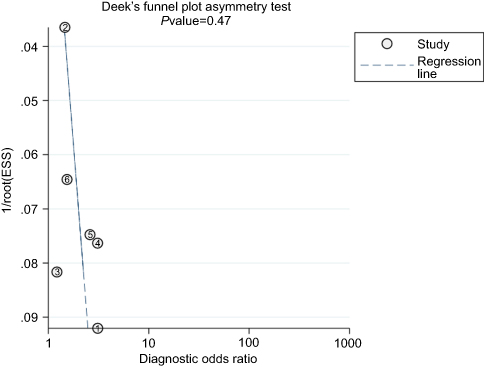 |
Figure 13 Graph of Deeks’ funnel plot asymmetry test. ESS, effective sample size. |
Discussion
PG is an inactive precursor for pepsin, and its main source is the stomach.21 PG can be divided into two subgroups of PGI and PGII.21 Most of the synthesized PG enters the gastric cavity and is activated by gastric juice to form pepsin, a small amount of PG can enter the blood circulation.22 The PG levels in the gastric fluid and blood are consistent with biopsies.23 Serum PGI reflects the gastric mucosal secretion at different sites,24, and any PGR reduction is associated with gastric mucosal dysfunction.25 Any PGI or PGR reduction is believed to be a byword, for atrophic gastritis (AG), especially for fundic gastric atrophy (FGA).
In the 1990s, Rakic S et al, reported that gastric mucosal atrophy is common in patients with ESCC patients,26 and endoscopic diagnosis of corpus trophic gastritis (open-type 2–3 gastric mucosal atrophy, Kimura and Takemoto Classification) may be a risk factor for ESCC.27 To date, the mechanism of increasing risks for ESCC in patients with AG is still unclear, but it is possibly related to an increase innitrosamine compounds or the growth of other cancer-related products, caused by excessive growth of bacteria.28 In 2004, Ye et al, observed that gastric atrophy may increase the risk for ESCC, but it showed no association with increased the risk for EAC.18 A Northern Ireland population study reported that although FGA is rare, the risk for EAC or reflux esophagitis reduced after Helicobacter pylori infection and atrophy. Whether FGA is related to EAC risk requires further study.17
ESD is a precancerous lesion of ESCC.29 Japanese scholar Iijima K and his colleagues noted that gastric atrophy is an independent risk factor for ESCC, and ESCC visibly increases with aggravated atrophy.30 Using PGI<25 ng/mL or PGR<2.0 as the standard for diagnosing atrophy, their team revealed that although no atrophy is present, severe gastric acid deficiency remains an independent risk factor for ESCC.31 Kamangar F et al, stated that ESD presents no significant association with serum PGI but is linearly associated with a decrease in PGR (P=0.03).19
The Iranian study discovered that controlling other potential confounding factors confound may increase the risk for ESCC in patients with atrophy (PGI<55 ng/mL) twice as those without atrophy (PGI<11.8 ng/mL), and gastric atrophy is a risk factor for ESCC.32 Cook MB et al, observed that in the Finnish population, gastric atrophy (PGR<4)is associated with the risk for ESCC.33 In the same period, a Chinese mainland study revealed that although the risks for ESCC in the subjects slightly increased when PGR≤4, evidence for diagnosing the risk for ESCC with PGR remains lacking.34 In the Netherlands, scholars noted that despite their association, the risk for ESCC shows no increase with gastric atrophy severity (P=0.90).35 Xue et al, observed in his prospective studies that in rural Chinese areas, no significant correlation exists between the PG level (PGI≤70 ng/mL alone, PGR≤3 or PGI≤70 ng/mL and PGR≤3) and ESCC onset.36 Venerito M et al, defined PGI≤70 ng/mL and PGR≤3 as FGA, and he reckoned that serological and histological diagnosis of atrophy exhibits no association with the risk for ESCC(OR=1.17, 95% CI: 0.54–2.56 vs OR=1.91, 95% CI: 0.6–5.99).37
The DOR of this study was 2 (95% CI: 2–3), indicating that the two diagnostic methods restrict ESCC diagnosis. When AUC >0.9, a high accuracy was observed, and an AUC of 0.5, indicates that the diagnostic test is meaningless. In this study, the AUC of SROC reached 0.63 (95% CI: 0.59–0.67), and the appeal method diagnosed ESCC with low accuracy.
When the diagnostic method was PGI≤70 ng/mL, the PLR equaled 1.8 (95% CI: 1.4–2.2), indicating that the positive rate of the diagnostic index in patients with ESCC was 1.8 times higher than that of the non-ESCC population. The NLR amounted to 0.86 (95% CI: 0.78–0.85), suggesting that 86% of the non-ESCC people feature PGI≤70 ng/mL. Therefore, the above method possesses a limited diagnostic value for ESCC. When the diagnostic method was PGR≤3, the PLR reached 1.7 (95% CI: 1.4–2.2), suggesting that the positive rate of this diagnostic index in patients with ESCC was 1.7 times higher than that of patients in the non-ESCC population. The NLR was 0.86 (95% CI: 0.75–0.97), suggesting that 86% of the people without ESCC exhibit PGR≤3. In view of this result, the two diagnostic methods manifest limited diagnostic value for ESCC.
The present study features certain limitations, such as the definite literature that were included and which failed to analyze, the effects of tumor staging and pathological type on the diagnostic sensitivity and specificity. In this research, small number of publications available were included, part of which were used to analyze the diagnostic PGI value, however, some of which were used to research PGR, and the thresholds were different, it was possible to produce heterogeneity. Moreover, several retrospective studies used in this work may feature blind loopholes.
In summary, when PGI≤70 ng/mL or PGR≤3, the diagnostic specificity of ESCC is high, but the sensitivity is low. Thus, the results cannot be used for ESCC diagnosis. Therefore, high-quality studies are necessary to explore their clinical diagnostic value, to obtain accurate results with less heterogeneity.
Abbreviation list
PGI, pepsinogen I; PGR, PGI/PGII ratio; AGA, gastric fundus atrophy; EC, esophageal carcinoma; SROC, summary receiver operating characteristic curve; AUC, area under the curve; ESCC, esophageal squamous cell carcinoma; ESD, esophageal squamous dysplasia; TP, true positive; FP, false positive; TN, true negative; FN, false negative; DOR, diagnostic odds ratio; PLR, positive likelihood ratio; NLR, negative likelihood ratio; AG, atrophic gastritis; FGA, fundic gastric atrophy.
Ethical approval
This article does not contain examinations performed on human participants therefore, ethical approval was not necessary.
Acknowledgments
This study was funded by the fund of Taihe Hospital (2014JJXM031) and the 2016 Joint Diagnostic Medicine Research Project of Taihe Hospital (2016JD02).
Disclosure
The authors report no conflicts of interest in this work.
References
1. Bray F, Ferlay J, Soerjomataram I, Siegel RL, Torre LA, Jemal A. Global cancer statistics 2018: GLOBOCAN estimates of incidence and mortality worldwide for 36 cancers in 185 countries. CA Cancer J Clin. 2018;68:394–424. doi:10.3322/caac.v68.6
2. Baba Y, Iwatsuki M, Yoshida N, Watanabe M, Baba H. Review of the gut microbiome and esophageal cancer: pathogenesis and potential clinical implications. Ann Gastroenterol Surg. 2017;1(2):99–104. doi:10.1002/ags3.12014
3. Pakzad R, Mohammadian-Hafshejani A, Khosravi B, et al. The incidence and mortality of esophageal cancer and their relationship to development in Asia. Ann Transl Med. 2016;4(2):29. doi:10.21037/atm.2016.04.05
4. Arnold M, Soerjomataram I, Ferlay J, Forman D. Global incidence of oesophageal cancer by histological subtype in 2012. Gut. 2015;64(3):381–387. doi:10.1136/gutjnl-2014-308124
5. Gupta B, Kumar N. Worldwide incidence, mortality and time trends for cancer of the oesophagus. Eur J Cancer Prev. 2017;26(2):107–118. doi:10.1097/CEJ.0000000000000249
6. Tong Q, Wang XL, Li SB, et al. Combined detection of IL-6 and IL-8 is beneficial to the diagnosis of early stage esophageal squamous cell cancer: a preliminary study based on the screening of serum markers using protein chips. Onco Targets Ther. 2018;11:5777–5787. doi:10.2147/OTT.S171242
7. Wei W, Zhang W, Li C, et al. Label-free detection of pepsinogen 1 and 2 by polyethylene coating Lamb microfluidic device. Biosens Bioelectron. 2019;129:231–237. doi:10.1016/j.bios.2018.09.075
8. Samloff IM, Taggart RT. Pepsinogens, pepsins, and peptic ulcer. Clin Invest Med. 1987;10(3):215–221.
9. Murphy G, Kamangar F, Albanes D, et al. Serum ghrelin is inversely associated with risk of subsequent oesophageal squamous cell carcinoma. Gut. 2012;61(11):1533–1537. doi:10.1136/gutjnl-2011-300653
10. Park CH, Kim EH, Jung DH, et al. The new modified ABCD method for gastric neoplasm screening. Gastric Cancer. 2016;19(1):128–135. doi:10.1007/s10120-015-0473-4
11. Moher D, Liberati A, Tetzlaff J, Altman DG. Preferred reporting items for systematic reviews and meta-analyses: the PRISMA statement. BMJ. 2009;339:b2535. doi:10.1136/bmj.b2651
12. Whiting PF, Rutjes AW, Westwood ME, et al. QUADAS-2: a revised tool for the quality assessment of diagnostic accuracy studies. Ann Intern Med. 2011;155(8):529–536. doi:10.7326/0003-4819-155-8-201110180-00009
13. Sano H, Tomita K, Sano A, et al. Accuracy of objective tests for diagnosing adult asthma in symptomatic patients: a systematic literature review and hierarchical Bayesian latent-class meta-analysis. Allergol Int. 2019;68(2):191–198. doi:10.1016/j.alit.2018.08.013
14. Peng J, Qi S, Wang P, Li W, Liu C, Li F. Diagnosis and prognostic significance of c-Met in cervical cancer: a meta-analysis. Dis Markers. 2016;2016:6594016. doi:10.1155/2016/6594016
15. Wang M, Yang Y, Xu J, Bai W, Ren X, Wu H. CircRNAs as biomarkers of cancer: a meta-analysis. BMC Cancer. 2018;18(1):303. doi:10.1186/s12885-018-4242-8
16. Weck MN, Stegmaier C, Rothenbacher D, Brenner H. Epidemiology of chronic atrophic gastritis: population-based study among 9444 older adults from Germany. Aliment Pharmacol Ther. 2007;26(6):879–887. doi:10.1111/j.1365-2036.2007.03430.x
17. Anderson LA, Murphy SJ, Johnston BT, et al. Relationship between Helicobacter pylori infection and gastric atrophy and the stages of the oesophageal inflammation, metaplasia, adenocarcinoma sequence: results from the FINBAR case-control study. Gut. 2008;57(6):734–739. doi:10.1136/gut.2007.132662
18. Ye W, Held M, Lagergren J, et al. Helicobacter pylori infection and gastric atrophy: risk of adenocarcinoma and squamous-cell carcinoma of the esophagus and adenocarcinoma of the gastric cardia. J Natl Cancer Inst. 2004;96(5):388–396. doi:10.1093/jnci/djh057
19. Kamangar F, Diaw L, Wei WQ, et al. Serum pepsinogens and risk of esophageal squamous dysplasia. Int J Cancer. 2009;124(2):456–460. doi:10.1002/ijc.23918
20. Yu G, Gail MH, Shi J, et al. Association between upper digestive tract microbiota and cancer-predisposing states in the esophagus and stomach. Cancer Epidemiol Biomarkers Prev. 2014;23(5):735–741. doi:10.1158/1055-9965.EPI-13-0855
21. Gritti I, Banfi G, Roi GS. Pepsinogens: physiology, pharmacology pathophysiology and exercise. Pharmacol Res. 2000;41(3):265–281. doi:10.1006/phrs.1999.0586
22. Zwiers A, Crusius B, Pals G, Donker AJ, Meuwissen SG, Ten KR. Human pepsinogen A isozymogen patterns in serum and gastric mucosa. Gastroenterology. 1990;99(6):1576–1580.
23. Korstanje A, Den Hartog G, Biemond I, Lamers CB. The serological gastric biopsy: a non-endoscopical diagnostic approach in management of the dyspeptic patient: significance for primary care based on a survey of the literature. Scand J Gastroenterol Suppl. 2002;236:22–26.
24. Albillos A, Alvarez-Mon M, Rossi I, Gonzalo MA, Marin MC, Abreu L. Different HCl and pepsinogen I secretion patterns in anatomically defined gastric ulcer subsets. Am J Gastroenterol. 1990;85(5):535–538.
25. Daugule I, Sudraba A, Chiu HM, et al. Gastric plasma biomarkers and Operative Link for Gastritis Assessment gastritis stage. Eur J Gastroenterol Hepatol. 2011;23(4):302–307. doi:10.1097/MEG.0b013e3283438ac3
26. Rakic S, Dunjic MS, Pesko P, Milicevic M. Atrophic chronic gastritis in patients with epidermoid carcinoma of the esophagus. J Clin Gastroenterol. 1993;17(1):84. doi:10.1097/00004836-199307000-00020
27. Akiyama T, Inamori M, Iida H, et al. Macroscopic extent of gastric mucosal atrophy: increased risk factor for esophageal squamous cell carcinoma in Japan. Bmc Gastroenterol. 2009;9:34. doi:10.1186/1471-230X-9-34
28. Sadjadi A, Yazdanbod A, Lee YY, et al. Serum ghrelin; a new surrogate marker of gastric mucosal alterations in upper gastrointestinal carcinogenesis. Plos One. 2013;8(9):e74440. doi:10.1371/journal.pone.0074440
29. Mwachiro MM, Burgert SL, Lando J, et al. Esophageal squamous dysplasia is common in asymptomatic kenyans: a prospective, community-based, cross-sectional study. Am J Gastroenterol. 2016;111(4):500–507. doi:10.1038/ajg.2016.26
30. Iijima K, Koike T, Abe Y, et al. Extensive gastric atrophy: an increased risk factor for superficial esophageal squamous cell carcinoma in Japan. Am J Gastroenterol. 2007;102(8):1603–1609. doi:10.1111/j.1572-0241.2007.01257.x
31. Iijima K, Koike T, Abe Y, et al. Gastric hyposecretion in esophageal squamous-cell carcinomas. Dig Dis Sci. 2010;55(5):1349–1355. doi:10.1007/s10620-009-0853-x
32. Nasrollahzadeh D, Malekzadeh R, Aghcheli K, et al. Gastric atrophy and oesophageal squamous cell carcinoma: possible interaction with dental health and oral hygiene habit. Br J Cancer. 2012;107(5):888–894. doi:10.1038/bjc.2012.332
33. Cook MB, Dawsey SM, Diaw L, et al. Serum pepsinogens and Helicobacter pylori in relation to the risk of esophageal squamous cell carcinoma in the alpha-tocopherol, beta-carotene cancer prevention study. Cancer Epidemiol Biomarkers Prev. 2010;19(8):1966–1975. doi:10.1158/1055-9965.EPI-10-0270
34. Ren JS, Kamangar F, Qiao YL, et al. Serum pepsinogens and risk of gastric and oesophageal cancers in the General Population Nutrition Intervention Trial cohort. Gut. 2009;58(5):636–642. doi:10.1136/gut.2008.168641
35. de Vries AC, Capelle LG, Looman CW, et al. Increased risk of esophageal squamous cell carcinoma in patients with gastric atrophy: independent of the severity of atrophic changes. Int J Cancer. 2009;124(9):2135–2138. doi:10.1002/ijc.23955
36. Xue L, Xing L, Wang J, et al. Serum pepsinogens and Helicobacter pylori are not associated with esophageal squamous cell carcinoma in a high-risk area in China. Tumori. 2013;99(2):134–138. doi:10.1700/1283.14181
37. Venerito M, Kohrs S, Wex T, et al. Helicobacter pylori infection and fundic gastric atrophy are not associated with esophageal squamous cell carcinoma: a case-control study. Eur J Gastroenterol Hepatol. 2011;23(10):859–864. doi:10.1097/MEG.0b013e3283496469
38. Yokoyama A, Omori T, Yokoyama T, et al. Chronic atrophic gastritis and metachronous gastric cancer in Japanese alcoholic men with esophageal squamous cell carcinoma. Alcohol Clin Exp Res. 2009;33(5):898–905. doi:10.1111/j.1530-0277.2009.00908.x
 © 2019 The Author(s). This work is published and licensed by Dove Medical Press Limited. The full terms of this license are available at https://www.dovepress.com/terms.php and incorporate the Creative Commons Attribution - Non Commercial (unported, v3.0) License.
By accessing the work you hereby accept the Terms. Non-commercial uses of the work are permitted without any further permission from Dove Medical Press Limited, provided the work is properly attributed. For permission for commercial use of this work, please see paragraphs 4.2 and 5 of our Terms.
© 2019 The Author(s). This work is published and licensed by Dove Medical Press Limited. The full terms of this license are available at https://www.dovepress.com/terms.php and incorporate the Creative Commons Attribution - Non Commercial (unported, v3.0) License.
By accessing the work you hereby accept the Terms. Non-commercial uses of the work are permitted without any further permission from Dove Medical Press Limited, provided the work is properly attributed. For permission for commercial use of this work, please see paragraphs 4.2 and 5 of our Terms.