")
Back to Journals » International Journal of General Medicine » Volume 14
Serum microRNAs as Biomarkers for the Noninvasive Early Diagnosis of Biliary Tract Cancer
Authors Han Y, Zhang H, Zhou Z, Liu R, Liu D, Bai M, Fan Q, Li J, Zhu K, Li H, Ning T, Ying G , Ba Y
Received 18 December 2020
Accepted for publication 15 March 2021
Published 1 April 2021 Volume 2021:14 Pages 1185—1195
DOI https://doi.org/10.2147/IJGM.S297371
Checked for plagiarism Yes
Review by Single anonymous peer review
Peer reviewer comments 3
Editor who approved publication: Dr Scott Fraser
Yueting Han,1,* Haiyang Zhang,1,* Zhengyang Zhou,1,* Rui Liu,1 Dongying Liu,1 Ming Bai,1 Qian Fan,1 Jialu Li,2 Kegan Zhu,1 Hongli Li,1 Tao Ning,1 Guoguang Ying,1 Yi Ba1
1Tianjin Medical University Cancer Institute and Hospital, National Clinical Research Center for Cancer, Tianjin’s Clinical Research Center for Cancer, Key Laboratory of Cancer Prevention and Therapy, Tianjin, 300060, People’s Republic of China; 2Division of Gastroenterology and Hepatology, Shanghai Institute of Digestive Disease, Key Laboratory of Gastroenterology and Hepatology, Ministry of Health, Shanghai Jiao-Tong University School of Medicine Renji Hospital, Shanghai, 200001, People’s Republic of China
*These authors contributed equally to this work
Correspondence: Yi Ba; Guoguang Ying Email [email protected]; [email protected]
Background: Biliary tract cancers (BTCs) are aggressive malignancies with difficult early diagnosis and poor prognosis. Studies have shown that microRNAs (miRNAs) are expected to be biomarkers of the disease, which indicates that we can diagnose cancers according to the miRNAs that have significant changes. The aim of this study was to explore miRNA biomarkers of BTCs.
Methods: A total of 163 samples were collected and divided into the control group, the benign group and the malignant group. High-throughput low-density chips were used to screen miRNAs with significant changes. Then, the preliminary screening test and the verification test were performed by quantitative real time PCR (qRT-PCR). Finally, the level of miRNAs in serum exosomes was measured.
Results: MiR-10a, miR-21, miR-135b, miR-221, and miR-214 were upregulated in the BTCs group compared to the control group. The change in the miR-221 level was statistically significant when the malignant group was compared with the benign group (P< 0.01). Meanwhile, miR-135b and miR-214 were enriched in serum exosomes.
Conclusion: Five miRNAs in the serum were found to be significantly upregulated in patients with BTCs. Among them, miR-221 can serve as an early diagnostic marker for BTCs patients. MiR-10a, miR-21, miR-135b and miR-214 can be used as biomarkers for the diagnosis of biliary diseases.
Keywords: biliary tract cancers, microRNAs, biomarker, noninvasive diagnosis
Introduction
Biliary tract cancers (BTCs) are highly lethal malignant tumors that originate from the epithelium of the bile duct and gallbladder, and they encompass cancers of the gallbladder (GBC), intrahepatic bile ducts (IHBDC), extrahepatic bile ducts (EHBDC), and the ampulla of Vater (AVC).1,2 The regional variations of BTCs incidence have been confirmed, with higher rates in Asia than that in the United States and some European countries.3–5 In recent years, it has been reported that the incidence of EHBDC remains basically unchanged, whereas the incidence and mortality of IHBDC are increasing year by year.6 The onset of BTCs is insidious, and the symptoms of many patients are similar to those of patients with benign biliary diseases (BBD).7 In brief, a large number of patients with BTCs miss the optimal time for treatment when diagnosed at advanced stages, due to the inconspicuous early symptoms, and the lack of specific diagnostic markers.3,8 For most BTCs patients, neither surgery nor chemotherapy provides the desired therapeutic effect.9,10 The overall five-year survival rate of BTCs is as low as 10%.11 Meanwhile, various studies on BTCs are still ongoing.12 Therefore, accurate early diagnosis is particularly important.
The coelevation of carcinoembryonic antigen (CEA) and carbohydrate 19-9 (CA19-9), which are often used as auxiliary diagnostic markers, may indicate the occurrence of BTCs.13 And circulating tumor DNA is only showing some potential in BTCs.14 However, current methods are unable to reach the level of significant specificity and sensitivity.15 As partially applicable and invasive strategies, endoscopic retrograde cholangiopancreatography (ERCP) and percutaneous transhepatic cholangiography drainage (PTCD) can obtain a relatively accurate pathological diagnosis, but meanwhile may cause some complications.16–18 The above facts signify that there is a lack of suitable approaches for the early diagnosis and differential diagnosis of BTCs, which seriously obstructs the treatment of BTCs. In conclusion, it is extremely imperative to explore a universal, accurate, and noninvasive BTCs diagnostic method.
Therefore, microRNAs (miRNAs), a research hotspot that has emerged in the field of disease diagnosis over the years, has attracted all of our attention. They are a class of small noncoding RNAs with a length of 18–25 nucleotides that regulate various biological processes by targeting messenger RNA (mRNA), and they have a considerable impact on tumor development.19 In the last few years, it has been reported that miRNAs are emerging as biomarkers for the diagnosis of some tumors.20,21 For example, in breast cancer, miRNAs that are organ-specific and tractable are stably expressed in the blood and are likely to serve as markers in diagnosis and treatment monitoring.22 In the present study, we divided patients into three groups: patients with BTCs, patients with BBD, and healthy people. Then, the miRNAs with significant changes were screened by the method of low-density chips which has the advantages of high-throughput and multi-index analysis.23 We performed a preliminary screening test as well as a verification test by qRT-PCR. Five miRNAs in the serum samples were found to be obviously upregulated in patients with BTCs. Among them, miR-221 can be used as an early diagnostic marker of BTCs. MiR-10a, miR-21, miR-135b and miR-214 are expected to function as biomarkers for the diagnosis of biliary diseases. Finally, we verified that miR-135b and miR-214 were enriched in the majority of the serum exosomes of the patients.
Materials and Methods
Experimental Serum Samples
A total of 163 samples in this study were taken from the serum of clinical patients with biliary diseases and healthy people with physical examinations which came from Tianjin Medical University Cancer Hospital from March 2016 to September 2016, including 75 cases of BTCs, 20 cases of BBD and 68 cases of healthy people. All samples were taken on the day of admission or the morning after admission on an empty stomach. All blood samples were centrifuged on the day of extraction and subjected to laboratory tests, including routine blood, biochemical, immunological and tumor markers test and stored in the freezer at −80°C.
The samples were divided into three groups: the malignant group (n=75), the benign group (n=20) and the control group (n=68). The malignant group included serum samples from patients with gallbladder carcinoma, cholangiocarcinoma and ampullary carcinoma. The benign group included serum samples from patients with chronic cholecystitis, gallbladder polyps, gallbladder adenomyomatosis, gallstones, papilloma, etc. All patients in the control group had been examined in detail, and there was no obvious evidence of tumor history and no medical records in the past three months. Clinical information and pathological information, including age, gender, past history, postoperative pathology, treatment and other information, were collected for all patients in the malignant and benign groups. Patients with BTCs mostly had abdominal pain, yellow staining of skin sclera, and space-occupying lesions and were mostly diagnosed by histology, liver needle aspiration biopsy, and imaging. In this study, all tumor patients achieved clinical stages according to the TNM standard (AJCC 8th Edition). Case information was summarized and analyzed by SPSS 19.0, and detailed information is summarized in Table S1.
Low-Density Chip Sequencing
The serum samples of the malignant group, the benign group and the control group were mixed into three 2 mL EP tubes with 50 μL serum each, and high-throughput sequencing was carried out by low-density chip technology. The specific experimental process is shown in Table S2.
First, total RNA was extracted using Mirneasy Mini Kit-QIAGEN P/N 217004. Then, the marker reaction system was prepared. The RNA sample was diluted to 50 ng/μL with RNase-free water. Two microliters of diluted RNA was poured into 1.5 mL centrifuge tube, and placed on ice for later use. The dephosphorylated mixture was prepared according to Table S3.
Two microliters of phosphorylated mixture was taken into sample tube, and blow and mix. The reaction mixture was placed in a metal bath at 37°C for 30 minutes, and the following reaction was carried out immediately, otherwise the reaction sample should be stored at −80°C for later use. 2.8 μL 100% DMSO was added to each tube, and heated in a metal bath at 100°C for 5–10min. Then, the sample tubes were quickly placed in an ice water bath to cool down, and next step was performed immediately. The 10× T4 ligase buffer was incubated at 37°C and vortexed until the precipitates were completely dissolved, then cooled to room temperature for later use. The connection reaction mixture was prepared according to Table S4.
Take 4.5 μL reaction mixture into sample tube, blow and mix well, centrifugal slightly. The sample was incubated at 16°C for 2h. After the reaction was completed, the sample was completely drained in a vacuum concentrator for later use. The temperature could be set at 45°C-55°C to speed up the drying time. 125 μL nuclease-free water was added into a lyophilized 10× Ge blocker tube. And swirl slightly, dissolve completely (incubated at 37°C for 4–5min if necessary), centrifuge slightly, set aside. Next, hybrid samples were prepared. A metal bath of 100°C was prepared for reserve. The drained samples were re-dissolved in 17 μL nuclease-free water, and each sample was added with 1.0 μL Hyb Spike-In solution (three dilutions), 4.5 μL prepared 10× GE blocker, and 22.5 μL 2× HI-RPM hybrid buffer, and mixed slightly. The reaction mixture was heated in a metal bath at 100°C for 5min. After the reaction, it was quickly put into an ice water bath to cool for 5min. The next step was carried out immediately after the reaction solution was collected by centrifugation. Then, the hybridization mixture was prepared. About 45 μL reaction solution was absorbed slowly to cover sheet. The chip point sample face was placed down slowly on the cover. The screwed SureHyb Chamber was assembled, and it was shook slightly to allow the bubbles inside to move freely. SureHyb Chamber was balanced on a rack in a crossbreeding oven at 55°C, 20 RPM, and hybridized for 20 hours. Finally, chip washing, chip scanning, chip data extraction.
Total RNA was extracted and purified using the mirVana™ miRNA Isolation Kit without phenol (Cat # AM1561, Ambion, Austin, TX, US). Human miRNA microarrays from Agilent Technologies (8*60 K), containing probes for 2549 human miRNAs from the miRbase V21.0 database, were adopted. Total RNA (100 ng) extracted from each serum sample was used as the inputs for sample labeling and hybridization preparation in accordance with the manufacturer’s protocol (Agilent Technologies, Santa Clara, CA). The microarray image information was converted into spot intensity values using Scanner Control Software Rev. 7.0 (Agilent Technologies). Raw data were normalized by Quantile algorithm, included in the R package AgiMicroRna. The microarray experiments were performed by following the protocol of Agilent Technologies Inc., Shanghai Biotechnology Corporation.
Then, the differentially expressed miRNAs in the serum were identified using the t-test with the cut-off criteria of P < 0.01 and fold change >2 or <0.5.
RNA Isolation and Quantitative Real-Time PCR
Total RNA from all samples was isolated according to the manufacturer’s protocols.
First, 100 μL of sample was added to 300 μL of water, and 200 μL (pH=4.7–5.5) of acidic phenol was added after full mixing. After violent shaking, 200 μL of chloroform was added. After full shaking again, centrifugation was performed at 16,000 ×g for 20 min at room temperature. Then, the supernatant (approximately 400 μL) was carefully removed and added to 800 μL of isopropyl alcohol; then, 40 μL of 3 M sodium acetate (pH=5.2) was added, incubated at −20°C for 1 hour, and centrifuged at 16,000 ×g for 20 min at 4°C. After the supernatant was fully discarded, 1 mL of 75% ethanol was added; the mixture was gently inverted several times and centrifuged at 16,000 ×g for 15 min at 4°C. After fully discarding supernatant, the sample was inverted for 15 min and dried at room temperature for 30 min; then, 14 μL of DEPC water was added to dissolve and precipitate the RNA. The above steps were performed in ultraclean platforms using RNase free EP tubes. Next, 2 μL of each RNA samples was taken to determine the OD260/OD280 and RNA concentration, and then the samples were stored at −20 °C.
The cDNA was obtained via an avian myeloblastosis virus (AMV) reverse transcriptase (TaKaRa) reaction. The following ingredients were mixed into a 0.5 mL RNASe-free EP tube (operated on ice):
(reverse transcription reaction system 10 μL)
AMV 5×buffer 2 μL
AMV 0.5 μL
dNTPs mixture (10 mmol) 1 μL
RT-PRIMER 1 μL
RNA 0.1 μg
DEPC 5.5μL-VRNA
Reverse transcription was performed according to the following procedure:
Step 1: 16°C 30 minutes
Step 2: 42°C 30 minutes
Step 3: 85°C 5 minutes
Step 4: 4°C forever.
Next, the cDNA was mixed into each well according to the following ingredients with two duplicate wells per sample (operate on ice)
(the qRT-PCR reaction system was 20μ)
10×buffer (Mg+ + Plus) 2 μL
dNTPs mixture (10 mmol) 0.4 μL
Taq 0.3 μL
TaqMan probe+primer 0.33 μL
DEPC 15.97 μL
cDNA 1 μL
The membrane was sealed and centrifuged for 5min in a low temperature centrifuge.
Quantitative real-time PCR (qRT-PCR) was performed according to the following procedure:
Step 1: 95°C 5 minutes
Step 2: 95°C 15 seconds
Step 3: 60°C 1 minutes (Fluorescence detection stage)
Step 2- Step 3: 40 cycles
After the reactions were completed, the cycle threshold (CT) data were determined using fixed threshold settings, and the mean CT values were determined from triplicate PCRs.
Extraction and Identification of Exosomes
Exosome extraction was performed using the exosome extraction kit. First, 100ul sample was added into the EP tube without RNA enzyme, and 1/3 volume of RibotM Exosome Isolation Reagent was added. Blend with a pipette until the sample was completely mixed (the solution would appear cloudy). And the EP tube was placed in the refrigerator at 4°C for 30 minutes. Then, it was put in a centrifuge for 2 minutes at 4°C, 15000g. The supernatant was carefully absorbed with pipette, and the precipitate at the bottom of the EP tube was exosomes. Finally, 1 mL TRI201 solution was added into the EP tube and stored in a refrigerator at −80°C.
An appropriate amount of PBS buffer was absorbed, and the extracted exosomes were added, dissolved and mixed fully to prepare exosome suspension with a final concentration of 0.5 mg/mL. Exosome suspension was absorbed, dropped onto copper sheet and placed on filter paper. Incandescent light for 10 minutes. An appropriate amount of 1% phosphotungstic acid was added to stain exosomes for 5 minutes. Incandescent light for 20 minutes. The size and morphology of exosomes were observed under a microscope and photographed for recording.
Statistical Analyses
According to the CT values, the FC of 13 miRNAs can be calculated by the 2−ΔCt formula. GraphPad Prism 5.0 software was used to draw scatter plots for comparative analysis of changes in serum miRNAs in patients with BTCs and BBD. An FC histogram of the malignant group was drawn separately to analyze whether each miRNA had diagnostic significance for BTCs. SPSS 19.0 software was used to statistically analyze FC values with the t-test of two independent samples, and P < 0.01 indicated a significant difference. All of the data are representative of at least three independent experiments and are expressed as the mean ± SE. A P < 0.05 was considered to be statistically significant using Student’s t tests: *P < 0.05; **P < 0.01; and ***P < 0.001.
Results
Description and Analysis of Clinical Case Information
All BTCs samples in our study are shown in Table S1. Among the 75 patients with BTCs, GBC was the main type, cholangiocarcinoma was the second type, and AVC was less common. The pathological grade was mostly medium-low differentiation, and the histological grade was mainly adenocarcinoma. Based on the TNM standard staging of GBC (AJCC 8th Edition), combined with postoperative pathologic returns, we analyzed the 75 BTCs samples for clinical stages. Most patients were diagnosed at stage III or IV, which conformed to the characteristics of late diagnosis of BTCs.
Then, SPSS 19.0 software was used to analyze the conditions of all patients by the chi-squared test. It is shown in Table S5 that Hb (P<0.01), RBC (P<0.01), DBIL (P<0.01), and CA19-9 (P<0.01) were obviously different between the benign group and the malignant group with statistical significance, suggesting that these four clinical laboratory test indicators had clinical significance in the identification of benign and malignant biliary diseases. In the malignant group, HB and RBA were decreased in 26 of 75 samples, as RBC did the same. However, in the benign group, HB only decreased in 1 sample and RBC decreased in 2 samples. We inferred that HB and RBC may be more readily decreased in patients with BTCs compared with those with BBD. In the 75 samples in the malignant group, DBIL was increased in 45 samples, and CA19-9 was increased in 43 samples; in the benign group, there was an increase in DBIL in 7 samples and CA19-9 in 3 samples, which indicated that DBIL and CA19-9 were more prone to increase in BTCs patients than in BBD patients. The other indicators (P>0.05) showed no statistically significant differences between the benign and malignant groups.
The Comparative Sequencing of the Malignant, Benign, and Control Groups
A total of 163 serum samples from Tianjin Medical University Cancer Hospital were divided into three groups, including the malignant group (n=75), the benign group (n=20) and the control group (n=68), according to the BTCs patients, BBD patients, and healthy patients, respectively. Then, high-throughput sequencing was performed between each group by low-density chips. As is shown in Figure 1, the expression of some miRNAs in BTCs was upregulated or downregulated in BTCs compared with the control group. Compared with the control group, the malignant group and the benign group had more miRNAs with significant expression changes. When the benign group was compared with the malignant group, there were fewer miRNAs that displayed significant changes in expression. According to the criterion of fold change (FC) greater than 2, 13 miRNAs including miR-10a, miR-21, miR-23a, miR-106a, miR-130a, miR-135b, miR-143, miR-145, miR-200c, miR-214, miR-221, miR-483, and miR-627 were selected for preliminary screening from these miRNAs with significant expression changes.
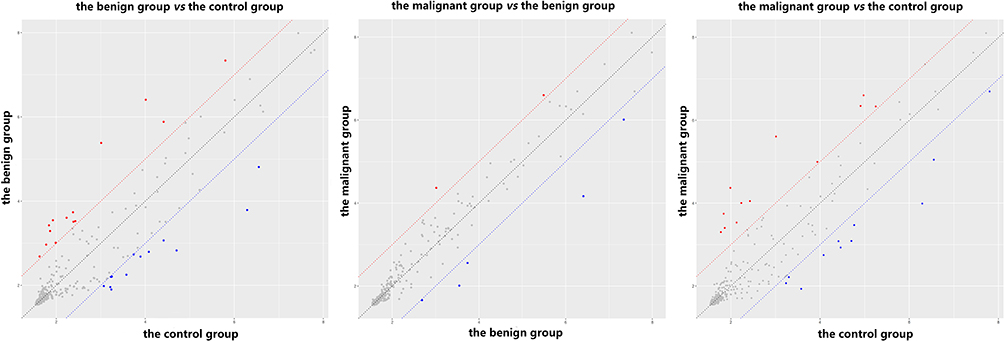 |
Figure 1 Low-density sequencing of the benign group vs the control group, the malignant group vs the benign group, and the malignant group vs the control group. The benign group and the malignant group displayed more miRNAs with significant expression changes than did that of the control group. |
The Preliminary Screening Results of the Above 13 miRNAs
Next, we randomly selected ten serum samples each from the malignant group, the benign group and the control group. The serial numbers were recorded, and the RNA was extracted for qRT-PCR. We analyzed the relative level of the 13 selected miRNAs in each group. In Figure 2, according to the mean and standard deviation, in the malignant group, the expression of miR-10a, miR-21, miR-135b, miR-143, miR-200c, miR-221, miR-214, and miR-627 was upregulated, whereas the expression of miR-145 was downregulated. The expression of miR-23a, miR-130a, and miR-483 were only up-regulated in the benign group. Expression changes in miR-106a were not visible.
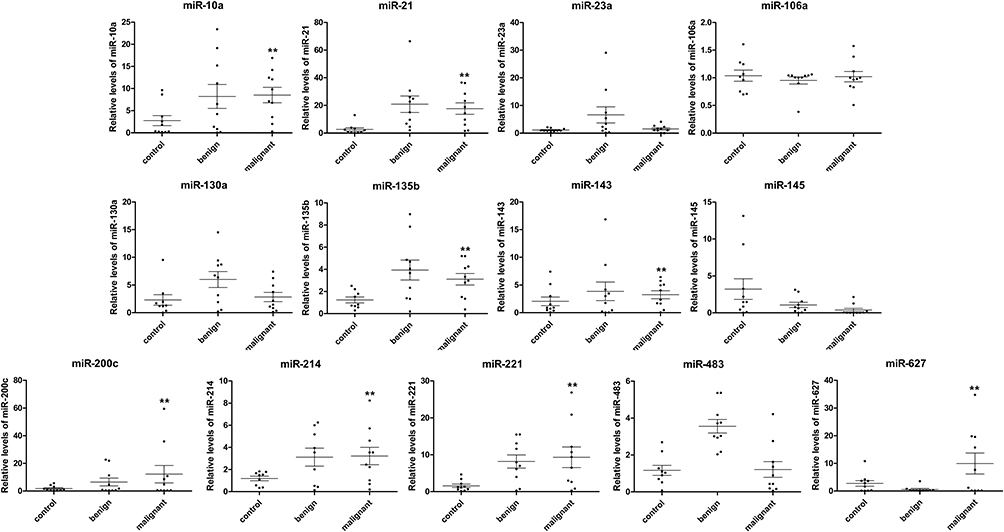 |
Figure 2 The relative changes of thirteen miRNAs in the preliminary screening test. The expression of miR-10a, miR-21, miR-135b, miR-143, miR-200c, miR-221, miR-214, and miR-627 was upregulated in the malignant group, however, the expression of miR-145 was downregulated. **P < 0.01. |
Then, the FC of the malignant group was calculated according to the cycle threshold (CT), and a histogram was plotted. As shown in Figure 3A, in the preliminary screening test, the changes in miR-21, miR-200c, miR-627, miR-221, miR-10a, miR-143, miR-214, miR-135b, and miR-130a expression had diagnostic significance. Table S6 showed that there were noteworthy differences with statistical significant in miR-10a in the malignant group vs the control group, miR-21, miR-135b, and miR-214 in the malignant group vs the control group as well as the benign group vs the control group, miR-221 in the malignant group vs the benign group and the malignant group vs the control group, miR-483 in the malignant group vs the benign group and the benign group vs the control group, and miR-627 in the malignant group vs the benign group. Based on the above results and references,24–26 miR-10a, miR-21, miR-135b, miR-221, miR-214, and miR-483, which were upregulated and had statistical significance, were finally selected for subsequent research.
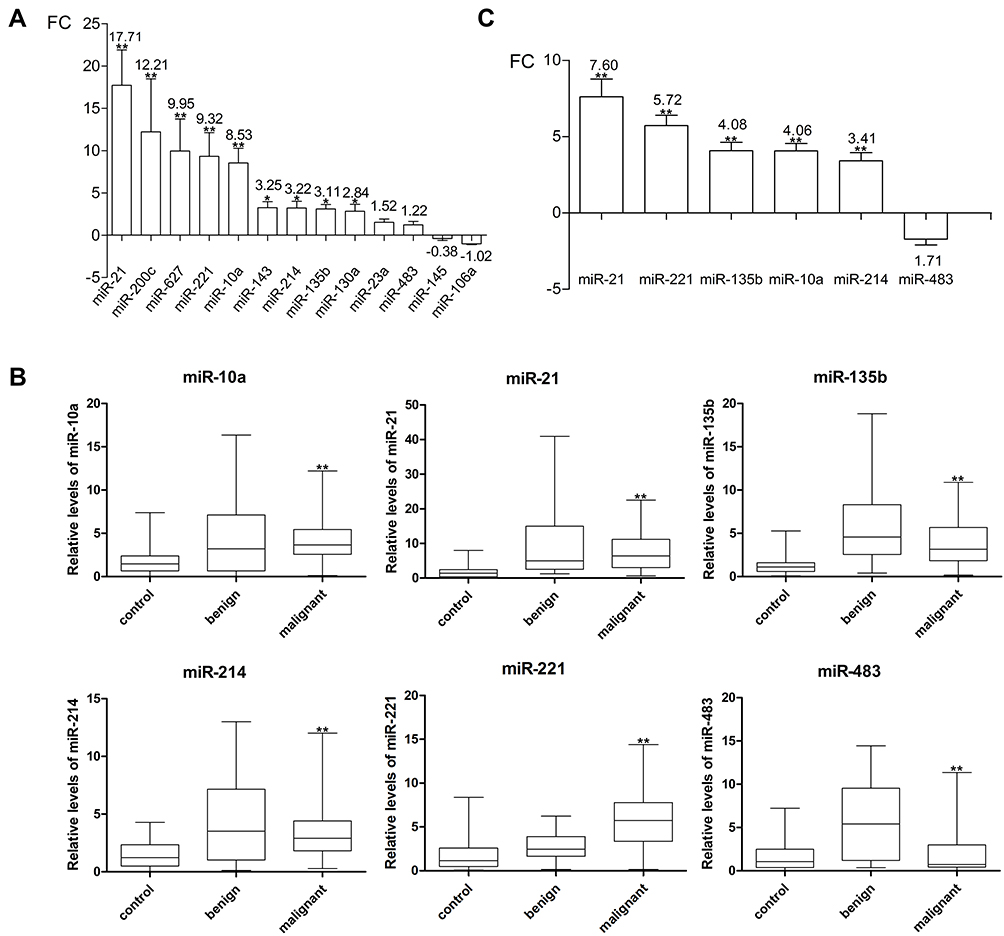 |
Figure 3 (A) FC changes of thirteen miRNAs in BTCs. The changes of miR-21, miR-200c, miR-627, miR-221, miR-10a, miR-143, miR-214, miR-135b, and miR-130a had diagnostic significance in the preliminary screening test. (B) The relative changes of six miRNAs in the verification test. The expression levels of miR-10a, miR-21, miR-135b, miR-221 and miR-214 in the malignant group were consistent with the change trend in the preliminary screening test. (C) FC changes of six miRNAs in the verification test. The expression of miR-483 was remarkably increased in the benign group and slightly downregulated in the malignant group compared to the control group. **P < 0.01; *P < 0.05. |
The Verification Test Results of the Selected 6 miRNAs
We expanded the sample size of the 6 miRNAs that were selected in the preliminary test for the verification test by qRT-PCR. Twenty samples were added to the malignant group and the control group, while ten samples were added to the benign group due to the limited number of collected samples. Then, the verification test data were processed together with that of the preliminary screening test, and a histogram was drawn according to the FC. As shown in Figure 3B, the expression levels of miR-10a, miR-21, miR-135b, miR-221 and miR-214 were upregulated in the malignant group vs the control group, which was consistent with the changing trend in the preliminary screening test. However, the expression of miR-483 was remarkably increased in the benign group and not significantly changed or even slightly downregulated in the malignant group (Figure 3C and Table S7).
To further explore the diagnostic value of the above 5 miRNAs, SPSS 19.0 software was used to draw the receiver operating characteristic (ROC) curve for statistical analysis (Figure 4A). The area under the curve (AUC) of the 5 miRNAs was greater than 0.5, indicating their diagnostic significance. As shown in Table S8, miR-21 and miR-221 (AUC ≥ 0.7) have more accuracy and diagnostic significance. In addition, miR-10a, miR-21, miR-135b, miR-214, and miR-221 (P ≤ 0.01) showed distinct differences, which were statistically significant in the diagnosis of BTCs.
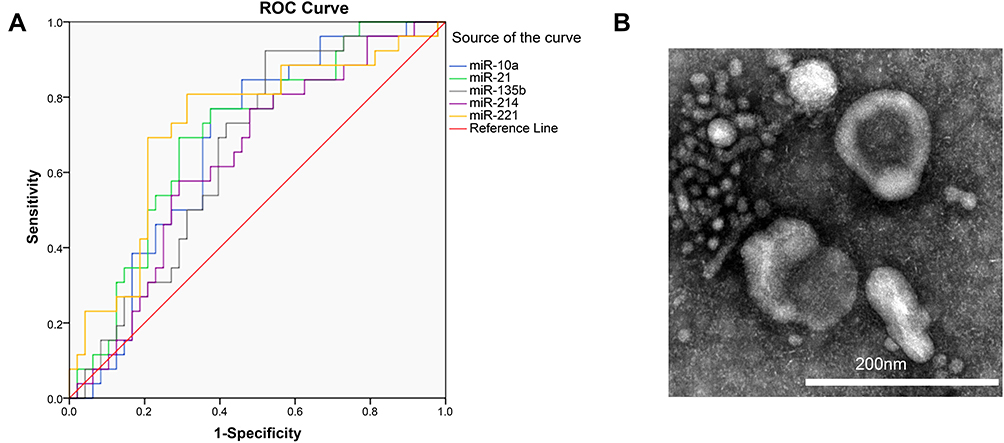 |
Figure 4 (A) The receiver operating characteristic (ROC) curve of five miRNAs. (B) Electron-microscope scanning of isolated exosomes from the serum of BTCs patients. |
miR-135b and miR-214 Expression is Enriched in Serum Exosomes
To determine whether these miRNAs were derived from serum exosomes of patients, we isolated serum exosomes with the RiboTM Exosome Isolation Reagent and randomly selected miR-135b as well as miR-214 for verification. Figure 4B shows a picture of the isolated serum under a nanoscale electron microscope, which suggested that the serum contained exosomes to ensure the follow-up experiments. The abundance of miR-135b and miR-214 in exosomes was detected, respectively, by qRT-PCR. As shown in Figure 5, exosome expression of miR-135b accounted for approximately 90.12%, 87.66% and 94.61% of total expression, while exosomes expression of miR-214 accounted for approximately 89.02%, 90.19% and 90.17% of total expression, which suggested that the majority of miR-135b and miR-214 expression was derived from serum exosomes.
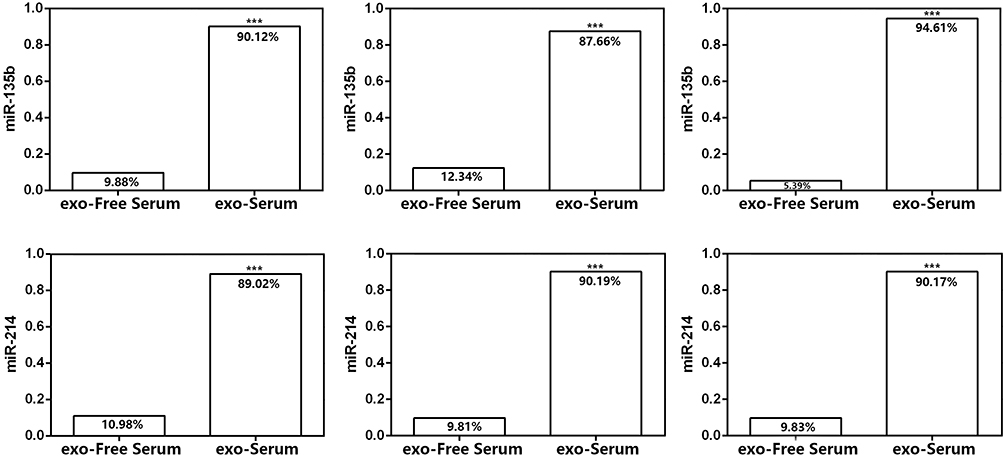 |
Figure 5 The relative abundance of miR-135b and miR-214 in serum exosomes from three samples. Most of miR-135b and miR-214 expression was derived from serum exosomes. ***P < 0.001. |
Discussion
BTCs, whose main predisposing factor is chronic inflammation, are often accompanied by cholecystitis and gallstones, and the pathological type is mostly adenocarcinoma.6,27 When BTCs are diagnosed at an early stage, a significant therapeutic effect can be achieved through surgery.28 Unfortunately, the early diagnosis of BTCs remains a daunting challenge because the vast majority of patients are diagnosed at an advanced stage with nonresectable cancer.29 In addition, patients with BTCs are predisposed to relapse after operation, leading to poor prognosis.30 We should focus on finding more sensitive and specific tumor biomarkers to achieve early diagnosis of BTCs and provide better treatment options for patients. In the present study, it was found that compared with BBD, BTCs showed no statistically significant difference (P > 0.05) by many clinical laboratory test indicators. RBC, HB, DBIL, and CA19-9 in the benign group and the malignant group were significantly different (P < 0.01), so these parameters can be combined for the identification of BTCs and BBD based on the determined biliary tract diseases. Currently, CEA and CA19-9 are commonly used in clinical postoperative monitoring, but lack they organ specificity and early sensitivity in disease screening.31 We believe that our research may lead to a more accurate early diagnosis of BTCs the future, combined with the increasing number of in-depth studies on BTCs today.12,32
Since the discovery of the first miRNA over 20 years ago, miRNAs have been extensively studied and developed in the field of biology. MiRNAs, which are involved in the regulation of genes and the microenvironment that control important signaling pathways through three main approaches: transcription, biosynthesis, and binding.33 Dysregulation of miRNAs greatly contributes to tumorigenesis and tumor progression.34 Moreover, miRNAs have become popular candidates for the diagnosis of tumors, such as breast, pancreatic and prostate cancer, in the last decade.35–37 Multiple studies have shown that the expression of various miRNAs in BTCs has different degrees of change. For example, miR-128 and miR-409 are significantly downregulated, while miR-21 and miR-200 are obviously overexpressed.38–40 Notably, the overexpression trend of miR-21 was consistent with the results in our study. We also found that single miR-21 alone could distinguish the malignant group from the control group and the benign group from the control group but could not distinguish the malignant group from the benign group. Therefore, combining this marker with classic tumor markers, such as CA19-9, in serum could provide more specific information to diagnose BTCs. This strategy has been reported by other researchers, and this is where we plan to focus our efforts.41
In this study, miRNAs with significant changes in expression were screened by low-density chips. We performed a preliminary screening test and a verification test of those miRNAs by qRT-PCR. Finally, it was found that miR-10a, miR-21, miR-135b, miR-221, and miR-214 were upregulated in BTCs, and they were enriched in the serum exosomes of patients. MiR-221 showed significant differences between the malignant group and the benign group (P<0.01) and the malignant group and the control group (P<0.01), which suggests that miR-221 could be used as a biomarker for the early diagnosis of BTCs. MiR-10a, miR-21, miR-135b, and miR-214 expression in the malignant group and the benign group were compared with that in the control group (P<0.01), showing statistically significant differences, suggesting that they can function as diagnostic markers for BBD and BTCs. Examining the serum exosomes of BTCs patients, which contain miRNAs, may also be a method of noninvasive early diagnosis. In fact, a single biomarker could not accurately reflect the specificity of the disease, and the combined detection strategy may improve the sensitivity and specificity of diagnosis and prognosis. We hypothesized that the combined detection of miR-221 and CA19-9, which have early diagnosis significance in BTCs, can be used to achieve more accurate diagnoses, and this may be verified in the follow-up studies. In the future clinical diagnosis, we will try to use this strategy for further verification to obtain more accurate clinical data. Certainly, there are some limitations in our study. For example, we did not compare the diagnostic effects of the selected miRNAs in different BTCs sub-type. This is also the point worth paying attention to in our future research.
Abbreviations
BTCs, biliary tract cancers; miRNA, microRNA; qPCR, real-time quantitative PCR; GBC, cancers of the gallbladder; IHBDC, intrahepatic bile ducts; EHBDC, extrahepatic bile ducts; AVC, ampulla of Vater; BBD, benign biliary disease; CEA, carcinoembryonic antigen; CA19-9, carbohydrate 19-9; ERCP, endoscopic retrograde cholangiopancreatography; PTCD, percutaneous transhepatic cholangiography drainage; ROC curve, receiver operating characteristic curve; BDC, bile ducts cancer.
Data Sharing Statement
We follow the rules of the journal that all datasets on which the conclusions of this paper depend could be available to readers.
Ethical Approval and Informed Consent
All patients in this research were informed of this study and signed consent forms. The study was approved by the ethics committee of Tianjin Medical University Cancer Hospital. All studies were conducted in accordance with the Declaration of Helsinki. There were no unethical experiments performed in this study. And the ethical approval number is Ek201712.
Author Contributions
Yueting Han, Haiyang Zhang, and Zhengyang Zhou performed most of the experiments, analyzed the data, and wrote the manuscript. Rui Liu, Dongying Liu, Ming Bai, Qian Fan, Jialu Li, Kegan Zhu, Hongli Li, and Tao Ning performed some experiments, as well as reviewed and edited the manuscript. Yi Ba and Guoguang Ying designed the experiments and edited the manuscript. Yi Ba is the guarantor of this work and, has full access to all of the data in the study, and takes responsibility for the integrity of the data and the accuracy of the data analysis. All authors contributed to data analysis, drafting or revising the article, gave final approval of the version to be published, and agree to be accountable for all aspects of the work. And all authors have agreed on this journal to which the article will be submitted.
Funding
This work was supported by grants from the National Natural Science Foundation of China (Nos. 81772629, 81602158, 81602156, 81702275, 81802363, 81702431, 81702437, 81772843) and the Demonstrative Research Platform of Clinical Evaluation Technology for New Anticancer Drugs (No. 2018ZX09201015). This work was also supported by the Tianjin Science Foundation (Nos. 18JCQNJC81900, 18JCYBJC92000, 18JCYBJC25400, 16PTSYJC00170, 18JCYBJC92900) and the Science & Technology Development Fund of the Tianjin Education Commission for Higher Education (2018KJ046, 2017KJ227). The funders had no role in the study design, the data collection and analysis, the interpretation of the data, the writing of the report, and the decision to submit this article for publication.
Disclosure
Yueting Han, Haiyang Zhang, and Zhengyang Zhou are co-first authors for this study. The authors declare that there is no conflict of interest regarding the publication of this article, and all of the authors listed have approved the manuscript and consented for publication.
References
1. Jackson SS, Van Dyke AL, Zhu B, et al. Anthropometric risk factors for cancers of the biliary tract in the biliary tract cancers pooling project. Cancer Res. 2019;79(15):3973–3982. doi:10.1158/0008-5472.CAN-19-0459
2. Mhatre S, Wang Z, Nagrani R, et al. Common genetic variation and risk of gallbladder cancer in India: a case-control genome-wide association study. Lancet Oncol. 2017;18(4):535–544. doi:10.1016/S1470-2045(17)30167-5
3. Marcano-Bonilla L, Mohamed EA, Mounajjed T, Roberts LR. Biliary tract cancers: epidemiology, molecular pathogenesis and genetic risk associations. Chin Clin Oncol. 2016;5(5):61. doi:10.21037/cco.2016.10.09
4. Hsing AW, Gao YT, Han TQ, et al. Gallstones and the risk of biliary tract cancer: a population-based study in China. Br J Cancer. 2007;97(11):1577–1582. doi:10.1038/sj.bjc.6604047
5. Nelson SM, Gao YT, Nogueira LM, et al. Diet and biliary tract cancer risk in Shanghai, China. PLoS One. 2017;12(3):e0173935. doi:10.1371/journal.pone.0173935
6. Razumilava N, Gores GJ. Cholangiocarcinoma. Lancet. 2014;383(9935):2168–2179. doi:10.1016/S0140-6736(13)61903-0
7. Bulajic M, Maisonneuve P, Schneider-Brachert W, et al. Helicobacter pylori and the risk of benign and malignant biliary tract disease. Cancer. 2002;95(9):1946–1953. doi:10.1002/cncr.10893
8. Bridgewater JA, Goodman KA, Kalyan A, Mulcahy MF. Biliary tract cancer: epidemiology, radiotherapy, and molecular profiling. Am Soc Clin Oncol Educ Book. 2016;35(36):e194–e203. doi:10.1200/EDBK_160831
9. Woo SM. [Chemotherapy for Biliary Tract Cancer]. Taehan Sohwagi Hakhoe Chi. 2017;69:172–176. doi:10.4166/kjg.2017.69.3.172.Korean.
10. Sasaki T, Isayama H, Nakai Y, Koike K. Current status of chemotherapy for the treatment of advanced biliary tract cancer. Korean J Intern Med. 2013;28(5):515–524. doi:10.3904/kjim.2013.28.5.515
11. Valle JW, Lamarca A, Goyal L, Barriuso J, Zhu AX. New horizons for precision medicine in biliary tract cancers. Cancer Discov. 2017;7(9):943–962. doi:10.1158/2159-8290.CD-17-0245
12. Massa A, Varamo C, Vita F, et al. Evolution of the experimental models of cholangiocarcinoma. Cancers. 2020;12(8):2308. doi:10.3390/cancers12082308
13. Ince AT, Yildiz K, Baysal B, et al. Roles of serum and biliary CEA, CA19-9, VEGFR3, and TAC in differentiating between malignant and benign biliary obstructions. Turk J Gastroenterol. 2014;25(2):162–169. doi:10.5152/tjg.2014.6056
14. Rizzo A, Ricci AD, Tavolari S, Brandi G. Circulating tumor DNA in biliary tract cancer: current evidence and future perspectives. Cancer Genomics Proteomics. 2020;17(5):441–452. doi:10.21873/cgp.20203
15. Qin XL, Wang ZR, Shi JS, Lu M, Wang L, He QR. Utility of serum CA19-9 in diagnosis of cholangiocarcinoma: in comparison with CEA. World J Gastroenterol. 2004;10(3):427–432. doi:10.3748/wjg.v10.i3.427
16. Hennedige TP, Neo WT, Venkatesh SK. Imaging of malignancies of the biliary tract- an update. Cancer Imaging. 2014;14:14. doi:10.1186/1470-7330-14-14
17. Parekh PJ, Majithia R, Sikka SK, Baron TH. The “Scope” of Post-ERCP Pancreatitis. Mayo Clin Proc. 2017;92(3):434–448. doi:10.1016/j.mayocp.2016.10.028
18. Talukdar R. Complications of ERCP. Best Pract Res Clin Gastroenterol. 2016;30(5):793–805. doi:10.1016/j.bpg.2016.10.007
19. Berindan-Neagoe I, Monroig Pdel C, Pasculli B, Calin GA. MicroRNAome genome: a treasure for cancer diagnosis and therapy. CA Cancer J Clin. 2014;64(5):311–336. doi:10.3322/caac.21244
20. Cheng G. Circulating miRNAs: roles in cancer diagnosis, prognosis and therapy. Adv Drug Deliv Rev. 2015;81:75–93. doi:10.1016/j.addr.2014.09.001
21. Kanwal R, Plaga AR, Liu X, Shukla GC, Gupta S. MicroRNAs in prostate cancer: functional role as biomarkers. Cancer Lett. 2017;407:9–20. doi:10.1016/j.canlet.2017.08.011
22. McGuire A, Brown JA, Kerin MJ. Metastatic breast cancer: the potential of miRNA for diagnosis and treatment monitoring. Cancer Metastasis Rev. 2015;34(1):145–155. doi:10.1007/s10555-015-9551-7
23. Corbin LJ, Kranis A, Blott SC, et al. The utility of low-density genotyping for imputation in the Thoroughbred horse. Genet Sel Evol. 2014;46(1):9. doi:10.1186/1297-9686-46-9
24. Letelier P, Riquelme I, Hernandez AH, Guzman N, Farias JG, Roa JC. Circulating MicroRNAs as biomarkers in biliary tract cancers. Int J Mol Sci. 2016;17(5):791. doi:10.3390/ijms17050791
25. Piontek K, Selaru FM. MicroRNAs in the biology and diagnosis of cholangiocarcinoma. Semin Liver Dis. 2015;35:55–62. doi:10.1055/s-0034-1397349
26. Li Z, Shen J, Chan MT, Wu WK. The role of microRNAs in intrahepatic cholangiocarcinoma. J Cell Mol Med. 2017;21:177–184. doi:10.1111/jcmm.12951
27. Duffy AG, Makarova-Rusher OV, Greten TF. The case for immune-based approaches in biliary tract carcinoma. Hepatology (Baltimore, Md). 2016;64(5):1785–1791. doi:10.1002/hep.28635
28. Rizvi S, Khan SA, Hallemeier CL, Kelley RK, Gores GJ. Cholangiocarcinoma - evolving concepts and therapeutic strategies. Nat Rev Clin Oncol. 2018;15(2):95–111. doi:10.1038/nrclinonc.2017.157
29. Lamarca A, Barriuso J, McNamara MG, Valle JW. Biliary tract cancer: state of the art and potential role of DNA damage repair. Cancer Treat Rev. 2018;70:168–177. doi:10.1016/j.ctrv.2018.09.002
30. Valle J, Wasan H, Palmer DH, et al. Cisplatin plus gemcitabine versus gemcitabine for biliary tract cancer. N Engl J Med. 2010;362(14):1273–1281. doi:10.1056/NEJMoa0908721
31. Wen H, Yoo SS, Kang J, et al. A new NMR-based metabolomics approach for the diagnosis of biliary tract cancer. J Hepatol. 2010;52(2):228–233. doi:10.1016/j.jhep.2009.11.002
32. Ofoeyeno N, Ekpenyong E, Braconi C. Pathogenetic role and clinical implications of regulatory RNAs in biliary tract cancer. Cancers. 2020;13(1):12. doi:10.3390/cancers13010012
33. Rasnic R, Linial N, Linial M. Enhancing identification of cancer types via lowly-expressed microRNAs. Nucleic Acids Res. 2017;45(9):5048–5060. doi:10.1093/nar/gkx210
34. Di Leva G, Garofalo M, Croce CM. MicroRNAs in cancer. Annu Rev Pathol. 2014;9(1):287–314. doi:10.1146/annurev-pathol-012513-104715
35. Nassar FJ, Nasr R, Talhouk R. MicroRNAs as biomarkers for early breast cancer diagnosis, prognosis and therapy prediction. Pharmacol Ther. 2017;172:34–49. doi:10.1016/j.pharmthera.2016.11.012
36. Kojima M, Sudo H, Kawauchi J, et al. MicroRNA markers for the diagnosis of pancreatic and biliary-tract cancers. PLoS One. 2015;10(2):e0118220. doi:10.1371/journal.pone.0118220
37. Fabris L, Ceder Y, Chinnaiyan AM, et al. The potential of MicroRNAs as prostate cancer biomarkers. Eur Urol. 2016;70(2):312–322. doi:10.1016/j.eururo.2015.12.054
38. Kim K, Yoo D, Lee HS, et al. Identification of potential biomarkers for diagnosis of pancreatic and biliary tract cancers by sequencing of serum microRNAs. BMC Med Genomics. 2019;12(1):62. doi:10.1186/s12920-019-0521-8
39. Liu CH, Huang Q, Jin ZY, et al. Circulating microRNA-21 as a prognostic, biological marker in cholangiocarcinoma. J Cancer Res Ther. 2018;14(1):220–225. doi:10.4103/0973-1482.193125
40. Kitdumrongthum S, Metheetrairut C, Charoensawan V, et al. Dysregulated microRNA expression profiles in cholangiocarcinoma cell-derived exosomes. Life Sci. 2018;210:65–75. doi:10.1016/j.lfs.2018.08.058
41. Kishimoto T, Eguchi H, Nagano H, et al. Plasma miR-21 is a novel diagnostic biomarker for biliary tract cancer. Cancer Sci. 2013;104(12):1626–1631. doi:10.1111/cas.12300
 © 2021 The Author(s). This work is published and licensed by Dove Medical Press Limited. The full terms of this license are available at https://www.dovepress.com/terms.php and incorporate the Creative Commons Attribution - Non Commercial (unported, v3.0) License.
By accessing the work you hereby accept the Terms. Non-commercial uses of the work are permitted without any further permission from Dove Medical Press Limited, provided the work is properly attributed. For permission for commercial use of this work, please see paragraphs 4.2 and 5 of our Terms.
© 2021 The Author(s). This work is published and licensed by Dove Medical Press Limited. The full terms of this license are available at https://www.dovepress.com/terms.php and incorporate the Creative Commons Attribution - Non Commercial (unported, v3.0) License.
By accessing the work you hereby accept the Terms. Non-commercial uses of the work are permitted without any further permission from Dove Medical Press Limited, provided the work is properly attributed. For permission for commercial use of this work, please see paragraphs 4.2 and 5 of our Terms.