")
Back to Journals » Journal of Inflammation Research » Volume 15
Serum Levels of IL-1 RA Increase with Obesity and Type 2 Diabetes in Relation to Adipose Tissue Dysfunction and are Reduced After Bariatric Surgery in Parallel to Adiposity
Authors Frühbeck G , Catalán V , Ramírez B, Valentí V, Becerril S, Rodríguez A , Moncada R, Baixauli J , Silva C, Escalada J, Gómez-Ambrosi J
Received 15 December 2021
Accepted for publication 15 February 2022
Published 24 February 2022 Volume 2022:15 Pages 1331—1345
DOI https://doi.org/10.2147/JIR.S354095
Checked for plagiarism Yes
Review by Single anonymous peer review
Peer reviewer comments 2
Editor who approved publication: Professor Ning Quan
Gema Frühbeck,1– 4 Victoria Catalán,1– 3 Beatriz Ramírez,1– 3 Víctor Valentí,2,3,5 Sara Becerril,1– 3 Amaia Rodríguez,1– 3 Rafael Moncada,2,3,6 Jorge Baixauli,5 Camilo Silva,2– 4 Javier Escalada,2,4 Javier Gómez-Ambrosi1– 3
1Metabolic Research Laboratory, Clínica Universidad de Navarra, Pamplona, Spain; 2Centro de Investigación Biomédica en Red-Fisiopatología de la Obesidad y Nutrición (CIBEROBN), Instituto de Salud Carlos III, Pamplona, Spain; 3Obesity and Adipobiology Group, Instituto de Investigación Sanitaria de Navarra (IDISNA), Pamplona, Spain; 4Department of Endocrinology & Nutrition, Clínica Universidad de Navarra, Pamplona, Spain; 5Department of Surgery, Clínica Universidad de Navarra, Pamplona, Spain; 6Department of Anesthesia, Clínica Universidad de Navarra, Pamplona, Spain
Correspondence: Javier Gómez-Ambrosi, Metabolic Research Laboratory, Clínica Universidad de Navarra, Irunlarrea 1, Pamplona, 31008, Spain, Tel +34 948 425600 (ext. 806567), Email [email protected]
Background: Excess adiposity leads to a dysfunctional adipose tissue that contributes to the development of obesity-associated comorbidities such as type 2 diabetes (T2D). Interleukin-1 receptor antagonist (IL-1RA) is a naturally occurring antagonist of the IL-1 receptor with anti-inflammatory properties. The aim of the present study was to compare the circulating concentrations of IL-1RA and its mRNA expression in visceral adipose tissue (VAT) in subjects with normal weight (NW), obesity with normoglycemia (OB-NG), or obesity with impaired glucose tolerance or T2D (OB-IGT&T2D) and to analyze the effect of changes in body fat percentage (BF%) on IL-1RA levels.
Methods: Serum concentrations of IL-1RA were measured in 156 volunteers. Expression of IL1RN mRNA in VAT obtained from 36 individuals was determined. In addition, the concentrations of IL-1RA were measured before and after weight gain as well as weight loss following a dietetic program or Roux-en-Y gastric bypass (RYGB).
Results: Serum levels of IL-1RA were significantly increased in individuals with obesity, being further increased in the OB-IGT&T2D group (NW 440 ± 316, OB-NG 899 ± 562, OB-IGT&T2D 1265 ± 739 pg/mL; P< 0.001) and associated with markers of inflammation and fatty liver. IL1RN mRNA expression in VAT was significantly increased in the OB-IGT&T2D group and correlated in the global cohort with the mRNA expression of SPP1, CCL2, CD68, and MMP9. Levels of IL-1RA were not modified after modest changes in BF%, but RYGB-induced weight loss significantly decreased IL-1RA concentrations from 1233 ± 1009 to 660 ± 538 pg/mL (P< 0.001).
Conclusion: Serum IL-1RA concentrations are increased in patients with obesity being further elevated in obesity-associated IGT and T2D in association with markers of adipose tissue dysfunction. The mRNA expression of IL1RN is markedly increased in VAT of subjects with obesity and T2D in relation with genes involved in macrophage recruitment, inflammation and matrix remodeling. Serum IL-1RA concentrations are reduced when a notable amount of BF% is loss. Measurement of IL-1RA is an excellent biomarker of adipose tissue dysfunction in obesity-associated metabolic alterations.
Keywords: IL-1RA, obesity, type 2 diabetes, inflammation, adipose tissue, adipokines
Introduction
The prevalence of obesity has increased alarmingly in the entire World threatening the increase in life expectancy achieved in the last decades.1 Obesity favors the development of cardiometabolic alterations such as type 2 diabetes (T2D), dyslipidemia and non-alcoholic fatty liver disease (NAFLD), among other metabolic derangements, leading to an increase in morbidity and mortality in relation to excess adiposity.2,3
The adipose tissue represents a highly dynamic and active endocrine organ as opposed to a passive depot for the accumulation of energy in the form of fat.4,5 This multifunctional nature is based on the ability of adipocytes and other resident cells to secrete a wide variety of bioactive molecules, collectively termed as adipokines, which are involved in the regulation of many physiological processes such as appetite, inflammation, cardiovascular homeostasis as well as glucose and lipid metabolism.4,6 Most adipocyte-derived factors have been proven to be dysregulated in pathophysiological alterations accompanied by changes in the amount of adipose tissue, thus providing evidence for their involvement in the development of obesity and associated metabolic derangements.4,7,8
Interleukin-1 receptor antagonist (IL-1RA) is a naturally occurring antagonist of the IL-1 receptor (IL-1R) which competitively blocks the signaling of IL-1α and IL-1β.9 IL-1RA is expressed in different tissues including brain, heart, skin, colon, kidney, liver, lung, thyroid, adrenal gland, ovary, and testis, among others, as well as in immune cells.10,11 IL-1RA behaves as an acute-phase protein with its serum concentrations increasing dramatically in conditions such as sepsis, rheumatic diseases and tissue injury.12 Moreover, mice deficient in Il1rn show increased susceptibility to septic shock and higher predisposition to develop inflammatory disorders.13,14 Accordingly, recombinant IL-1RA has been used for the treatment of several autoimmune and systemic inflammatory diseases.15,16 Levels of IL-1RA are also increased in murine models and patients with obesity.17,18 Mice lacking Il1rn exhibit a lean phenotype and fatty liver, accompanied by marked lipid alterations and increased atherosclerosis.19–21 Expression and secretion of IL-1RA has also been described in adipose tissue from mice and humans,22,23 being its expression strongly induced by LPS, IL-1α and IL-1β, and interferon (IFN)-β.24 However, whether the circulating concentrations of IL-1RA or its mRNA expression levels in adipose tissue are influenced by the glycemic status in patients with obesity have not been fully elucidated.
The present study explores whether serum levels of IL-1RA are different in patients with obesity depending if they also exhibit T2D, as well as the mRNA expression levels of IL1RN in visceral adipose tissue (VAT) are affected by obesity, T2D or both. We hypothesized that serum IL-1RA concentrations will be increased in accordance to the degree of adiposity and the degree of glucose intolerance. To further validate this assumption, we assessed the effect of changes in body adiposity and glycemic status on serum IL-1RA levels.
Materials and Methods
Patient Selection and Study Design
In order to analyze the effect of obesity and T2D on IL-1RA concentrations 156 Caucasian subjects [37 normal weight (NW) and 119 with obesity (OB), 56% female] aged 48 ± 7 y (22–60 y) were recruited from healthy volunteers and patients attending the Endocrinology & Nutrition and Surgery Departments at the Clínica Universidad de Navarra, Pamplona. The inclusion criteria were: 20–60 year-old males and females, body mass index (BMI) between 18.5–24.9 kg/m2 for NW subjects and BMI ≥30.0 kg/m2 for patients with OB, absence of psychiatric pathology and written informed consent for participation in the study. The exclusion criteria were severe systemic disease not related to obesity, infectious/inflammatory diseases, liver disease other than NAFLD, cancer, or severe nephropathy, pregnancy or lactation, and people whose freedom is under legal or administrative requirement. Subjects were classified according to BMI (NW <25 kg/m2; and OB ≥30 kg/m2). From the 119 patients with obesity, 28 (24%), 41 (34%) and 50 (42%) had obesity class I, II and III, respectively. All participants were weight-stable (± 2 kg) for the previous 3 months. Patients with signs of acute inflammation or taking any drug potentially influencing insulin secretion were excluded. Glucose intolerance or T2D of subjects with obesity was of recent-onset being diagnosed at the baseline visit. Normoglycemia (OB-NG, n=75), impaired glucose tolerance (OB-IGT n=28) and T2D (OB-T2D, n=16) in patients with obesity were defined following the criteria of the American Diabetes Association25 based on both fasting plasma glucose concentrations and plasma glucose 2 h after an oral glucose tolerance test (OGTT). Due to the reduced number of patients with T2D, individuals with IGT and T2D were grouped together. In addition, a group of 20 Caucasian subjects (5 males and 15 females) aged 45 ± 16 y (range 21–75 y) was selected to investigate the effect of weight gain (WG) on circulating concentrations of IL-1RA. Participants were recruited from those who exhibited WG of at least 2.5 kg in two separate medical visits. Finally, another group of 79 Caucasian subjects (31 males and 48 females) aged 46 ± 12 y (range 18–74 y) was selected to investigate the effect of weight loss (WL). WL was achieved either by Roux-en-Y gastric bypass (RYGB, n=63) or by prescription of a hypocaloric diet (ConWL, n=16). Psychological, nutritional, and endocrine assessment was carried out as part of the preoperative protocol in order to identify potential risk factors before the surgical intervention. A thorough dietetic history and biochemical work-up was performed preoperatively in order to identify potential nutritional deficiencies, and to optimize the vitamin and mineral status before surgery. Anaesthetic and operative techniques were applied by the same bariatric team. Postoperative interventions followed the hospital bariatric unit protocol. Follow-up revisions were made at 1, 3, 6, 9 and 12 months post-surgery. Patients were prescribed oral vitamin and micronutrient supplements to compensate for their possible reduced intake and absorption. Conventional dietary treatments consisted of an individualized dietary regime prescribed by a physician in collaboration with a dietitian with planned regular follow-up visits to ensure a daily caloric deficit of 500–1000 kcal/d as estimated from the measurement of the resting energy expenditure by indirect calorimetry (Vmax29, SensorMedics Corporation, Yorba Linda, CA, USA) and multiplication by the physical activity level to find out the total energy expenditure.26 The calorimeter was calibrated on a daily basis. This dietary treatment enables a safe and steady WL supplying 54, 30 and 16% of energy requirements in the form of carbohydrates, fat, and protein, respectively. The study was conducted in accordance with the Declaration of Helsinki. The study was approved by the Clínica Universidad de Navarra’s Ethical Committee (2017.121). All participants signed the informed consent to participate in the study.
Anthropometry
The anthropometric and body composition determinations as well as the blood extraction were performed on a single day. Body weight was measured wearing a swimming suit and cap to the nearest 0.1 kg with a digital scale. Height was determined with a Holtain stadiometer (Holtain Ltd., Crymych, UK) to the nearest 0.1 cm. BMI was calculated as weight in kg divided by the square of height in meters. Blood pressure was measured at least 3 times at the right upper arm after a 5-min rest with the patient in the semi-sitting position with a sphygmomanometer. The mean of the three measurements was used in the study. All measurements were made by the same trained nurse.
Body Composition
Body density was calculated by air-displacement-plethysmography (Bod-Pod®, COSMED, Rome, Italy). Body fat percentage (BF%) was calculated from body density by means of the Siri equation.27 Visceral adiposity index (VAI) was used as surrogate marker of visceral fat function associated with cardiometabolic risk.28
Serum Biochemistry
Serum samples were collected after more than 8-h of fasting in the morning in order to reduce the potential confounding influence of hormonal rhythmicity. Serum biochemistry was analyzed as previously reported.26,27 Indirect measures of insulin resistance and insulin sensitivity were calculated by means of the homeostatic model assessment (HOMA), the quantitative insulin sensitivity check index (QUICKI), and the triglycerides and glucose (TyG) index.26,29 The AST/ALT ratio30 and the fatty liver index (FLI)31 were used as indirect indicators of hepatic steatosis and fatty liver disease. Serum lipopolysaccharide (LPS) concentrations were measured using the chromogenic assay QCL-1000 Limulus Amebocyte Lysate (50–648U Lonza, Walkersville, MD, USA) in 1:10 diluted samples by duplicate according to the manufacturer’s protocol. SAA were quantified by immunoassay (KHA0011 BioSource, Camarillo, CA, USA); intra- and inter-assay coefficients of variation were 6.1% and 7.4%, respectively. OPN was determined by ELISA (DOST00, R&D Systems, Minneapolis, MN, USA) with intra- and inter-assay coefficients of variation being 3.2% and 5.9%, respectively. Leptin and adiponectin measurement was performed by ELISA (RD191001100 and RD191023100, respectively, BioVendor, Brno, Czech Republic); intra- and inter-assay coefficients of variation were 5.9% and 5.6%, respectively, for the former, and 3.9% and 6.0%, respectively, for the latter. IL-1RA concentrations were determined by ELISA (RAF052R, BioVendor); intra- and inter-assay coefficients of variation were 7.2% and 7.4%, respectively. IL-1α (ELH-Il1a, RayBiotech, Norcross, GA, USA) and IL-1β levels (RD194559200R, BioVendor) were analyzed by ELISA.
RNA Extraction and Real-Time PCR
Samples of VAT were obtained from 36 patients undergoing either laparoscopic RYGB (n=29) or Nissen fundoplication (n=7) during the surgical procedure. The samples were immediately frozen in liquid nitrogen and stored at −80 °C. RNA isolation was performed as previously described.32 Primers and probes (Sigma-Aldrich, Madrid, Spain) were designed using the software Primer Express 2.0 (Applied Biosystems) and are described in Supplementary Table 1. The cDNA was amplified at the following conditions: 95 °C for 10 min, followed by 45 cycles of 15s at 95 °C and 1 min at 59 °C, using the TaqMan® Universal PCR Master Mix (Applied Biosystems). The primer and probe concentrations for gene amplification were 300 nmol/L and 200 nmol/L, respectively. All results were normalized to the levels of 18S rRNA (Applied Biosystems) and relative quantification was calculated using the ΔΔCt formula.33 Relative mRNA expression was expressed as fold expression over the calibrator sample (average of gene expression corresponding to the NW group). All samples were run in triplicate and the average values were calculated.
Statistical Analysis
Data are presented as mean ± SD. The program G*Power (edition 3.1.9.4) was used to determine sample size calculation. Based on previous similar studies, with a 0.9 power, a type I error probability associated of 0.05, and expecting a size effect of 0.40 in an ANOVA fixed effects analysis, we need to study at least 27 individuals per group to be able to reject the null hypothesis. Anticipating a potential loss of samples due to availability or methodological issues we decided to include at least 30 subjects per group. Normal distribution was assessed by Kolmogorov–Smirnov’s tests and homogeneity of variance was assessed using Levene’s tests. Differences in gender distribution were analyzed by χ2 analysis. Differences between groups were analyzed by ANOVA followed by Fisher’s Least Significant Difference (LSD) tests. Differences between values before and after body weight changes were analyzed by paired two-tailed Student’s t tests. Correlations between two variables were computed by Pearson’s correlation coefficients (r). The calculations were performed using the SPSS version 23 (SPSS, Chicago, IL, USA) and GraphPad 8.0 (San Diego, CA, USA). A P value lower than 0.05 was considered statistically significant.
Results
Serum IL-1RA Concentrations are Elevated in Patients with Obesity and Further Increased in Those with T2D and Correlate with Markers of Inflammation and Fatty Liver
Anthropometric and biochemical characteristics of the individuals included in the study are shown in Table 1. Patients with obesity showed insulin resistance evidenced by significantly increased insulinemia, HOMA, and TyG index, as well as reduced QUICKI, which were further altered in OB-IGT&T2D. Subjects with obesity also exhibited altered markers of inflammation such as CRP, LPS, SAA and WBC, and fatty liver such as γ-GT and FLI, which were further altered in patients with IGT or T2D (Table 1 and Figure 1). Serum concentrations of IL-1RA were significantly increased in individuals with obesity (Figure 2A), while no effect of gender were observed (males 903 ± 652, females 885 ± 640 pg/mL; P=0.861; Figure 2B). After selected only those subjects classified as with NW, we found a 19% but not statistically significant increase in serum IL-1RA in females (males 386 ± 195, females 460 ± 352 pg/mL; P=0.533). Levels of IL-1RA were further increased in the OB-IGT&T2D group (NW 440 ± 316, OB-NG 899 ± 562, OB-IGT&T2D 1265 ± 739 pg/mL; P<0.001) as depicted in Figure 2C. In a subanalysis, IL-1RA concentrations showed no differences between OB-IGT and OB-T2D groups (OB-IGT 1329 ± 814, OB-T2D 1152 ± 594 pg/mL; P=0.326). IL-1α and IL-1β levels were below the detection threshold in most of the samples (data not shown).
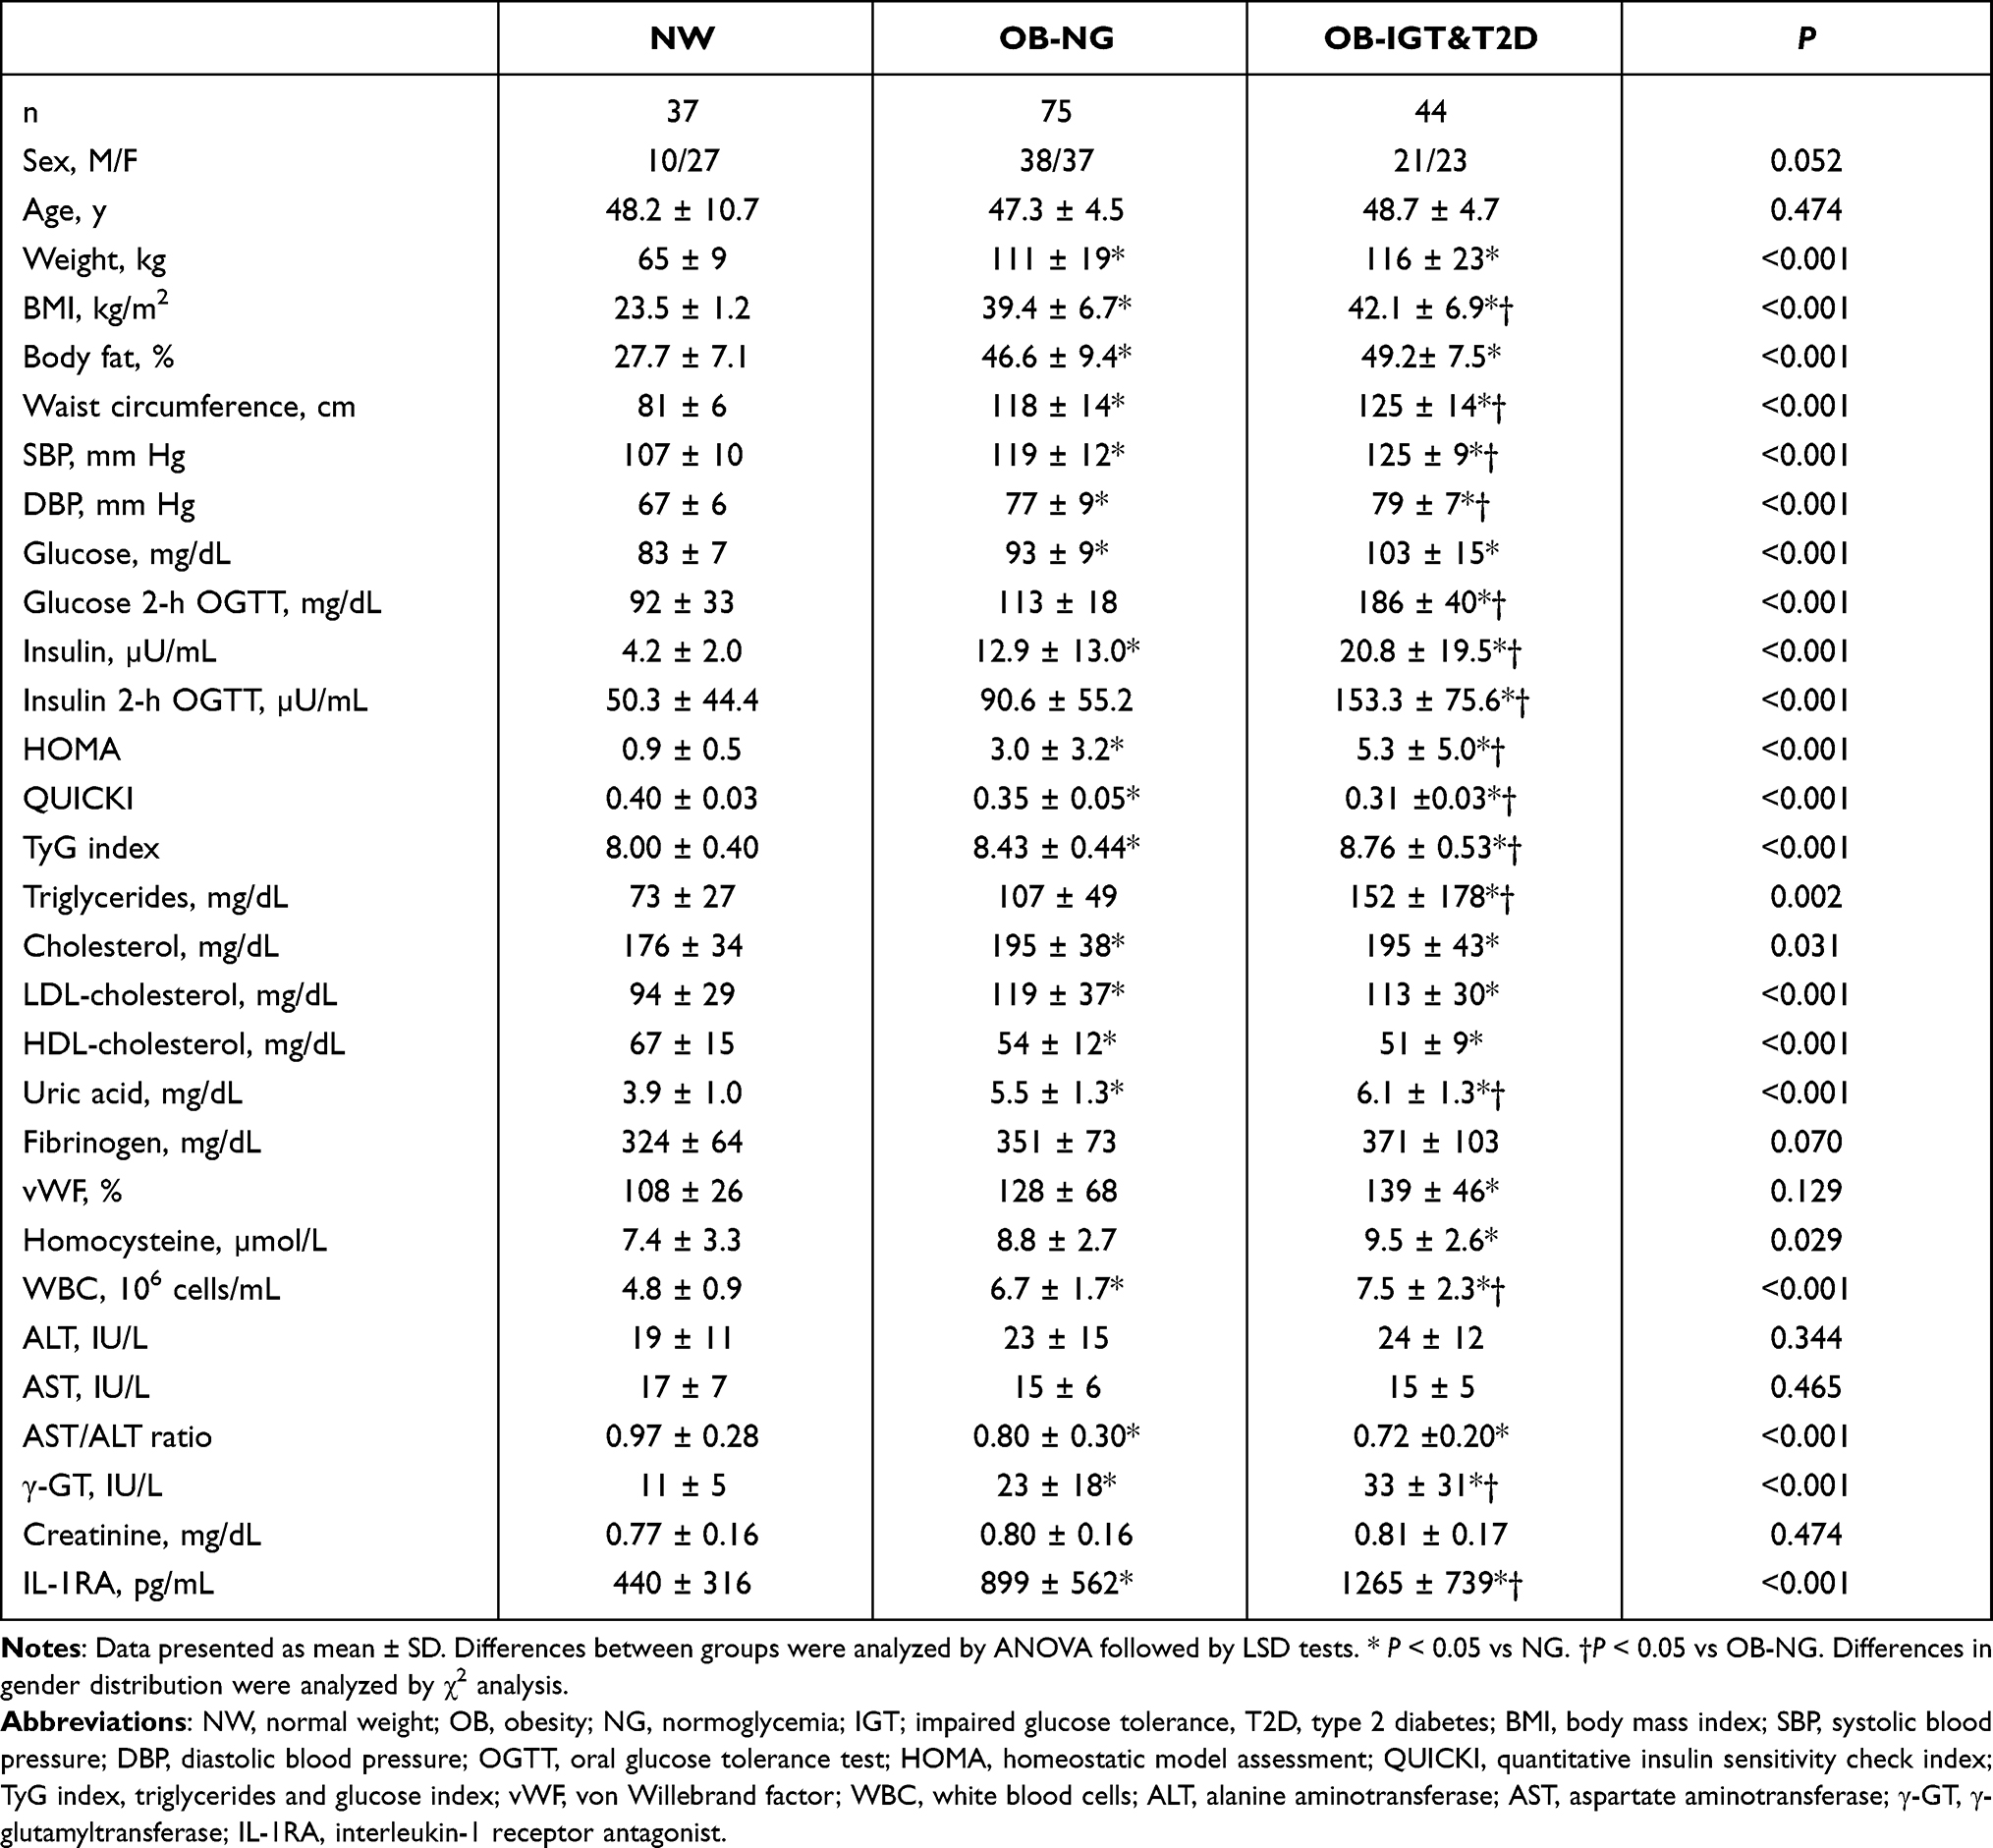 |
Table 1 Demographic and Biochemical Characteristics of the Study Population |
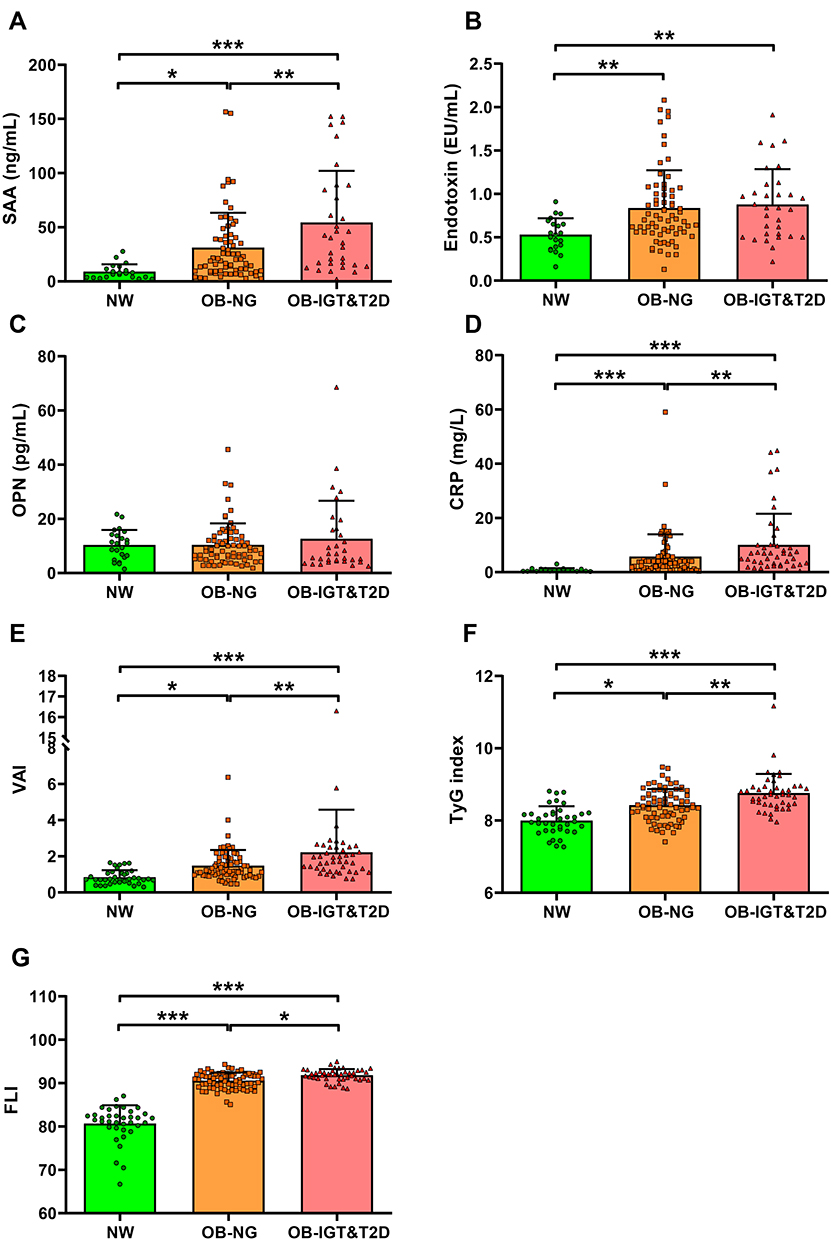 |
Figure 1 Markers of inflammation and indexes of visceral adiposity, insulin resistance and fatty liver are elevated in individuals with obesity and type 2 diabetes (T2D). Comparison of fasting serum concentrations of (A) serum amyloid A (SAA), (B) endotoxin, (C) osteopontin, (D) C-reactive protein (CRP), (E) visceral adiposity index (VAI), (F) triglycerides and glucose (TyG) index and (G) fatty liver index (FLI) in subjects with normal weight (NW), obesity and normoglycemia (OB-NG), and obesity and impaired glucose tolerance or T2D (OB-IGT&T2D). Bars represent the mean ± SD. Statistical differences between groups were analyzed by ANOVA followed by LSD tests. *P<0.05, **P<0.01 and ***P<0.001. |
 |
Figure 2 Serum concentrations of IL-1RA increases with obesity and glucose intolerance and are not altered by gender. (A) Fasting serum levels of IL-1RA in normal weight (NW) subjects and patients with obesity. (B) Effect of gender on serum IL-1RA levels. (C) Serum levels of IL-1RA in individuals with NW, obesity and normoglycemia (OB-NG), and obesity and impaired glucose tolerance or T2D (OB-IGT&T2D). Boxes represent first and third quartiles and median, with whiskers showing 10–90 percentile. Statistical differences between groups were analyzed by unpaired Student’s t test or ANOVA followed by LSD tests. ***P<0.001. |
A highly significant correlation (P<0.001 for all) was found between serum IL-1RA and BMI (r=0.51), BF% (r=0.42), waist circumference (r=0.50), insulin levels (r=0.31), HOMA (r=0.30), QUICKI (r=−0.37), HDL-cholesterol levels (r=−0.27) and uric acid (r=0.33). Furthermore, after adjusting for BF% circulating IL-1RA levels were associated with markers of inflammation such as fibrinogen (r=0.28, P<0.001), CRP (r=0.33, P<0.001), SAA (r=0.18, P=0.048), OPN (r=0.26, P=0.004), and WBC (r=0.47, P<0.001), as well as with markers of fatty liver such as ALT (r=0.16, P=0.049), γ-GT (r=0.23, P=0.004) and FLI (r=0.24, P=0.002) (Supplementary Table 2).
Association of IL-1RA Levels with Adiponectin/Leptin Ratio Suggests That It is Increased Due to the Presence of a Dysfunctional Adipose Tissue
Circulating concentrations of leptin were significantly increased in both groups with obesity without statistically significant differences between them (Figure 3A). Serum adiponectin levels were significantly decreased in the OB-NG group as compared to the NW one (P<0.001) and further decreased in the OB-IGT&T2D group (P<0.001) (Figure 3B). Accordingly, both groups with obesity exhibited lower Adpn/Lep ratio than the NW group (P<0.001), showing the OB-IGT&T2D group lower values than the OB-NG group, although no significant differences between them were found (Figure 3C). A positive correlation was found between IL-1RA and leptin (r=0.31, P<0.001; Figure 3D), while it was negatively correlated with adiponectin (r=−0.46, P<0.001; Figure 3E) and the Adpn/Lep ratio (r=−0.33, P<0.001; Figure 3F). The negative correlation of serum IL-1Ra with adiponectin was maintained after adjusting for BF% (r=−0.46, P<0.001; Supplementary Table 2). Considering only the patients with obesity, the correlations of IL-1RA were attenuated: leptin (r=0.17, P=0.064), adiponectin (r=−0.38, P<0.001) and the Adpn/Lep ratio (r=−0.23, P=0.016).
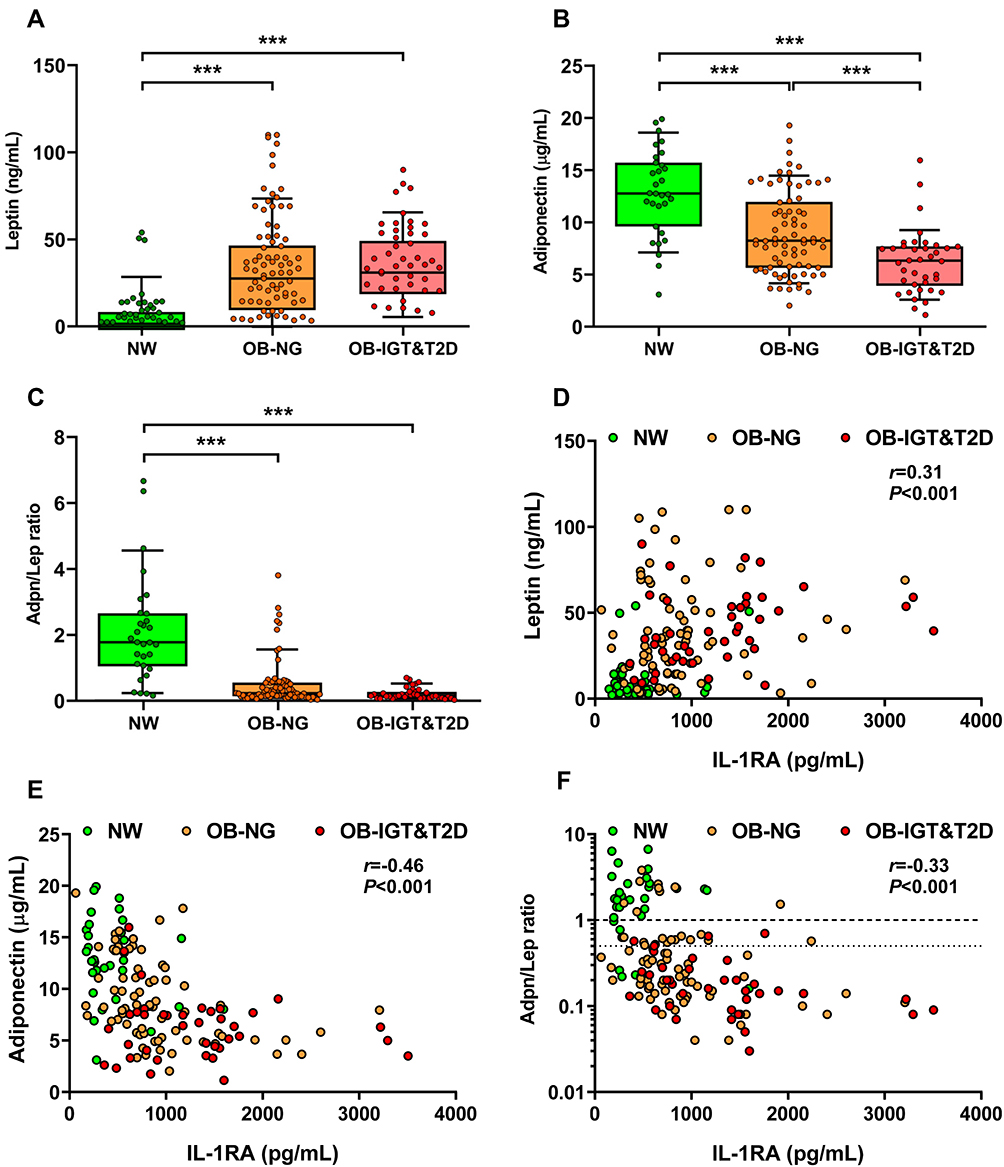 |
Figure 3 Serum IL-1RA correlates with leptin and adiponectin and with the marker of dysfunctional adipose tissue adiponectin/leptin (Adpn/Lep) ratio. Comparison of fasting serum concentrations of (A) leptin, (B) adiponectin, and (C) Adpn/Lep ratio in subjects with normal weight (NW), obesity and normoglycemia (OB-NG), and obesity and impaired glucose tolerance or T2D (OB-IGT&T2D). Bars represent the mean ± SD. Statistical differences between groups were analyzed by ANOVA followed by LSD tests. ***P<0.001. Scatter diagrams showing the correlations between the circulating concentrations of IL-1RA with the levels of (D) leptin, (E) adiponectin, and (F) the Adpn/Lep ratio. Pearson’s correlation coefficient (r) and P values are indicated. The y-axis is shown in log scale in (F) and horizontal discontinuous lines denote the Adpn/Lep ratio proposed cut-offs of 0.5 and 1.0.50,51 |
IL-1RA mRNA Expression is Increased in VAT of Patients with Obesity and T2D in Relation with Proinflammatory Markers of Macrophage Recruitment
Next, we aimed to assess the mRNA expression levels of IL1RN (the gene that codifies for IL-1RA) in the VAT of patients with obesity and normoglycemia or IGT/T2D. Both groups with obesity exhibited decreased levels of HDL, higher concentrations of CRP and leptin, and a reduced AST/ALT ratio, suggestive of fatty liver. Individuals with obesity and T2D showed higher glucose concentrations in the fasting state (P<0.05) and 2 h after an OGTT (P=0.002) than patients with obesity and normoglycemia (Supplementary Table 3). The mRNA expression of IL1RN was increased in the VAT of individuals with obesity, although the differences felt out of significance as compared to NW individuals (2.86 ± 3.84 vs 1.00 ± 1.48 a. u.; P=0.559) and further increased in patients with obesity and IGT or T2D (10.09 ± 8.17; P<0.01 vs both NW and OB-NG, Figure 4A). SPP1 (OPN), CD68 and MMP9 mRNA expression in adipose tissue showed a similar tendency to that exhibited by IL1RN expression (Supplementary Table 3). The mRNA expression of TNF and CCL2 showed around a three-fold increase in both groups of patients with obesity, but they did not reach statistical significance likely due to data variability. Expression of the angiogenesis-related VEGFA was unchanged. IL1RN mRNA expression in VAT was significantly correlated with the mRNA expression of SPP1 (r=0.67, P<0.001; Figure 4B), CCL2 (r=0.65, P<0.001; Figure 4D), CD68 (r=0.54, P=0.005; Figure 4E), and MMP9 (r=0.57, P=0.003; Figure 4F), while no correlation was observed with TNF (Figure 4C) and VEGFA (Figure 4G) mRNA expression.
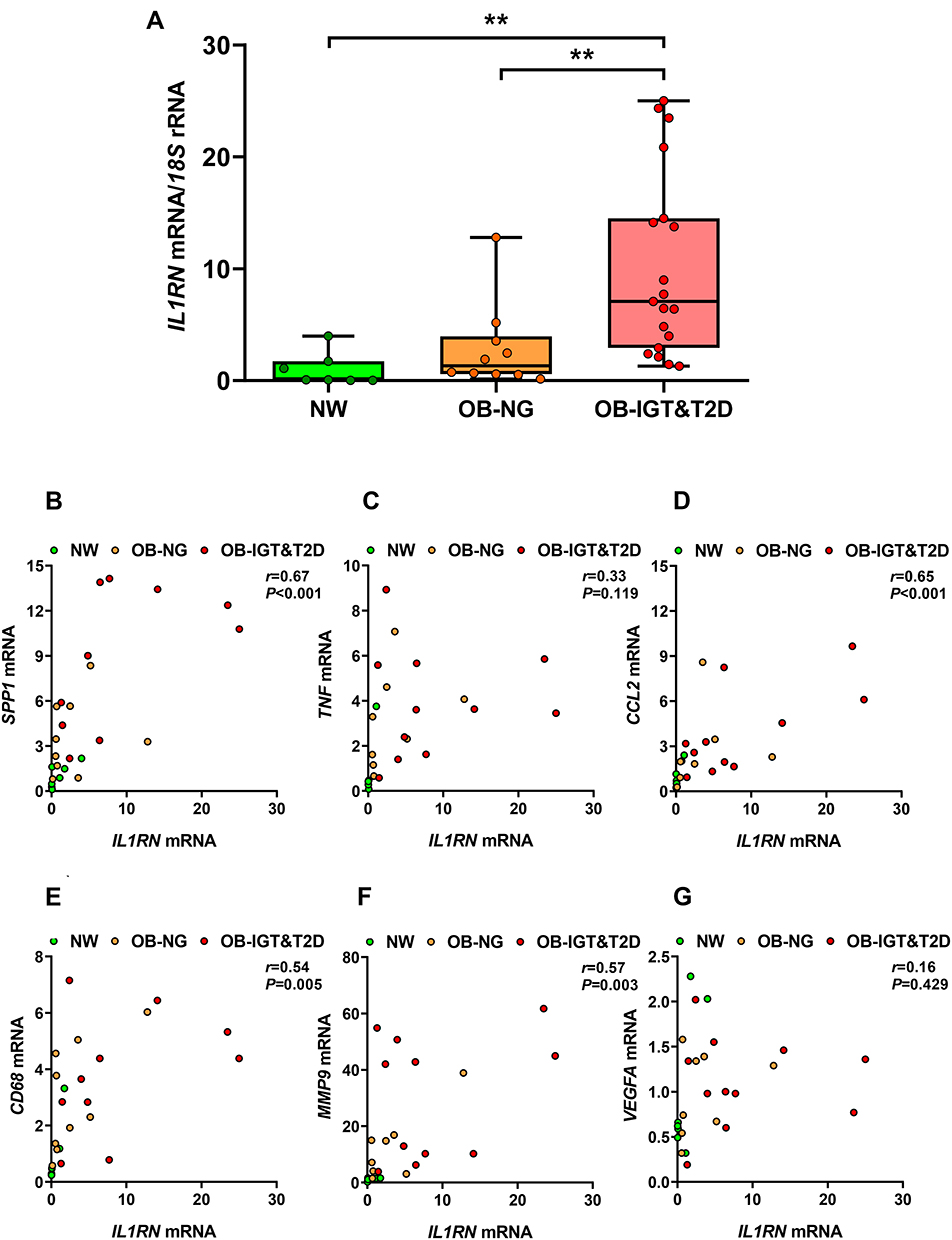 |
Figure 4 The expression of IL1RN in visceral adipose tissue (VAT) is increased in patients with obesity and impaired glucose (IGF) intolerance or type 2 diabetes (T2D). (A) Levels of IL1RN mRNA in VAT of subjects with normal weight (NW), obesity and normoglycemia (OB-NG), and obesity and IGT or T2D (OB-IGT&T2D). Bars represent the mean ± SD of the ratio between IL1RN to 18S rRNA. The expression of IL1RN in NW subjects was assumed to be 1. Differences between groups were analyzed ANOVA followed by LSD tests. **P<0.01. Scatter diagrams showing the correlations between IL1RN mRNA and the mRNA expression levels of (B) SPP1, (C) TNF, (D) CCL2, (E) CD68, (F) MMP9, and (G) VEGFA in VAT. Pearson’s correlation coefficient (r) and P values are indicated. |
IL-1RA Concentrations Decrease Following RYGB but Not After Diet-Induced WL or Slight WG
In order to study the potential alterations in IL-1RA levels following changes in body adiposity, we measured its serum concentrations after WG and WL due to either a conventional dietary treatment or bariatric surgery. After an average period of 20 months in which patients gained an average of 5.3 kg, and their BF% increased 4.2% (Supplementary Table 4), no significant changes were observed in IL-1RA levels which changed 20% from 417 ± 345 to 500 ± 691 pg/mL (P=0.647; Figure 5A). No remarkable changes in cardiometabolic variables were observed with the exception of HDL levels, that were paradoxically increased, and leptin concentrations that were significantly increased as expected (P=0.003). A marginal negative correlation between final IL-1RA and adiponectin levels was observed (r=−0.41, P=0.074).
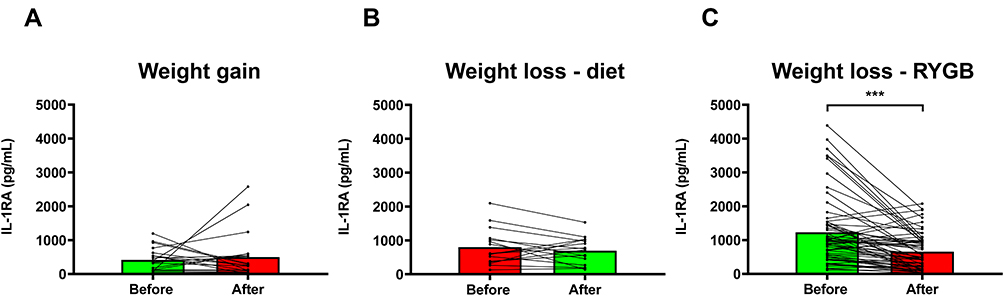 |
Figure 5 Serum IL-1RA levels are changed after bariatric surgery-induced weight loss (WL), but not after diet-induced WL or slight weight gain (WG). (A) Effect of WG on serum IL-1RA concentrations. (B) Effect of WL on serum IL-1RA levels in patients with obesity following a conventional dietary intervention. (C) Effect of WL on serum IL-1RA concentrations in patients with obesity undergoing Roux-en-Y gastric bypass (RYGB). Bars representing the mean and the pre- and post-intervention dots are shown. Differences between pre and post weight change were analyzed by paired two-tailed Student’s t tests. ***P<0.001. |
After an average period of 10 months on dietary treatment patients lost an average of 13.7 kg (P<0.001) and their BF% decreased a mean of 8.1% (P<0.001) (Supplementary Table 5). No changes in glucose or insulin concentrations were observed, while triglyceride and leptin levels were significantly reduced (P=0.023 and P=0.003, respectively). Diet-induced WL produced a non-significant reduction in circulating IL-1RA concentrations of 14% decreasing from 798 ± 537 to 697 ± 395 pg/mL (P=0.368; Figure 5B). A marginal negative correlation between final IL-1RA and adiponectin levels was again observed (r=−0.48, P=0.059).
After an average of 8 months following the surgical intervention, patients who had undergone RYGB experimented a significant (P<0.001) decrease in body weight (37 kg), and BF% (16.7%), as well as a significant improvement in glycemia (P<0.001), insulinemia (P<0.001), and HOMA, QUICKI and TyG indexes (P<0.001 for all) (Supplementary Table 5). Lipid markers (P<0.05 for all), uric acid (P<0.001) and markers of inflammation (P<0.001) were significantly improved. Leptin (P=0.011), adiponectin (P<0.001) and the Adpn/Lep ratio (P<0.001) were also significantly improved, as well as the AST/ALT ratio (P=0.019) and the FLI (P<0.001). RYGB-induced WL was associated with a statistically significant reduction in circulating IL-1RA concentrations (Figure 5C), which decreased from 1233 ± 1009 to 660 ± 538 pg/mL (a reduction of 46%, P<0.001). After WL, IL-1RA levels were significantly correlated with BF% (r=0.41, P=0.001), and marginal correlations were observed with leptin and (r=0.23, P=0.066) and the Adpn/Lep ratio (r=−0.23, P=0.082).
Discussion
The main findings of the present study are that 1) serum IL-1RA concentrations are increased in patients with obesity and further elevated in those with IGT or T2D; 2) circulating concentrations of IL-1RA correlate with BF%; 3) IL1RN mRNA expression in VAT is greatly increased in obesity-associated T2D correlating with the expression of genes involved in macrophage recruitment; and 4) marked BF% loss is associated with a significant decline in serum IL-1RA levels.
It has been proposed that circulating concentrations of IL-1RA are increased in patients with obesity to counteract the obesity-associated activation of the IL-1 axis,17,18,34,35 in agreement with the findings of the present study. Patients with obesity exhibited a 2.4-fold increase in serum IL-1RA concentrations as compared to NW individuals. Moreover, levels of IL-1RA were correlated with BMI, waist circumference, VAI, and BF% indicating that IL-1RA levels are related to the adipose tissue amount. On the other hand, many studies have shown that IL-1RA levels are increased in patients with T2D,36–38 being able of prospectively predicting changes in insulin sensitivity.39 However, studies where IL-1RA concentrations are explored in subjects with obesity across the glucose tolerance categories are scarce. Levels of IL-1RA increase gradually with increasing number of cardiometabolic abnormalities in patients with the metabolic syndrome.34,40 However, a study performed in subjects with severe obesity showed that IL-1RA concentrations did not differ across glucose intolerance categories.35 Data from the present study evidence that serum IL-1RA concentrations are increased in individuals with obesity and are further elevated in those with T2D. Moreover, IL-1RA is correlated with insulin levels and several surrogate markers of insulin resistance or sensitivity such as HOMA, QUICKI and the TyG index, even after adjustment by BF%. Several studies in rodents suggest that IL-1RA paradoxically induces insulin resistance since rats treated with recombinant IL-1RA exhibit a decrease in insulin sensitivity in euglycemic-hyperinsulinemic clamps22 and knock-down of Il1rn in obese mice improves insulin sensitivity.41 In addition, a rise in IL-1RA precedes the onset of T2D42 and discriminates which individuals will develop T2D.43 However, daily subcutaneous administration of anakinra, a recombinant human IL-1RA, improved glycemia and β-cell secretory function at 13 weeks,44 effects that are maintained 39 weeks after treatment withdrawal.45 It seems more plausible that the increased levels found in obesity and obesity-associated T2D reflect a response to counterbalance increased IL-1 activity.
Blocking of IL-1R by IL-1RA attenuates inflammation. In this sense, mice lacking Il1rn exhibit chronic inflammation.14 The present study shows that increased BF% is accompanied by high concentrations of IL-1RA in association with high levels of SAA, CRP, OPN, WBC, and fibrinogen, markers of the obesity-associated low-grade chronic inflammation. However, no relation with endotoxin was observed. A close association between IL-1RA and SAA, CRP, OPN, WBC, and fibrinogen after adjusting for adiposity was still found. The association between IL-1RA and CRP is in agreement with previous findings.46 Moreover, serum levels of IL-1RA associate with liver inflammation and serum ALT independently of obesity having been proposed as a non-invasive inflammatory marker of non-alcoholic steatohepatitis.47 Data from our study show that IL-1RA levels were positively correlated with γ-GT and FLI, even after adjustment for BF%. Interestingly, anakinra administration markedly reduced obesity-induced steatosis and liver lipogenic gene expression in mice with obesity,48 while decreased CRP and IL-6 in humans.44 Moreover, Il1rn KO mice present severe fatty liver with altered cholesterol homeostasis on an atherogenic diet.21 On the contrary, Il1rn knock-down reduced liver triglyceride and improved liver inflammation.41 Taken together, although the exact function of IL-1RA still needs to be determined, data support the notion that IL-1RA is involved in the regulation of obesity-associated inflammation and fatty liver, likely protecting from the development of cardiometabolic derangements related with obesity.
Adipose tissue is a major site of IL-1RA production,23 being one of the top differentially regulated genes in human VAT from patients with obesity and T2D as compared to those without T2D.49 The expression of IL1RN is increased in VAT from mice and humans with obesity and regulated by IL-1α, IL-1β, LPS, and IFN-β.22–24 Circulating levels of IL-1RA showed highly significant correlations with leptin, adiponectin and the Adpn/Lep ratio, a marker of dysfunctional adipose tissue.50,51 These findings, together with the high correlations of IL-1RA with BMI, BF% and WC, suggest that adipose tissue and, in particular, a dysfunctional adipose tissue is importantly responsible of the increased levels of IL-1RA. Interestingly, a stronger correlation of IL-1RA levels with VAT than with subcutaneous adipose tissue by using the “Imiomics” technique has been recently reported,52 in agreement with a higher mRNA expression.53 An increased production in VAT (a depot more abundant in men than in women) could explain the lack of differences regarding gender in IL-1RA in the present study, since raised levels of IL-1RA with higher BF% could be expected in women. Although adiponectin is able to induce the expression of IL-1RA in monocytes, dendritic cells and monocyte-derived macrophages,54 we found a negative correlation between IL-1RA and adiponectin in agreement with previous studies.46 The negative correlation between IL-1RA and the Adpn/Lep ratio suggests that an excess of proinflammatory dysfunctional adipose tissue triggers the production of IL-1RA. In this sense, the mRNA expression of IL1RN is greatly upregulated in the VAT of patients with obesity and T2D. To our knowledge, this is the first evidence of increased expression of IL1RN in human VAT from patients with obesity and T2D as compared to patients with obesity with NG and NW individuals. This increase is associated in the global cohort with an increased expression of key proinflammatory genes involved in the recruitment of macrophages and inducers of the M1 phenotype such as CCL2, SPP1, and CD68,4 as well as MMP9, a marker of adipose tissue remodeling and fibrosis.55 Therefore, it seems that as metabolic alterations develop in obesity, the dysfunctional adipose tissue increases the expression and secretion of IL-1RA.
To confirm that BF% is a major determinant of IL-1RA levels, we studied the potential changes of IL-1RA after different situations involving BF% changes of different magnitudes. We found no changes in IL-1RA levels after modest WG (average of 4.2% of BF% increase). This finding is in contrast with previous more prolonged studies (more than 4 years of follow-up) where an increase in IL-1RA levels with increasing body weight was observed for both genders46 or only in women,56 although BF% was associated with IL-1RA at baseline but only marginally in the longitudinal analysis in the former study. We observed a tendency to decreased IL-1RA levels after modest WL following conventional dietary treatment (average of 8.1% of BF% loss) which was reduced by 14%, but fell out of significance. Data from the literature are heterogeneous regarding the effect of diet-induced WL, with studies finding a decrease in IL-1RA concentrations after a low-carbohydrate diet, but not after a low-fat diet in patients with T2D,57 no changes,58 or an increase.59 However, levels of IL-1RA were dramatically decreased after bariatric surgery-induced WL (average of 16.7% of BF% loss) that were reduced by 46% in agreement with previous studies.17,47,60 Taken together, plasma IL-1RA appears to be reactive to marked changes in BF% and, to a lesser extent, to modest changes in adiposity. The changes in serum IL-1RA levels observed in patients with obesity following RYGB may reflect the changes in adipose tissue homeostasis. In this sense, levels of IL-1RA were related to adiponectin levels in the WG and diet-induced WL studies, and to BF%, leptin, and the Adpn/Lep ratio in patients undergoing bariatric surgery. In the same line, it has been proposed that leptin levels are a determinant of serum IL-1RA and that IL-1RA may induce leptin resistance.17,61 In summary, IL-1RA might be considered a dynamic marker of adipose tissue functionality.
Obesity and the metabolic syndrome are associated with increased oxidative stress.62 Given that IL-1RA has been shown to reduce oxidative stress in different animal models63 and that oxidative stress is reduced in patients with obesity undergoing sleeve gastrectomy,64 the relation of IL-1RA with oxidative stress in subjects with obesity and T2D and its changes after bariatric surgery deserves further research.
Some potential limitations of our study should be pointed out. First, this study was performed in Caucasian subjects and would need to be extended to other populations to determine race-specific differences in the levels of IL-1RA. Second, our study is limited by the relatively small sample size. However, the patients included in our work are very well-characterized individuals showing a high homogeneity within groups. Third, it would be of interest to consider the influence of other sources of IL-1RA such as the liver. However, no liver biopsies to evaluate the mRNA expression of IL1RN were available. Nonetheless, adipose tissue, in particular VAT, has been reported to express higher levels of IL1RN than the liver.53 Although IL-1RA has been studied as a T2D treatment and it is used for some inflammatory diseases, caution has to be taken since some possible adverse side effects may be produced such as cardiovascular problems due to proatherogenic lipid alterations.65
Serum IL-1RA concentrations are increased in patients with obesity and further increased in those with T2D. In addition, IL1RN mRNA expression in VAT is upregulated in volunteers with obesity and T2D in association with proinflammatory genes. Moreover, WL with marked reductions in BF% is accompanied by a decrease in IL-1RA concentrations, which may contribute to the beneficial effects accompanying weight reduction or, on the contrary, be only a mere marker of the improvement in the amount and functionality of adipose tissue. Further studies should allow to clarify the exact role of IL-1RA in obesity-associated cardiometabolic derangements and whether it can be proposed as an effective therapeutic weapon against T2D or fatty liver.
Ethics Approval
The study was conducted in accordance with the Declaration of Helsinki. The study was approved by the Clínica Universidad de Navarra’s Ethical Committee (2017.121). All participants signed the informed consent to participate in the study.
Acknowledgments
The authors thank all the individuals who participated in this study. The authors also thank all the members of the Nutrition Unit, for their technical support in body composition analysis.
Funding
This study was funded by by Plan Estatal I+D+I from the Spanish Instituto de Salud Carlos III–Subdirección General de Evaluación y Fomento de la investigación–FEDER (grants number PI17/02183, PI19/00785, PI20/00080 and PI20/00927), and by CIBEROBN, ISCIII, Spain. The funders had no role in study design, data collection and analysis, decision to publish, or preparation of the manuscript.
Disclosure
Prof. Dr. Gema Frühbeck reports grants from FIS Spanish Health Institute Carlos III, Ministry of Science & Innovation (ref PI19/00785), grants from CIBEROBN Spanish Health Institute Carlos III, Ministry of Science & Innovation (ref CB06/03/1014), during the conduct of the study; and being a member of the OPEN Spain Initiative supported by Novo Nordisk. The authors report no other potential conflicts of interest in this work.
References
1. Bray GA, Frühbeck G, Ryan DH, Wilding JP. Management of obesity. Lancet. 2016;387:1947–1956. doi:10.1016/S0140-6736(16)00271-3
2. Heymsfield SB, Wadden TA. Mechanisms, pathophysiology, and management of obesity. N Engl J Med. 2017;376:254–266. doi:10.1056/NEJMra1514009
3. Pillon NJ, Loos RJF, Marshall SM, Zierath JR. Metabolic consequences of obesity and type 2 diabetes: balancing genes and environment for personalized care. Cell. 2021;184:1530–1544. doi:10.1016/j.cell.2021.02.012
4. Unamuno X, Gómez-Ambrosi J, Rodríguez A, Becerril S, Frühbeck G, Catalán V. Adipokine dysregulation and adipose tissue inflammation in human obesity. Eur J Clin Invest. 2018;48:e12997. doi:10.1111/eci.12997
5. Frühbeck G, Gómez Ambrosi J. Rationale for the existence of additional adipostatic hormones. FASEB J. 2001;15:1996–2006. doi:10.1096/fj.00-0829hyp
6. Landecho MF, Tuero C, Valentí V, Bilbao I, de la Higuera M, Frühbeck G. Relevance of leptin and other adipokines in obesity-associated cardiovascular risk. Nutrients. 2019;11:2664. doi:10.3390/nu11112664
7. Kahn CR, Wang G, Lee KY. Altered adipose tissue and adipocyte function in the pathogenesis of metabolic syndrome. J Clin Invest. 2019;129:3990–4000. doi:10.1172/JCI129187
8. Zhao S, Kusminski CM, Scherer PE. Adiponectin, leptin and cardiovascular disorders. Circ Res. 2021;128:136–149. doi:10.1161/CIRCRESAHA.120.314458
9. Garlanda C, Dinarello CA, Mantovani A. The interleukin-1 family: back to the future. Immunity. 2013;39:1003–1018. doi:10.1016/j.immuni.2013.11.010
10. Shuck ME, Eessalu TE, Tracey DE, Bienkowski MJ. Cloning, heterologous expression and characterization of murine interleukin 1 receptor antagonist protein. Eur J Immunol. 1991;21:2775–2780. doi:10.1002/eji.1830211119
11. Arend WP, Malyak M, Guthridge CJ, Gabay C. Interleukin-1 receptor antagonist: role in biology. Annu Rev Immunol. 1998;16:756.
12. Gabay C, Smith MF, Eidlen D, Arend WP. Interleukin 1 receptor antagonist (IL-1Ra) is an acute-phase protein. J Clin Invest. 1997;99:2930–2940. doi:10.1172/JCI119488
13. Hirsch E, Irikura VM, Paul SM, Hirsh D. Functions of interleukin 1 receptor antagonist in gene knockout and overproducing mice. Proc Natl Acad Sci U S A. 1996;93:11008–11013. doi:10.1073/pnas.93.20.11008
14. Horai R, Saijo S, Tanioka H, et al. Development of chronic inflammatory arthropathy resembling rheumatoid arthritis in interleukin 1 receptor antagonist-deficient mice. J Exp Med. 2000;191:313–320. doi:10.1084/jem.191.2.313
15. Dinarello CA, Simon A, van der Meer JW. Treating inflammation by blocking interleukin-1 in a broad spectrum of diseases. Nat Rev Drug Discov. 2012;11:633–652. doi:10.1038/nrd3800
16. Dinarello CA. The IL-1 family of cytokines and receptors in rheumatic diseases. Nat Rev Rheumatol. 2019;15(10):612–632. doi:10.1038/s41584-019-0277-8
17. Meier CA, Bobbioni E, Gabay C, Assimacopoulos-Jeannet F, Golay A, Dayer JM. IL-1 receptor antagonist serum levels are increased in human obesity: a possible link to the resistance to leptin? J Clin Endocrinol Metab. 2002;87:1184–1188. doi:10.1210/jcem.87.3.8351
18. Ghanbari M, Momen Maragheh S, Aghazadeh A, et al. Interleukin-1 in obesity-related low-grade inflammation: from molecular mechanisms to therapeutic strategies. Int Immunopharmacol. 2021;96:107765. doi:10.1016/j.intimp.2021.107765
19. Isoda K, Shiigai M, Ishigami N, et al. Deficiency of interleukin-1 receptor antagonist promotes neointimal formation after injury. Circulation. 2003;108:516–518. doi:10.1161/01.CIR.0000085567.18648.21
20. Somm E, Henrichot E, Pernin A, et al. Decreased fat mass in interleukin-1 receptor antagonist-deficient mice: impact on adipogenesis, food intake, and energy expenditure. Diabetes. 2005;54:3503–3509. doi:10.2337/diabetes.54.12.3503
21. Isoda K, Sawada S, Ayaori M, et al. Deficiency of interleukin-1 receptor antagonist deteriorates fatty liver and cholesterol metabolism in hypercholesterolemic mice. J Biol Chem. 2005;280:7002–7009. doi:10.1074/jbc.M412220200
22. Somm E, Cettour-Rose P, Asensio C, et al. Interleukin-1 receptor antagonist is upregulated during diet-induced obesity and regulates insulin sensitivity in rodents. Diabetologia. 2006;49:387–393. doi:10.1007/s00125-005-0046-x
23. Juge-Aubry CE, Somm E, Giusti V, et al. Adipose tissue is a major source of interleukin-1 receptor antagonist: upregulation in obesity and inflammation. Diabetes. 2003;52:1104–1110. doi:10.2337/diabetes.52.5.1104
24. Juge-Aubry CE, Somm E, Chicheportiche R, et al. Regulatory effects of interleukin (IL)-1, interferon-b, and IL-4 on the production of IL-1 receptor antagonist by human adipose tissue. J Clin Endocrinol Metab. 2004;89:2652–2658. doi:10.1210/jc.2003-031219
25. American Diabetes Association. Classification and Diagnosis of Diabetes: standards of Medical Care in Diabetes-2021. Diabetes Care. 2021;44:S15–S33. doi:10.2337/dc21-S002
26. Gómez-Ambrosi J, González-Crespo I, Catalán V, et al. Clinical usefulness of abdominal bioimpedance (ViScan) in the determination of visceral fat and its application in the diagnosis and management of obesity and its comorbidities. Clin Nutr. 2018;37:580–589. doi:10.1016/j.clnu.2017.01.010
27. Gómez-Ambrosi J, Silva C, Galofré JC, et al. Body mass index classification misses subjects with increased cardiometabolic risk factors related to elevated adiposity. Int J Obes. 2012;36:286–294. doi:10.1038/ijo.2011.100
28. Amato MC, Giordano C, Galia M, et al. Visceral Adiposity Index: a reliable indicator of visceral fat function associated with cardiometabolic risk. Diabetes Care. 2010;33:920–922. doi:10.2337/dc09-1825
29. Guerrero-Romero F, Simental-Mendía LE, González-Ortiz M, et al. The product of triglycerides and glucose, a simple measure of insulin sensitivity. Comparison with the euglycemic-hyperinsulinemic clamp. J Clin Endocrinol Metab. 2010;95:3347–3351. doi:10.1210/jc.2010-0288
30. Angulo P, Keach JC, Batts KP, Lindor KD. Independent predictors of liver fibrosis in patients with nonalcoholic steatohepatitis. Hepatology. 1999;30:1356–1362. doi:10.1002/hep.510300604
31. Bedogni G, Bellentani S, Miglioli L, et al. The Fatty Liver Index: a simple and accurate predictor of hepatic steatosis in the general population. BMC Gastroenterol. 2006;6:33. doi:10.1186/1471-230X-6-33
32. Frühbeck G, Catalán V, Rodríguez A, et al. Normalization of adiponectin concentrations by leptin replacement in ob/ob mice is accompanied by reductions in systemic oxidative stress and inflammation. Sci Rep. 2017;7:2752. doi:10.1038/s41598-017-02848-0
33. Catalán V, Gómez-Ambrosi J, Rotellar F, et al. Validation of endogenous control genes in human adipose tissue: relevance to obesity and obesity-associated type 2 diabetes mellitus. Horm Metab Res. 2007;39:495–500. doi:10.1055/s-2007-982502
34. Cartier A, Bergeron J, Poirier P, et al. Increased plasma interleukin-1 receptor antagonist levels in men with visceral obesity. Ann Med. 2009;41:471–478. doi:10.1080/07853890903022801
35. Hofso D, Ueland T, Hager H, et al. Inflammatory mediators in morbidly obese subjects: associations with glucose abnormalities and changes after oral glucose. Eur J Endocrinol. 2009;161:451–458. doi:10.1530/EJE-09-0421
36. Carstensen M, Herder C, Kivimaki M, et al. Accelerated increase in serum interleukin-1 receptor antagonist starts 6 years before diagnosis of type 2 diabetes: whitehall II prospective cohort study. Diabetes. 2010;59:1222–1227. doi:10.2337/db09-1199
37. Luotola K, Pietila A, Zeller T, et al. Associations between interleukin-1 (IL-1) gene variations or IL-1 receptor antagonist levels and the development of type 2 diabetes. J Intern Med. 2011;269:322–332. doi:10.1111/j.1365-2796.2010.02294.x
38. Ballak DB, Stienstra R, Tack CJ, Dinarello CA, van Diepen JA. IL-1 family members in the pathogenesis and treatment of metabolic disease: focus on adipose tissue inflammation and insulin resistance. Cytokine. 2015;75:280–290. doi:10.1016/j.cyto.2015.05.005
39. Fizelova M, Jauhiainen R, Kangas AJ, et al. Differential associations of inflammatory markers with insulin sensitivity and secretion: the prospective METSIM study. J Clin Endocrinol Metab. 2017;102:3600–3609. doi:10.1210/jc.2017-01057
40. Saltevo J, Vanhala M, Kautiainen H, Kumpusalo E, Laakso M. Association of C-reactive protein, interleukin-1 receptor antagonist and adiponectin with the metabolic syndrome. Mediators Inflamm. 2007;2007:93573. doi:10.1155/2007/93573
41. Franck N, Maris M, Nalbandian S, et al. Knock-down of IL-1Ra in obese mice decreases liver inflammation and improves insulin sensitivity. PLoS One. 2014;9:e107487. doi:10.1371/journal.pone.0107487
42. Herder C, Brunner EJ, Rathmann W, et al. Elevated levels of the anti-inflammatory interleukin-1 receptor antagonist precede the onset of type 2 diabetes: the Whitehall II study. Diabetes Care. 2009;32:421–423. doi:10.2337/dc08-1161
43. Grossmann V, Schmitt VH, Zeller T, et al. Profile of the immune and inflammatory response in individuals with prediabetes and type 2 diabetes. Diabetes Care. 2015;38:1356–1364. doi:10.2337/dc14-3008
44. Larsen CM, Faulenbach M, Vaag A, et al. Interleukin-1-receptor antagonist in type 2 diabetes mellitus. N Engl J Med. 2007;356:1517–1526. doi:10.1056/NEJMoa065213
45. Larsen CM, Faulenbach M, Vaag A, Ehses JA, Donath MY, Mandrup-Poulsen T. Sustained effects of interleukin-1 receptor antagonist treatment in type 2 diabetes. Diabetes Care. 2009;32:1663–1668. doi:10.2337/dc09-0533
46. Black MH, Shu YH, Wu J, et al. Longitudinal increases in adiposity contribute to worsening adipokine profile over time in Mexican Americans. Obesity. 2018;26:703–712. doi:10.1002/oby.22128
47. Pihlajamäki J, Kuulasmaa T, Kaminska D, et al. Serum interleukin 1 receptor antagonist as an independent marker of non-alcoholic steatohepatitis in humans. J Hepatol. 2012;56:663–670. doi:10.1016/j.jhep.2011.10.005
48. Negrin KA, Roth Flach RJ, DiStefano MT, et al. IL-1 signaling in obesity-induced hepatic lipogenesis and steatosis. PLoS One. 2014;9:e107265. doi:10.1371/journal.pone.0107265
49. Carruthers NJ, Strieder-Barboza C, Caruso JA, et al. The human type 2 diabetes-specific visceral adipose tissue proteome and transcriptome in obesity. Sci Rep. 2021;11:17394. doi:10.1038/s41598-021-96995-0
50. Frühbeck G, Catalán V, Rodríguez A, Gómez-Ambrosi J. Adiponectin-leptin ratio: a promising index to estimate adipose tissue dysfunction. Relation with obesity-associated cardiometabolic risk. Adipocyte. 2018;7:57–62. doi:10.1080/21623945.2017.1402151
51. Frühbeck G, Catalán V, Rodríguez A, et al. Adiponectin-leptin ratio is a functional biomarker of adipose tissue inflammation. Nutrients. 2019;11:454. doi:10.3390/nu11020454
52. Strand R, Kullberg J, Ahlstrom H, Lind L. Relationships between plasma levels and six proinflammatory interleukins and body composition using a new magnetic resonance imaging voxel-based technique. Cytokine: X. 2021;3:100050. doi:10.1016/j.cytox.2020.100050
53. Moschen AR, Molnar C, Enrich B, Geiger S, Ebenbichler CF, Tilg H. Adipose and liver expression of interleukin (IL)-1 family members in morbid obesity and effects of weight loss. Mol Med. 2011;17:840–845. doi:10.2119/molmed.2010.00108
54. Wolf AM, Wolf D, Rumpold H, Enrich B, Tilg H. Adiponectin induces the anti-inflammatory cytokines IL-10 and IL-1RA in human leukocytes. Biochem Biophys Res Commun. 2004;323:630–635. doi:10.1016/j.bbrc.2004.08.145
55. Lancha A, Rodríguez A, Catalán V, et al. Osteopontin deletion prevents the development of obesity and hepatic steatosis via impaired adipose tissue matrix remodeling and reduced inflammation and fibrosis in adipose tissue and liver in mice. PLoS One. 2014;9:e98398. doi:10.1371/journal.pone.0098398
56. Ahonen T, Vanhala M, Kautiainen H, Kumpusalo E, Saltevo J. Sex differences in the association of adiponectin and low-grade inflammation with changes in the body mass index from youth to middle age. Gend Med. 2012;9:1–8. doi:10.1016/j.genm.2012.01.002
57. Jonasson L, Guldbrand H, Lundberg AK, Nystrom FH. Advice to follow a low-carbohydrate diet has a favourable impact on low-grade inflammation in type 2 diabetes compared with advice to follow a low-fat diet. Ann Med. 2014;46:182–187. doi:10.3109/07853890.2014.894286
58. de Mello VD, Kolehmainen M, Schwab U, et al. Effect of weight loss on cytokine messenger RNA expression in peripheral blood mononuclear cells of obese subjects with the metabolic syndrome. Metabolism. 2008;57:192–199. doi:10.1016/j.metabol.2007.08.024
59. Siklova-Vitkova M, Klimcakova E, Polak J, et al. Adipose tissue secretion and expression of adipocyte-produced and stromavascular fraction-produced adipokines vary during multiple phases of weight-reducing dietary intervention in obese women. J Clin Endocrinol Metab. 2012;97:E1176–1181. doi:10.1210/jc.2011-2380
60. Brethauer SA, Heneghan HM, Eldar S, et al. Early effects of gastric bypass on endothelial function, inflammation, and cardiovascular risk in obese patients. Surg Endosc. 2011;25:2650–2659. doi:10.1007/s00464-011-1620-6
61. Feng X, Guan D, Auen T, et al. IL1R1 is required for celastrol’s leptin-sensitization and antiobesity effects. Nat Med. 2019;25:575–582. doi:10.1038/s41591-019-0358-x
62. Frühbeck G, Catalán V, Rodríguez A, et al. Involvement of the leptin-adiponectin axis in inflammation and oxidative stress in the metabolic syndrome. Sci Rep. 2017;7:6619. doi:10.1038/s41598-017-06997-0
63. Wahab F, Santos-Junior NN, de Almeida Rodrigues RP, Costa LHA, Catalao CHR, Rocha MJA. Interleukin-1 receptor antagonist decreases hypothalamic oxidative stress during experimental sepsis. Mol Neurobiol. 2016;53:3992–3998. doi:10.1007/s12035-015-9338-4
64. Choromanska B, Mysliwiec P, Luba M, et al. Bariatric surgery normalizes protein glycoxidation and nitrosative stress in morbidly obese patients. Antioxidants. 2020;9:1087. doi:10.3390/antiox9111087
65. Interleukin 1 Genetics C. Cardiometabolic effects of genetic upregulation of the interleukin 1 receptor antagonist: a Mendelian randomisation analysis. Lancet Diabetes Endocrinol. 2015;3:243–253. doi:10.1016/S2213-8587(15)00034-0
 © 2022 The Author(s). This work is published and licensed by Dove Medical Press Limited. The full terms of this license are available at https://www.dovepress.com/terms.php and incorporate the Creative Commons Attribution - Non Commercial (unported, v3.0) License.
By accessing the work you hereby accept the Terms. Non-commercial uses of the work are permitted without any further permission from Dove Medical Press Limited, provided the work is properly attributed. For permission for commercial use of this work, please see paragraphs 4.2 and 5 of our Terms.
© 2022 The Author(s). This work is published and licensed by Dove Medical Press Limited. The full terms of this license are available at https://www.dovepress.com/terms.php and incorporate the Creative Commons Attribution - Non Commercial (unported, v3.0) License.
By accessing the work you hereby accept the Terms. Non-commercial uses of the work are permitted without any further permission from Dove Medical Press Limited, provided the work is properly attributed. For permission for commercial use of this work, please see paragraphs 4.2 and 5 of our Terms.