")
Back to Journals » OncoTargets and Therapy » Volume 10
Serum levels of IGF-1 and IGF-BP3 are associated with event-free survival in adult Ewing sarcoma patients treated with chemotherapy
Authors de Groot S, Gelderblom H, Fiocco M, Bovée JVMG, van der Hoeven JJM, Pijl H, Kroep JR
Received 2 October 2016
Accepted for publication 2 February 2017
Published 13 June 2017 Volume 2017:10 Pages 2963—2970
DOI https://doi.org/10.2147/OTT.S123726
Checked for plagiarism Yes
Review by Single anonymous peer review
Peer reviewer comments 2
Editor who approved publication: Dr Faris Farassati
Stefanie de Groot,1 Hans Gelderblom,1 Marta Fiocco,2,3 Judith VMG Bovée,4 Jacobus JM van der Hoeven,1 Hanno Pijl,5 Judith R Kroep1
1Department of Medical Oncology, 2Department of Medical Statistics and Bioinformatics, Leiden University Medical Center, 3Mathematical Department, Leiden University, 4Department of Pathology, 5Department of Endocrinology, Leiden University Medical Center, Leiden, the Netherlands
Background: Activation of the insulin-like growth factor 1 (IGF-1) pathway is involved in cell growth and proliferation and is associated with tumorigenesis, tumor progression, and therapy resistance in solid tumors. We examined whether variability in serum levels of IGF-1, IGF-2, and IGF-binding protein 3 (IGF-BP3) can predict event-free survival (EFS) and overall survival (OS) in Ewing sarcoma patients treated with chemotherapy.
Patients and methods: Serum levels of IGF-1, IGF-2, and IGF-BP3 of 22 patients with localized or metastasized Ewing sarcoma treated with six cycles of vincristine/ifosfamide/doxorubicin/etoposide (VIDE) chemotherapy were recorded. Baseline levels were compared with presixth cycle levels using paired t-tests and were tested for associations with EFS and OS. Continuous variables were dichotomized according to the Contal and O’Quigley procedure. Survival analyses were performed using Cox regression analysis.
Results: High baseline IGF-1 and IGF-BP3 serum levels were associated with EFS (hazard ratio [HR] 0.075, 95% confidence interval [CI] 0.009–0.602 and HR 0.090, 95% CI 0.011–0.712, respectively) in univariate and multivariate analyses (HR 0.063, 95% CI 0.007–0.590 and HR 0.057, 95% CI 0.005–0.585, respectively). OS was improved, but this was not statistically significant. IGF-BP3 and IGF-2 serum levels increased during treatment with VIDE chemotherapy (P=0.055 and P=0.023, respectively).
Conclusion: High circulating serum levels of IGF-1 and IGF-BP3 and the molar ratio of IGF-1:IGF-BP3 serum levels were associated with improved EFS and a trend for improved OS in Ewing sarcoma patients treated with VIDE chemotherapy. These findings suggest the need for further investigation of the IGF-1 pathway as a biomarker of disease progression in patients with Ewing sarcoma.
Keywords: Ewing sarcoma, chemotherapy, IGF-1, IGF-2, IGF-BP3, IGF-1R, survival, biomarkers
Introduction
Ewing sarcoma is a rare form of cancer; however, it is the second most common bone sarcoma in children and young adults. The disease is usually primarily localized in the skeleton but may occur in soft tissue. Mortality is high despite intensive multidisciplinary treatment, including surgery, chemotherapy, and radiotherapy:1 overall survival (OS) at 5 years is 30% in patients with primary metastatic disease and 60% in patients with localized disease.2 Evidence suggests that the insulin-like growth factor 1 (IGF-1) pathway plays a major role in the pathogenesis of Ewing sarcoma.3,4 The IGF-1 pathway consists of the IGF-1 receptor (IGF-1R), two ligands (IGF-1 and IGF-2), and six IGF-binding proteins (IGF-BP1-6), of which IGF-BP3 is the most abundant.5–7 The insulin receptor (IR) is highly homologous to the IGF-1R, allowing for the formation of hybrid receptors that can activate the downstream pathway. The A isoform of the IR, which is predominant in cancer cells, can also activate the pathway.6,8
Eighty-five percent of Ewing sarcoma tumors are marked by the chromosomal translocation t(11;22).9 This somatic mutation results in aberrant products of the Ewing sarcoma breakpoint region 1 (EWSR1) and the Friend leukemia virus integration 1 (FLI1) genes. The EWSR1-FLI1 oncoprotein binds to the IGFBP3 promoter, which inhibits expression of IGF-BP3 (Figure 1).3,4 The biological activity of IGF-1 is inhibited primarily by binding IGF-BP3.5,10 Therefore, high levels of bioavailable IGF-1 (and IGF-2) may activate the IGF-1R in Ewing sarcoma to stimulate Ras/MAPK and PI3K/AKT pathways, through which cell proliferation is promoted and apoptosis inhibited.5,8
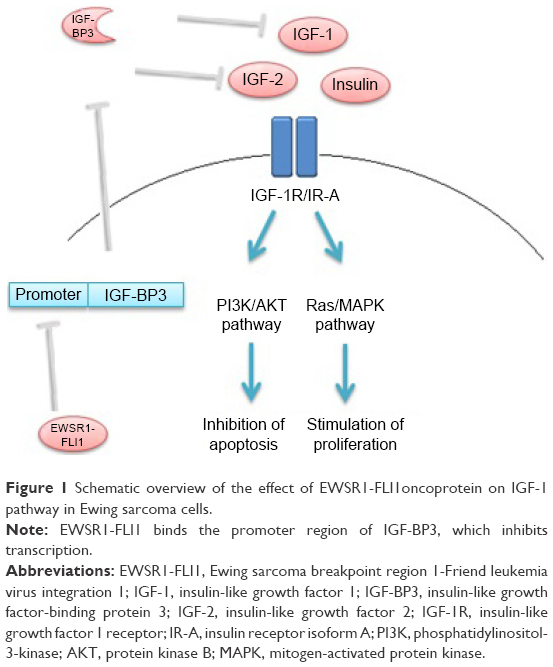 | Figure 1 Schematic overview of the effect of EWSR1-FLI1oncoprotein on IGF-1 pathway in Ewing sarcoma cells. |
Convincing preclinical evidence of the efficacy of IGF-1 pathway inhibitors in the context of cancer treatment has led to the development of numerous such agents that have been investigated in clinical trials as treatments for Ewing sarcoma, breast cancer, and other solid tumors.6,11–13 Unfortunately, convincing clinical benefits of these agents have been limited to rare long-lasting effects in a small proportion of patients with Ewing sarcoma.13 A better understanding of the role of the IGF-1 pathway could therefore help illuminate specific therapeutic targets and potential biomarkers of disease progression.
This observational study examined whether circulating levels of IGF-1 pathway components predict the (event-free) survival of Ewing sarcoma patients treated with vincristine/ifosfamide/doxorubicin/etoposide (VIDE) chemotherapy.
Patients and methods
Study population
Patients with primary localized or metastatic Ewing sarcoma who were treated between 2009 and 2014 with VIDE chemotherapy (1.5 mg/m2 of vincristine on day 1, 3,000 mg/m2 of ifosfamide on days 1/2/3, 20 mg/m2 of doxorubicin on days 1/2/3, and 150 mg/m2 of etoposide on days 1/2/3) at the Department of Medical Oncology, Leiden University Medical Center, were included. For all participants, the diagnosis was established in a multidisciplinary setting and confirmed using molecular analysis. Response of the tumor to chemotherapy was defined according to the Van der Woude classification as “good” or “poor”, based on pathology and/or radiology reports, where available.14,15 The study was conducted according the Dutch “Code of Good Conduct” and was approved by the ethics committee of the Leiden University Medical Center. Patient consent was assumed as per the no-objection rule of the Code of Good Conduct (https://www.federa.org/codes-conduct). Biomarker data have been reported in accordance with REMARK criteria.16
Blood sampling and assay methods
Fasting blood samples were obtained immediately prior to the first and sixth chemotherapy cycles. Serum levels of IGF-1 (IDS-iSYS; Immunodiagnostic Systems, Frankfurt, Germany) and IGF-BP3 (Immulite 2500; Siemens, The Hague, the Netherlands) were analyzed by chemiluminescence immunoassay (CIA). The IGF-1 assay is traceable to the WHO IS 02/254.17 The IGF-BP3 assay is traceable to WHO NIBSC Reagent 93/560 according to IFU: IMMULITE 2000 IGF-BP3 (PIL2KGB-14, 2012-06-18).18 Serum IGF-2 was analyzed by radioimmunoassay after Sep-Pak C18 column extraction calibrated to WHO 96/538 international standard.19
Statistical analysis methods
The primary outcome measure was the association of baseline serum levels of IGF-1, IGF-2, and IGF-BP3 with event-free survival (EFS). Secondary outcome measures included the association of baseline serum levels of IGF-1, IGF-2, and IGF-BP3 with presixth cycle levels and with OS.
A linear regression model was used to study the association between age and IGF-1. Mean serum levels were compared using a t-test for paired groups. To dichotomize continuous covariates for use in a Cox model, the Contal, and O’Quigley technique based on the log-rank test statistic was used. This method cutoff point for the covariate of interest at which the largest difference is seen between individuals in two groups. The procedure involves estimation of the cutoff point for the covariate and tests the hypothesis that this covariate in its binary version has no effect on the outcome. Technical details concerning the procedure are described elsewhere.20,21 In this study, the median was used as the cutoff point for IGF-BP3 serum levels. Since there were no events in one of the groups identified by using the Contal and O’Quigley procedure, a Cox model could not be performed. EFS was defined as time from date of diagnosis until the date of the earliest documented disease recurrence or progression or death from any cause. OS was defined as time from date of diagnosis until date of death from any cause. Median follow-up was calculated by applying the reverse Kaplan–Meier methodology.22 Cox regression models were used to evaluate the effect of the covariates on EFS and OS. Hazard ratios (HRs) and 95% confidence intervals (95% CIs) were calculated. Serum levels of the components of the IGF-1 pathway that were found to be significant (to 1%) in univariate Cox regression models were carried forward to the multivariate model. Relevant risk factors described in the literature or found to have a P-value of less than 0.1 in univariate analyses were incorporated in the multivariate model. All tests were two tailed. P-values of less than 0.05 were considered significant. All data were analyzed using Statistical Package for Social Sciences (SPSS) software™ 20.0 (IBM Corp., Armonk, NY, USA) and R version 3.3 (R Foundation for Statistical Computing, Vienna, Austria).23
Results
Patient characteristics
The clinical characteristics at diagnosis of the 22 Ewing sarcoma patients included in the study are shown in Table 1. All patients were 16 years or older. Nine patients had metastastic disease and 13 had localized disease at initial diagnosis. One patient received two cycles of etoposide and cisplatin chemotherapy before the diagnosis of Ewing sarcoma was made as small-cell carcinoma was initially suspected. Three patients were diagnosed with Ewing sarcoma only after surgical excision of the tumor. Two of those patients were diagnosed with an incidental extraskeletal Ewing sarcoma of the kidney and one patient of the adrenal gland.
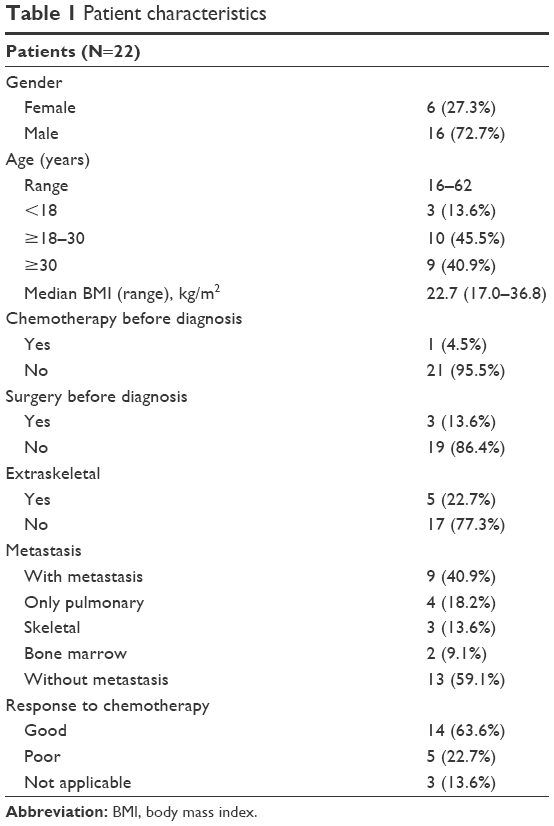 | Table 1 Patient characteristics |
IGF pathway serum levels during chemotherapy
Serum samples at baseline and after five VIDE cycles were available for 22 and 13 patients, respectively. For nine patients, no samples were collected due to logistical reasons. There was no significant difference in IGF-1 serum levels in patients with metastastic disease versus localized disease (mean values 28.2 versus 34.4 nmol/L [P=0.227], respectively). At baseline, age was significantly associated with IGF-1 values (P=0.035) in our cohort. Baseline IGF-1, IGF-2, and IGF-BP3 levels were compared with levels prior to the sixth chemotherapy cycle. IGF-1 levels did not change significantly during chemotherapy. IGF-BP3 and IGF-2 levels increased during chemotherapy (P=0.055 and P=0.023, respectively). Mean values of IGF-1, IGF-2, and IGF-BP3 at baseline and presixth cycle are shown in Figure 2. IGF-1, IGF-BP3, and IGF-2 levels in subjects with good response and poor response were compared according to the Van der Woude classification using data from pathology and/or radiology reports. Three patients underwent surgery before diagnosis, so it was not possible to assess response to chemotherapy. Fourteen patients showed a good response and five patients a poor response to chemotherapy. IGF-1, IGF-BP3, and IGF-2 levels at baseline were not associated with response to chemotherapy (P=0.702, P=0.912, and P=0.888, respectively).
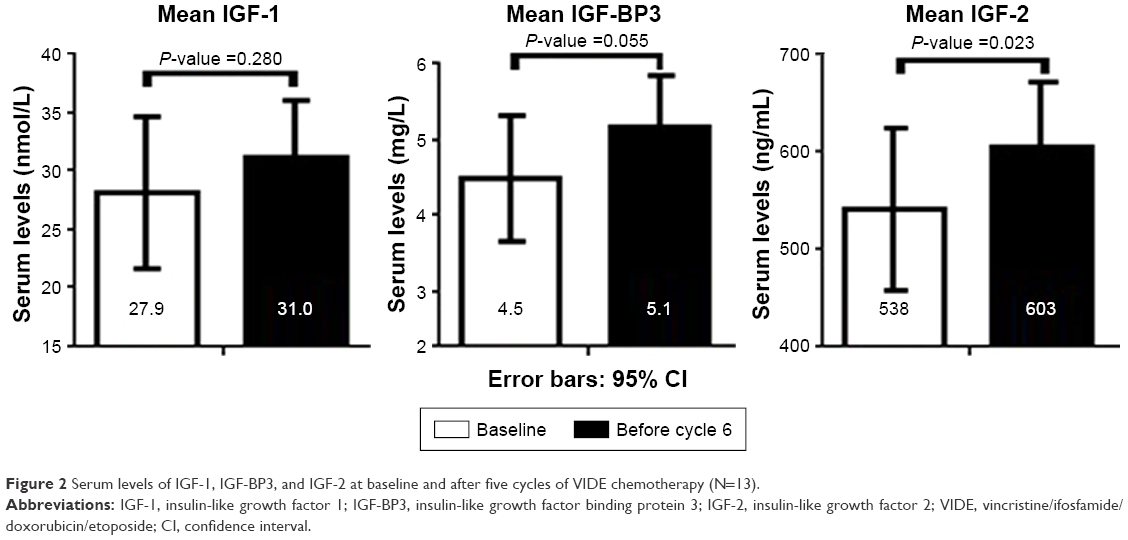 | Figure 2 Serum levels of IGF-1, IGF-BP3, and IGF-2 at baseline and after five cycles of VIDE chemotherapy (N=13). |
Serum levels and association with survival
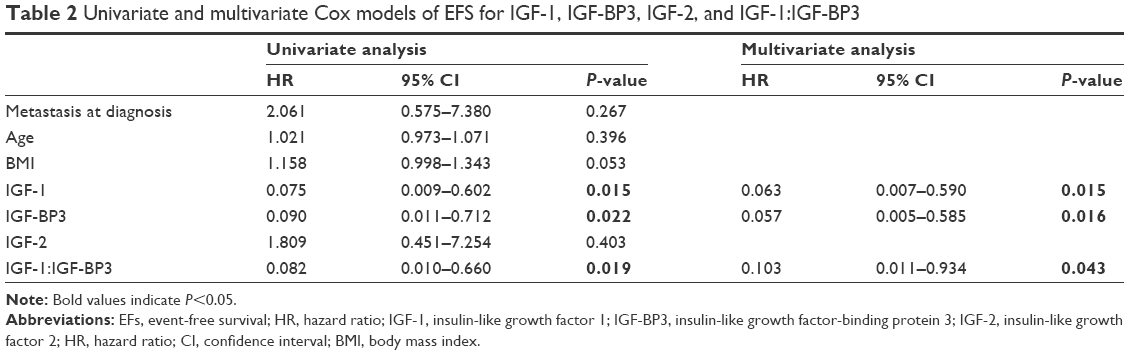
The median follow-up was 3.25 years (95% CI 2.25–4.25). For baseline values of IGF-1 and IGF-2 and the molar IGF-1:IGF-BP3 ratio, the cutoff point based on the Contal and O’Quigley procedure was equal to 28.7 nmol/L, 608 ng/mL and 0.21, respectively. The median cutoff point of baseline values of IGF-BP3 was 4.7 mg/L. Kaplan–Meier curves for IGF-1, IGF-2, IGF-BP3, the molar IGF-1:IGF-BP3 ratio, and the number of patients per group are shown in Figure 3. In this analysis, IGF-1, IGF-BP3, and the molar IGF-1:IGF-BP3 ratio are prognostic factors for survival. Risk factors described in the literature to be associated with survival24 and those with P<0.1 in univariate analyses were included in the regression model for multivariate analysis. A Cox model was used to study the association between risk factors and survival outcomes. The estimated HRs and associated 95% confidence intervals for univariate and multivariate analyses are shown in Table 2. Age and body mass index (BMI) were adjusted for in the multivariate Cox model. IGF-1 was a significant prognostic factor for EFS (HR 0.063, 95% CI 0.007–0.590, P=0.015). This was not a significant for OS in this patient group (HR 0.162, 95% CI 0.017–1.496, P=0.109). IGF-BP3 was significantly associated with EFS (HR 0.057, 95% CI 0.005–0.585, P=0.016), but not OS (HR 0.125, 95% CI 0.011–1.423, P=0.094). IGF-2 levels were not significantly associated with EFS (HR 1.064, 95% CI 0.164–6.905, P=0.948) or OS (HR 5.297, 95% CI 0.451–62.24, P=0.185) (not shown). To investigate the influence of free IGF-1, the molar IGF-1:IGF-BP3 ratio was used as risk factor. The molar IGF-1:IGF-BP3 ratio was associated with EFS (HR 0.103, 95% CI 0.011–0.934, P=0.043), but not OS (HR 0.163, 95% CI 0.017–1.546, P=0.225) in multivariate analyses. IGF-1, IGF-BP3, and IGF-2 serum alterations were not associated with EFS or OS.
 | Figure 3 Kaplan–Meier curves of event-free survival (left column) and overall survival (right column) for IGF-1, IGF-BP3, and molar IGF-1 (nm/L):IGF-BP3 (nm/L) ratio levels under or above the cutoff point. |
 | Table 2 Univariate and multivariate Cox models of EFS for IGF-1, IGF-BP3, IGF-2, and IGF-1:IGF-BP3 |
IGF-1 serum levels consistently decline after adolescence in healthy subjects.17 Therefore, levels were compared for each subject in our cohort to the age- and gender-matched reference value. The measured values were calculated as a percentage of the corresponding reference values. High percentage of measured IGF-1 compared to the reference value predicted EFS (HR 0.614 per 10% increase, 95% CI 0.405–0.931, P=0.021), but not OS (HR 0.703 per 10% increase, 95% CI 0.460–1.075, P=0.104) in multivariate analysis.
Discussion
We found that high baseline IGF-1 and IGF-BP3 serum levels and the molar IGF-1:IGF-BP3 ratio in serum were associated with improved EFS and a trend for OS in Ewing sarcoma patients treated with VIDE chemotherapy. IGF-2 serum levels were not significantly associated with EFS or OS. Moreover, IGF-BP3 and IGF-2 serum levels increased during VIDE chemotherapy in this patient group. IGF-1 serum levels did not change during chemotherapy.
It seems counterintuitive that high levels of IGF-1 predict better survival in Ewing sarcoma, as IGF-1 is involved in the development, progression and therapy resistance of several solid tumors.7 However, low levels of IGF-1 may reflect an endocrine adaptation to (severe) disease.25 Indeed, low levels of IGF-1 were reported to be associated with greater tumor burden and more aggressive systemic illness in Ewing sarcoma.26 Additionally, lower levels of IGF-1 were reported in five patients with metastatic disease compared to patients with localized disease.26 Toretsky et al27 also reported that Ewing sarcoma patients with metastatic disease had lower circulating IGF-1 levels than patients with localized disease, suggesting that more severe illness downregulates IGF-1 production in the liver. In keeping with these reports, we observed lower levels of serum IGF-1 in patients with metastatic disease compared to localized disease, but the difference was not statistically significant, perhaps because of the small population size. Interestingly, low levels of circulating IGF-1 predicted worse survival in other solid tumors28–35 and systemic diseases.36,37 Borinstein et al38 did not find an association between serum IGF-1 levels and treatment outcome in 226 Ewing sarcoma patients, but this may be explained by the fact that relatively young patients were included compared to our study (88% of subjects were younger than 18 years), increasing the confounding effect of age-associated growth hormone and IGF-1 release.
In Ewing sarcoma, autocrine loops of IGF-1 signaling have been shown to be crucial for proliferation and cell survival in vitro.3,39–41 Indeed, serum IGF-1 levels may have little or no influence on tumor growth, as the autocrine production of IGF-1 (and IGF-2) is probably sufficient and decisive. Analogously, autocrine IGF-1 production by the tumor has been shown to be a negative predictor of survival in colorectal cancer patients treated with cetuximab and irinotecan.42 Presumably, autocrine IGF-1 production by the tumor does not affect circulating levels. Thus, we believe that circulating levels of IGF-related peptides reflect disease severity in various conditions, but cannot guide therapeutic strategies. In contrast, determining of autocrine IGF-1 (and IGF-2) levels and the expression of the IGF-1R in the tumor might help to select patients who could benefit from (co-)treatment with an IGF-1R inhibitor. Moreover, IGF-1R expression may be diminished after treatment with chemotherapy, which has been shown in breast cancer patients,43,44 suggesting that the efficacy of an IGF-1R inhibitor after chemotherapy might be diminished.
In our study, high IGF-BP3 serum levels predicted better EFS. IGF-BP3, the synthesis of which is primarily stimulated by growth hormone, inhibits the bioavailability of IGF-1 and has direct antitumor effects.8,45 In Ewing sarcoma cells, binding of the EWS-FLI oncoprotein to the IGF-BP3 promoter inhibits autocrine IGF-BP3 production.3,4 Therefore, perhaps high circulating levels of IGF-BP3 lead to better survival of Ewing sarcoma patients due to the direct apoptotic and growth inhibitory effects in Ewing sarcoma cells. Alternatively, a decline of IGF-BP3 (along with IGF-1) may reflect an endocrine adaptation to severe disease.
We found that IGF-BP3 and IGF-2 serum levels increased during treatment with VIDE chemotherapy in Ewing sarcoma patients. Similarly, Kümmel et al46 observed that IGF-BP3 serum levels increase during anthracycline and taxane chemotherapy in breast cancer patients, and Gallego et al34 reported that IGF-BP3 serum levels increase during FOLFOX (Folinic acid, Fluorouracil and Oxaliplatin) or FOLFIRI (Folinic acid, Fluorouracil and Irinotecan) chemotherapy in colorectal cancer. Interestingly, in the latter study, IGF-BP3 serum levels increased when the tumor was stable or responding to therapy but declined upon disease progression.34 Although IGF-2 is three times more abundant in serum than IGF-1, our understanding of this protein is limited,47 but it is possible that the increase in serum IGF-BP3 and IGF-2 levels during treatment is a systemic reflection of (partial) disease recovery.
The sample size of our study is small, and the results clearly need validation in a larger cohort. However, our data suggest that high circulating levels of IGF-1 pathway components predict longer EFS in patients with Ewing sarcoma treated with VIDE chemotherapy. This observation apparently contrasts with data showing that autocrine production of IGF-1 by tumor tissue promotes tumor growth.5,8,47 A possible unifying explanation is that perhaps low circulating levels of the IGF-1 pathway components reflect an endocrine response to severe disease in contrast to the autocrine production of IGF-1 by tumor tissue that primarily determines tumor growth.34,48 This theory is consistent with findings, including those of this study, of increased circulating IGF-BP3/IGF-2 levels in the course of chemotherapy for various tumor types.34,46
Conclusion
High circulating levels of IGF-1 and IGF-BP3 at baseline appear to be a favorable indicator of outcome in Ewing sarcoma patients treated with chemotherapy. These findings suggest the need for further investigation of the value of the IGF-1 pathway as biomarker for treatment outcome and treatment target in Ewing sarcoma.
Acknowledgment
We gratefully acknowledge S Hendrickson for her help with English language editing.
Author contributions
JRK, HP, and HG contributed to study concept/design. JRK, HG, and SdG contributed to data acquisition. MF and SdG contributed to statistical analysis. MF, HP, JRK, and SdG contributed to manuscript preparation. All authors contributed toward data analysis, drafting and revising the paper and agree to be accountable for all aspects of the work.
Disclosure
The authors report no conflicts of interest in this work.
References
Ladenstein R, Potschger U, Le Deley MC, et al. Primary disseminated multifocal Ewing sarcoma: results of the Euro-EWING 99 trial. J Clin Oncol. 2010;28(20):3284–3291. | ||
Esiashvili N, Goodman M, Marcus RB Jr. Changes in incidence and survival of Ewing sarcoma patients over the past 3 decades: surveillance epidemiology and end results data. J Pediatr Hematol Oncol. 2008;30(6):425–430. | ||
Benini S, Zuntini M, Manara MC, et al. Insulin-like growth factor binding protein 3 as an anticancer molecule in Ewing’s sarcoma. Int J Cancer. 2006;119(5):1039–1046. | ||
Prieur A, Tirode F, Cohen P, Delattre O. EWS/FLI-1 silencing and gene profiling of Ewing cells reveal downstream oncogenic pathways and a crucial role for repression of insulin-like growth factor binding protein 3. Mol Cell Biol. 2004;24(16):7275–7283. | ||
Jones JI, Clemmons DR. Insulin-like growth factors and their binding proteins: biological actions. Endocr Rev. 1995;16(1):3–34. | ||
van Maldegem AM, Bovee JV, Peterse EF, Hogendoorn PC, Gelderblom H. Ewing sarcoma: the clinical relevance of the insulin-like growth factor 1 and the poly-ADP-ribose-polymerase pathway. Eur J Cancer. 2016;53:171–180. | ||
Renehan AG, Zwahlen M, Minder C, O’dwyer ST, Shalet SM, Egger M. Insulin-like growth factor (IGF)-I, IGF binding protein-3, and cancer risk: systematic review and meta-regression analysis. Lancet. 2004;363(9418):1346–1353. | ||
Pollak M. Insulin and insulin-like growth factor signalling in neoplasia. Nat Rev Cancer. 2008;8(12):915–928. | ||
Janknecht R. EWS-ETS oncoproteins: the linchpins of Ewing tumors. Gene. 2005;363:1–14. | ||
Stewart CE, Rotwein P. Growth, differentiation, and survival: multiple physiological functions for insulin-like growth factors. Physiol Rev. 1996;76(4):1005–1026. | ||
Ho AL, Schwartz GK. Targeting of insulin-like growth factor type 1 receptor in Ewing sarcoma: unfulfilled promise or a promising beginning? J Clin Oncol. 2011;29:4581–4583. | ||
Chaves J, Saif MW. IGF system in cancer: from bench to clinic. Anticancer Drugs. 2011;22(3):206–212. | ||
Iams WT, Lovly CM. Molecular pathways: clinical applications and future direction of insulin-like growth factor-1 receptor pathway blockade. Clin Cancer Res. 2015;21(19):4270–4277. | ||
Van der Woude HJ, Bloem JL, Taminiau AH, Nooy MA, Hogendoorn PC. Classification of histopathologic changes following chemotherapy in Ewing’s sarcoma of bone. Skeletal Radiol. 1994;23(7):501–507. | ||
Van der Woude HJ, Bloem JL, Holscher HC, et al. Monitoring the effect of chemotherapy in Ewing’s sarcoma of bone with MR imaging. Skeletal Radiol. 1994;23(7):493–500. | ||
Altman DG, McShane LM, Sauerbrei W, Taube SE. Reporting recommendations for tumor marker prognostic studies (REMARK): explanation and elaboration. PLoS Med. 2012;9:e1001216. | ||
Bidlingmaier M, Friedrich N, Emeny RT, et al. Reference intervals for insulin-like growth factor-1 (igf-i) from birth to senescence: results from a multicenter study using a new automated chemiluminescence IGF-I immunoassay conforming to recent international recommendations. J Clin Endocrinol Metab. 2014;99(5):1712–1721. | ||
Friedrich N, Wolthers OD, Arafat AM, et al. Age- and sex-specific reference intervals across life span for insulin-like growth factor binding protein 3 (IGFBP-3) and the IGF-I to IGFBP-3 ratio measured by new automated chemiluminescence assays. J Clin Endocrinol Metab. 2014;99(5):1675–1686. | ||
Rafferty B, Rigsby P, Gaines-Das RE. Multicentre collaborative study to calibrate IGF-II by bioassay and immunoassay: establishment of the First WHO Reference Reagent. Growth Horm IGF Res. 2001;11(1):18–23. | ||
Contal C, O’Quigley J. An application of changepoint methods in studying the effect of age on survival in breast cancer. Comput Stat Data Anal. 1999;30(3):253–270. | ||
Tunes-da-Silva G, Klein JP. Cutpoint selection for discretizing a continuous covariate for generalized estimating equations. Comput Stat Data Anal. 2011;55(1):226–235. | ||
Schemper M, Smith TL. A note on quantifying follow-up in studies of failure time. Control Clin Trials. 1996;17(4):343–346. | ||
The Comprehensive R Archive Network [homepage on the Internet]. Available from cran.r-project.org/. 2015. Accessed March 3, 2016. | ||
Cotterill SJ, Ahrens S, Paulussen M, et al. Prognostic factors in Ewing’s tumor of bone: analysis of 975 patients from the European Intergroup Cooperative Ewing’s Sarcoma Study Group. J Clin Oncol. 2000;18(17):3108–3114. | ||
Schumacher B, Garinis GA, Hoeijmakers JH. Age to survive: DNA damage and aging. Trends Genet. 2008;24(2):77–85. | ||
Scotlandi K, Manara MC, Serra M, et al. Expression of insulin-like growth factor system components in Ewing’s sarcoma and their association with survival. Eur J Cancer. 2011;47(8):1258–1266. | ||
Toretsky JA, Steinberg SM, Thakar M, et al. Insulin-like growth factor type 1 (IGF-1) and IGF binding protein-3 in patients with Ewing sarcoma family of tumors. Cancer. 2001;92(11):2941–2947. | ||
Shao YY, Huang CC, Lin SD, Hsu CH, Cheng AL. Serum insulin-like growth factor-1 levels predict outcomes of patients with advanced hepatocellular carcinoma receiving antiangiogenic therapy. Clin Cancer Res. 2012;18(14):3992–3997. | ||
Elmashad N, Ibrahim WS, Mayah WW, et al. Predictive value of serum insulin-like growth factor-1 in hepatocellular carcinoma. Asian Pac J Cancer Prev. 2015;16(2):613–619. | ||
Kaseb AO, Morris JS, Hassan MM, et al. Clinical and prognostic implications of plasma insulin-like growth factor-1 and vascular endothelial growth factor in patients with hepatocellular carcinoma. J Clin Oncol. 2011;29(29):3892–3899. | ||
Tas F, Karabulut S, Bilgin E, Tastekin D, Duranyildiz D. Clinical significance of serum insulin-like growth factor-1 (IGF-1) and insulin-like growth factor binding protein-3 (IGFBP-3) in patients with breast cancer. Tumour Biol. 2014;35(9):9303–9309. | ||
Tas F, Karabulut S, Serilmez M, Ciftci R, Duranyildiz D. Clinical significance of serum insulin-like growth factor-1 (IGF-1) and insulin-like growth factor binding protein-3 (IGFBP-3) in patients with epithelial ovarian cancer. Tumour Biol. 2014;35(4):3125–3132. | ||
Cho EJ, Lee JH, Yoo JJ, et al. Serum insulin-like growth factor-I level is an independent predictor of recurrence and survival in early hepatocellular carcinoma: a prospective cohort study. Clin Cancer Res. 2013;19(15):4218–4227. | ||
Gallego R, Codony-Servat J, Garcia-Albeniz X, et al. Serum IGF-I, IGFBP-3, and matrix metalloproteinase-7 levels and acquired chemo-resistance in advanced colorectal cancer. Endocr Relat Cancer. 2009;16(1):311–317. | ||
Huang YF, Cheng WF, Wu YP, Cheng YM, Hsu KF, Chou CY. Circulating IGF system and treatment outcome in epithelial ovarian cancer. Endocr Relat Cancer. 2014;21(2):217–229. | ||
Watanabe S, Tamura T, Ono K, et al. Insulin-like growth factor axis (insulin-like growth factor-I/insulin-like growth factor-binding protein-3) as a prognostic predictor of heart failure: association with adiponectin. Eur J Heart Fail. 2010;12(11):1214–1222. | ||
Jia T, Gama AT, Heimburger O, et al. IGF-1 and survival in ESRD. Clin J Am Soc Nephrol. 2014;9(1):120–127. | ||
Borinstein SC, Barkauskas DA, Krailo M, et al. Investigation of the insulin-like growth factor-1 signaling pathway in localized Ewing sarcoma: a report from the Children’s Oncology Group. Cancer. 2011;117(21):4966–4976. | ||
Yee D, Favoni RE, Lebovic GS, et al. Insulin-like growth factor I expression by tumors of neuroectodermal origin with the t(11;22) chromosomal translocation. A potential autocrine growth factor. J Clin Invest. 1990;86(6):1806–1814. | ||
Yee D, Paik S, Lebovic GS, et al. Analysis of insulin-like growth factor I gene expression in malignancy: evidence for a paracrine role in human breast cancer. Mol Endocrinol. 1989;3(3):509–517. | ||
Scotlandi K, Benini S, Sarti M, et al. Insulin-like growth factor I receptor-mediated circuit in Ewing’s sarcoma/peripheral neuroectodermal tumor: a possible therapeutic target. Cancer Res. 1996;56(20):4570–4574. | ||
Scartozzi M, Mandolesi A, Giampieri R, et al. Insulin-like growth factor 1 expression correlates with clinical outcome in K-RAS wild type colorectal cancer patients treated with cetuximab and irinotecan. Int J Cancer. 2010;127(8):1941–1947. | ||
de Groot S, Charehbili A, van Laarhoven HW, et al. Insulin-like growth factor 1 receptor expression and IGF1R 3129G > T polymorphism are associated with response to neoadjuvant chemotherapy in breast cancer patients: results from the NEOZOTAC trial (BOOG 2010-01). Breast Cancer Res. 2016;18(1):3. | ||
Heskamp S, Boerman OC, Molkenboer-Kuenen JD, et al. Upregulation of IGF-1R expression during neoadjuvant therapy predicts poor outcome in breast cancer patients. PLoS One. 2015;10(2):e0117745. | ||
Ali O, Cohen P, Lee KW. Epidemiology and biology of insulin-like growth factor binding protein-3 (IGFBP-3) as an anti-cancer molecule. Horm Metab Res. 2003;35(11–12):726–733. | ||
Kümmel S, Eggemann H, Luftner D, et al. Significant changes in circulating plasma levels of IGF1 and IGFBP3 after conventional or dose-intensified adjuvant treatment of breast cancer patients with one to three positive lymph nodes. Int J Biol Markers. 2007;22(3):186–193. | ||
Livingstone C. IGF2 and cancer. Endocr Relat Cancer. 2013;20(6):R321–R339. | ||
Steigen SE, Schaeffer DF, West RB, Nielsen TO. Expression of insulin-like growth factor 2 in mesenchymal neoplasms. Mod Pathol. 2009;22(7):914–921. |
 © 2017 The Author(s). This work is published and licensed by Dove Medical Press Limited. The full terms of this license are available at https://www.dovepress.com/terms.php and incorporate the Creative Commons Attribution - Non Commercial (unported, v3.0) License.
By accessing the work you hereby accept the Terms. Non-commercial uses of the work are permitted without any further permission from Dove Medical Press Limited, provided the work is properly attributed. For permission for commercial use of this work, please see paragraphs 4.2 and 5 of our Terms.
© 2017 The Author(s). This work is published and licensed by Dove Medical Press Limited. The full terms of this license are available at https://www.dovepress.com/terms.php and incorporate the Creative Commons Attribution - Non Commercial (unported, v3.0) License.
By accessing the work you hereby accept the Terms. Non-commercial uses of the work are permitted without any further permission from Dove Medical Press Limited, provided the work is properly attributed. For permission for commercial use of this work, please see paragraphs 4.2 and 5 of our Terms.