")
Back to Journals » Diabetes, Metabolic Syndrome and Obesity » Volume 14
Serum Fibroblast Growth Factor 23 Level and Liver Fat Content in MAFLD: A Community-Based Cohort
Authors Cao W, Xu Y, Shen Y, Wang Y, Ma X, Bao Y
Received 6 July 2021
Accepted for publication 16 September 2021
Published 29 September 2021 Volume 2021:14 Pages 4135—4143
DOI https://doi.org/10.2147/DMSO.S328206
Checked for plagiarism Yes
Review by Single anonymous peer review
Peer reviewer comments 2
Editor who approved publication: Professor Ming-Hui Zou
Weijie Cao,* Yiting Xu,* Yun Shen, Yufei Wang, Xiaojing Ma, Yuqian Bao
Department of Endocrinology and Metabolism, Shanghai Jiao Tong University Affiliated Sixth People’s Hospital; Shanghai Clinical Center for Diabetes; Shanghai Key Clinical Center for Metabolic Disease; Shanghai Diabetes Institute; Shanghai Key Laboratory of Diabetes Mellitus, Shanghai, 200233, People’s Republic of China
*These authors contributed equally to this work
Correspondence: Xiaojing Ma; Yuqian Bao
Department of Endocrinology and Metabolism, Shanghai Jiao Tong University Affiliated Sixth People’s Hospital, 600 Yishan Road, Shanghai, 200233, People’s Republic of China
Tel +86-21-64369181
Fax +86-21-64368031
Email [email protected]; [email protected]
Purpose: Although fibroblast growth factor-23 (FGF23) is involved in the development of metabolic diseases, its association with metabolic-associated fatty liver disease (MAFLD) remains unknown. We explored the relationship between serum fibroblast growth factor-23 level, metabolic associated fatty liver disease, and liver fat content.
Patients and Methods: Participants were enrolled from communities in Shanghai. Serum fibroblast growth factor-23 level was determined using two-side sandwich enzyme-linked immunosorbent assays. MAFLD was diagnosed using the international expert consensus (2020) criteria. Liver fat content was assessed using ultrasound.
Results: We enrolled 1827 individuals aged 30– 80 years (mean age, 59.4± 7.3 years). MAFLD was diagnosed in 445/1393 (31.9%) non-diabetic participants and 245/434 (56.5%) diabetic participants. After adjusting for confounders, one standard deviation increase in serum FGF23 was associated with MAFLD in diabetic (odds ratio, 1.27; 95% confidence interval, 1.15– 1.49; P< 0.001) and non-diabetic (odds ratio, 1.28; 95% confidence interval, 1.07– 1.74; P=0.030) groups. In a fully adjusted linear regression model, serum FGF23 emerged as a positive determinant of liver fat content in both diabetic and non-diabetic groups (P=0.039; P=0.034).
Conclusion: Participants with MAFLD had higher serum fibroblast growth factor-23 level than those without MAFLD, regardless of diabetes status. Serum fibroblast growth factor-23 was independently related to MAFLD and liver fat content.
Keywords: metabolism-associated fatty liver disease, fibroblast growth factor 23, liver fat content, diabetes
Introduction
Fibroblast growth factor-23 (FGF23), a member of the endocrine FGF family, is mainly expressed in osteocytes and osteoblasts in bone and binds to FGF receptors with the cofactor αKlotho to initiate downstream signaling events; thus, functioning as a circulating endocrine factor.1 FGF23 is considered a link between the bone and kidney to regulate mineral balance.2,3 Moreover, FGF23 plays a crucial role in the development of metabolic and cardiovascular diseases, including diabetes, obesity, and atherosclerosis.4–6 Previous experimental studies show that FGF23 is related to oxidative stress, inflammatory response, insulin resistance, and ectopic fat deposition through the inflammatory pathway.7,8 Clinical studies suggest that FGF23 is involved in the distribution and regulation of adipose tissue with an intensive relation to obesity and insulin resistance.9,10
Hepatic steatosis is one of the major etiologies of chronic liver disease with a global prevalence exceeding 25%.11 Before 2019, the international guideline defined “nonalcoholic fatty liver disease (NAFLD)” by excluding other causes of liver steatosis such as alcoholism, hepatitis virus infection, and pregnancy.12,13 With greater understanding of hepatic steatosis, growing evidence demonstrated that metabolic diseases contributed to the occurrence and development of fatty liver.14,15 However, the influence and interactions of metabolic diseases with hepatic steatosis could not be clarified using traditional diagnostic criteria. Therefore, an international expert consensus on fatty liver proposed the definition of metabolism related fatty liver disease (MAFLD) in 2020. The diagnosis was based on histology, imaging, or blood biomarkers of fat accumulation in the liver in addition to one of three criteria, namely, overweight/obesity, presence of type 2 diabetes mellitus (T2DM), or evidence of metabolic dysregulation.16
Existing evidence indicates that serum FGF23 level is strongly associated with metabolic diseases and fat distribution.9,17 Additionally, FGF23 is proven to be relevant to NAFLD in diabetic patients.18,19 However, the relation of serum FGF23 with MAFLD has not been reported in community population yet. This study aimed to explore the link between serum FGF23 level, MAFLD, and liver fat content (LFC) assessed by standardized ultrasound hepatic/renal ratio and hepatic attenuation rate in a community-based population.
Materials and Methods
Study Population
We enrolled participants from communities in Shanghai between October 2015 and July 2016. The collected data were derived from standardized questionnaires and included information on current and previous illnesses and medications, physical examinations, and biochemical measurements. Participants with a known history of cardiovascular or cerebrovascular diseases, malignant tumors or intracranial space occupying lesions, severe liver dysfunction, thyroid dysfunction, or hyperthyroidism/hypothyroidism treatment with steroids or thyroxine and an estimated glomerular filtration rate <60 mL/min/1.73 m2 were excluded. This study was approved by the Ethics Committee of the Sixth People’s Hospital Affiliated to Shanghai Jiao Tong University (approval number 2019-067). All participants provided written informed consent before participation. A total of 1827 eligible participants with complete data were recruited for the study. Individuals with diabetes were diagnosed according to the 2021 American Diabetes Association criteria.21
Anthropometric and Biochemical Measurements
Height, weight, waist circumference, and resting blood pressure were measured using the standardized methods.20 Body mass index (BMI) was calculated as weight (kg)/height2 (m2). The participants were examined on the morning following an overnight fast to collect their fasting blood samples. Thereafter, participants without diabetes underwent a 75-g oral glucose tolerance test, whereas those with diabetes took the 100-g steamed bread meal test. Biochemical variables, namely, fasting blood glucose (FPG), fasting insulin (FINS), total cholesterol (TC), triglycerides (TG), high-density lipoprotein cholesterol (HDL-C), low-density lipoprotein cholesterol (LDL-C), C-reactive protein (CRP), alanine aminotransferase (ALT), alanine aminotransferase (AST), alkaline phosphatase (ALP), glutamyl transferase (GGT), creatinine (CR), 2-hour blood glucose (2hPG), and glycated hemoglobin (HbA1c) were detected as previously described.14 Serum FGF23 level was determined using two-side sandwich enzyme-linked immunosorbent assays and fasting blood samples. The intra-assay and inter-assay coefficients of variations were 5.6% and 8.2%, respectively. The homeostasis model assessment of insulin resistance (HOMA-IR) was as follows: HOMA-IR=FINS (mU/L) ×FPG (mmol/L)/22.5.22
Diagnostic Criteria of MAFLD and Measurement of Liver Fat Content
MAFLD, in this study, was diagnosed in accordance with the international expert consensus statement on MAFLD in 2020.5 Liver fat accumulation was determined using liver ultrasound and the presence of any one of the following three conditions: overweight/obesity (BMI ≥23 kg/m2), presence of T2DM, or evidence of metabolic dysregulation. Metabolic dysfunction was defined as the presence of at least two of the following metabolic risk factors: (1) a waist circumference ≥90 cm in men and ≥80 cm in women; (2) blood pressure ≥130/85 mmHg or ongoing antihypertensive therapy; (3) TG ≥1.7 mmol/L or ongoing lipid-lowering therapy; (4) HDL-C <1 mmol/L for men and <1.3 mmol/L for women or ongoing drug therapy; (5) prediabetes, ie, an FPG of 5.6–6.9 mmol/L, a 2hPG of 7.8–11.0 mmol/L, or an HbA1c of 5.7%–6.4%; (6) HOMA-IR ≥2.5; and (7) plasma CRP level >2 mg/L.
All participants underwent abdominal ultrasonographic examination using a Voluson 730 Expert B-mode ultrasound machine (5.0-MHz transducer, GE Healthcare, Waukesha, WI, USA) by a trained sonographer, who was blind to the study design and clinical details of the participants. Fatty liver was diagnosed through ultrasonography with the presence of at least two of the following four findings:23 (1) diffusely increased echogenicity of the liver relative to the kidney or spleen, (2) ultrasound beam attenuation with decreased vessel signal, (3) poor visualization of intrahepatic structures, and (4) slightly enlarged liver with blunt margin. LFC, as an index of fat accumulation in the liver, was determined through an ultrasound fatty liver quantification. The regions of interest in the images captured by the ultrasound device were analyzed using image software certified by the National Institutes of Health (ImageJ 1.41o, National Institutes of Health, Bethesda, MD, USA). All the instrument settings, including “gain,” “depth,” and “time-gain compensation,” were fixed for each measurement. A 3D abdominal organ-mimicking phantom (Model 057; Computerized Imaging Reference Systems, Norfolk, VA) was used for standardization of the ultrasound hepatic/renal echo-intensity ratio and hepatic echo-intensity attenuation rate. LFC was then calculated based on the following equation: LFC = 62.592 × hepatic/renal echo-intensity ratio + 168.076 × hepatic echo-intensity attenuation rate − 27.863.24
Statistical Analyses
Data were analyzed using SPSS, version 20.0 (SPSS Inc, Chicago, IL, USA). All variables were tested for normality. Normally distributed variables are presented as mean ± standard deviation (SD), and non-normally distributed variables are presented as median and interquartile range. Student’s t-test was used to compare two groups with normal distribution whereas Wilcoxon rank sum test was used for comparing two groups with skewed distribution. Multivariable logistic regression was used to analyze the relationship between serum FGF23 level and MAFLD. The results of logistic regression analysis were expressed as odds ratio (OR) and 95% confidence interval (CI). Factors affecting LFC were investigated using multivariate linear regression. All P values were two-tailed tests, and P<0.05 was considered statistically significant.
Results
Clinical Characteristics of Study Subjects
A total of 1827 individuals including 740 men and 1087 women, aged between 30 and 80 years, with a mean age of 59.4±7.3 years, were enrolled. The serum FGF23 level was 37.2 ± 10.8 in all participants. Table 1 shows the characteristics of the participants according to their diabetes and MAFLD status. MAFLD was diagnosed in 445/1393 (31.9%) non-diabetic participants and 245/434 (56.5%) diabetic groups. Participants with MAFLD presented with significantly higher serum FGF23 level than those without MAFLD in both diabetic and non-diabetic groups (both P<0.05). LFC of the total population was 14.59±9.5%. In both the non-diabetic group and diabetic group, participants with MAFLD had a higher LFC than those without MAFLD (both P<0.05). The values of BMI, waist circumference, systolic and diastolic blood pressures, FPG, 2hPG, FINS, HbA1c, HOMA-IR, ALT, AST, ALP, GGT, TG, CRP, and LDL-C in participants with MAFLD were significantly higher than in those without MAFLD. Contrastingly, participants with MAFLD had lower HDL-C levels than did those without MAFLD in both diabetic and non-diabetic groups (all P<0.05).
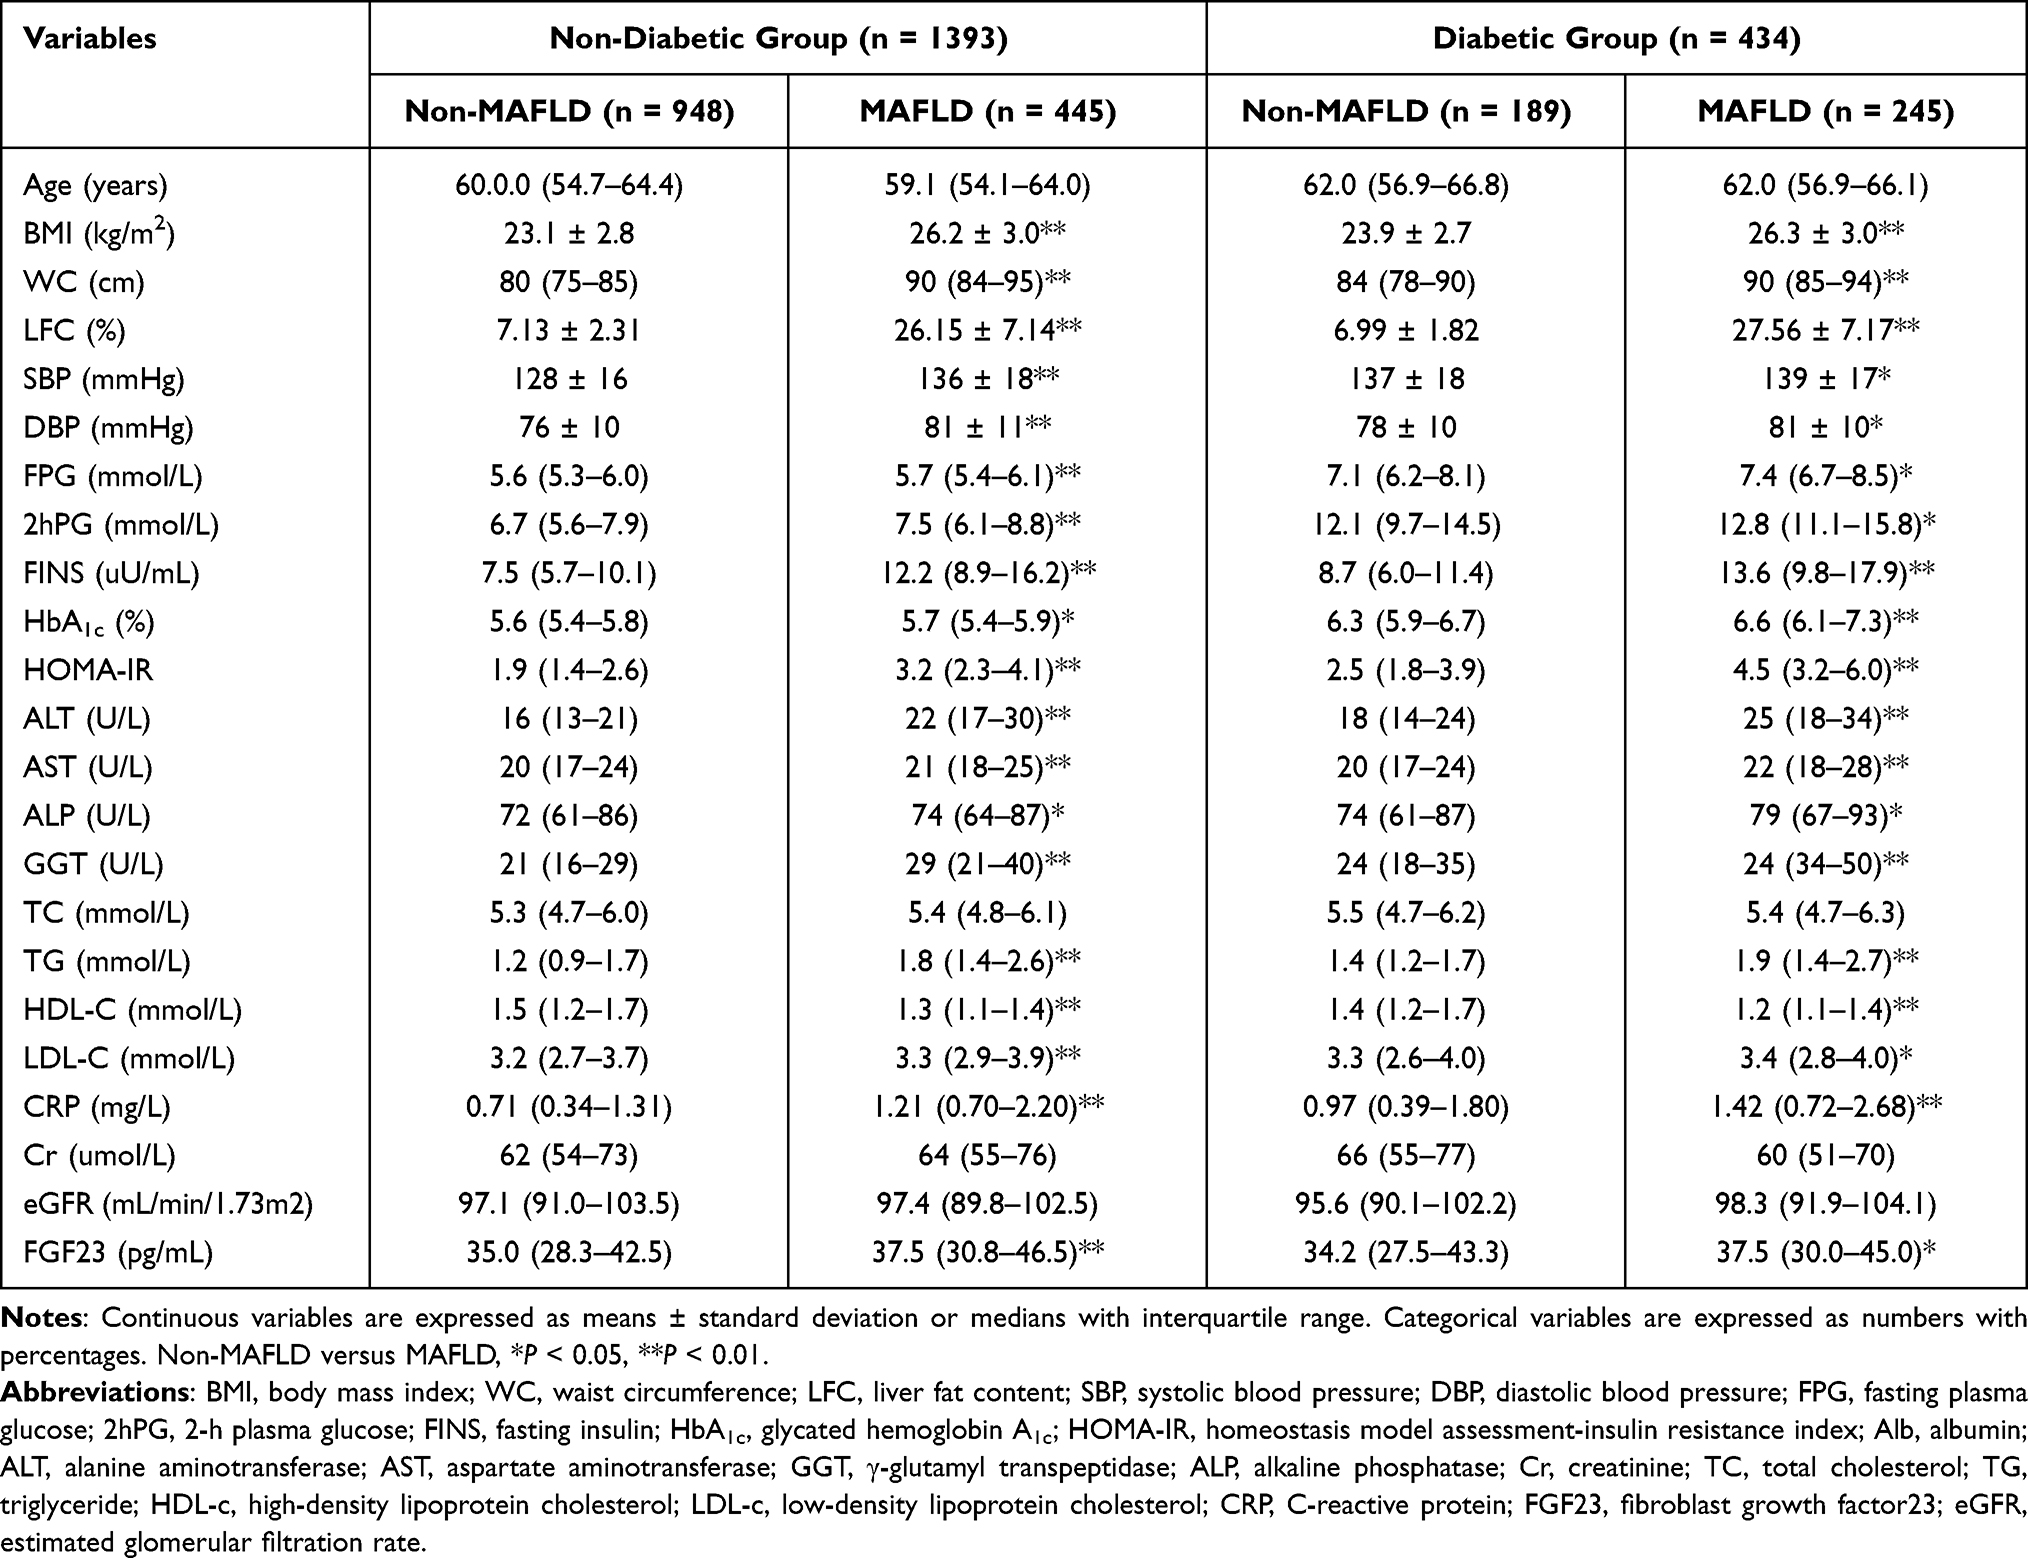 |
Table 1 Characteristics of the Study Subjects |
Associations Between Serum FGF23 and MAFLD
The sample was divided into three groups according to the tertiles of serum FGF23 level: T1, ≤30.8 ng/mL; T2, 30.9–40.8 ng/mL; and T3, >40.8 ng/mL. Overall, with increasing serum FGF23 level, the proportions of MAFLD in T1, T2, and T3 were 30.77%, 39.84%, and 42.86%, respectively, showing a significant upward trend (P for trend <0.01). Moreover, the LFC in T1, T2, and T3 increased to 12.8%, 14.7%, and 16.1%, respectively (P for trend <0.05). After stratifying the sample as per diabetes status, the proportions of MAFLD showed a significant upward trend in both diabetic and non-diabetic groups (both P for trend<0.05). In the diabetic group, the proportions of MAFLD in T1, T2, and T3 were 25.11%, 33.60%, and 37.23%, and the LFC were 11.7%, 13.5%, and 14.5%, respectively. In the non-diabetic group, the proportions of MAFLD were 48.3%, 59.0%, and 62.4%, and LFC were 16.3%, 18.8%, and 20.9% (Figure 1).
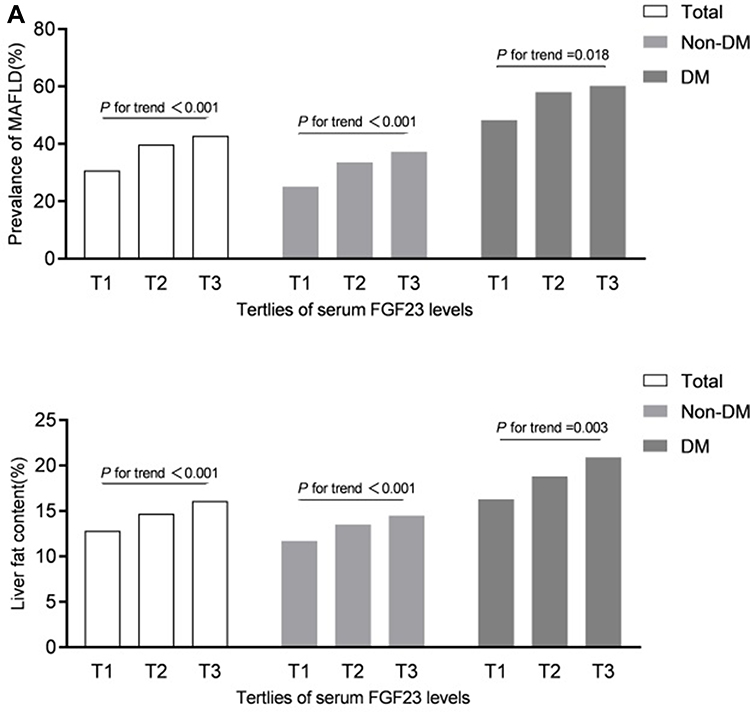 |
Figure 1 Prevalence of MAFLD (%) and liver fat content (%) according to tertiles of serum FGF23 level in total, non-diabetic and diabetic population. |
To further explore the association between serum FGF23 level and MAFLD, we performed a logistic regression analysis, in which the presence of MAFLD was designated as the dependent variable. In all subjects, model 1—a crude model—showed that for each one SD increment (corresponding to the actual value of 10.8 ng/mL) in serum FGF23, the OR for MAFLD was 1.32 (95% CI, 1.20–1.45; P<0.001). Model 2, which was adjusted for age, sex, smoking status, ALT, AST, ALP, and GGT, showed that for each one SD increment in serum FGF23, the OR for MAFLD was 1.23 (95% CI, 1.16–1.43; P<0.001). In model 3, which was further adjusted for TC, LDL-C, and CR, a reduction was noted in the association of per SD of serum FGF23 with the risk of MAFLD; however, the association remained significant in all participants (OR, 1.22; 95% CI, 1.12–1.17; P<0.001) (Table 2).
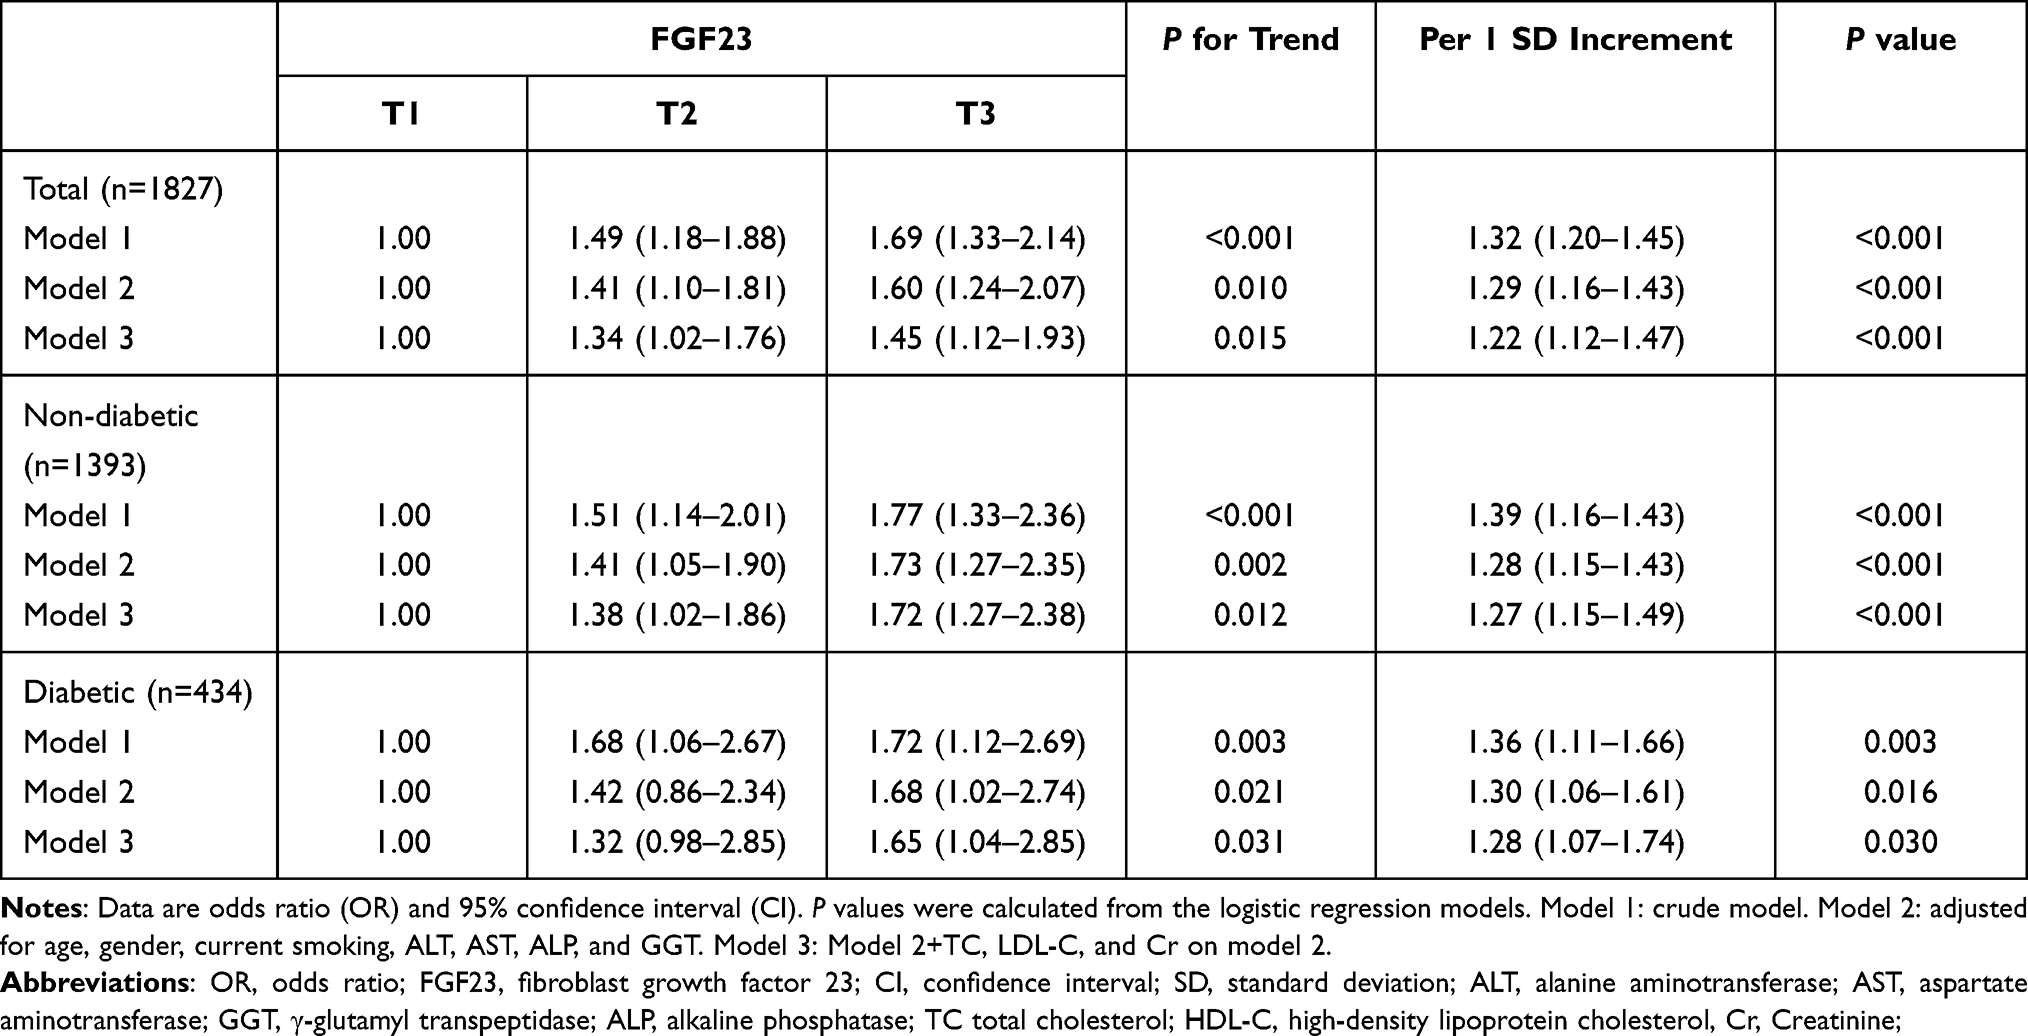 |
Table 2 Logistic Regression Analysis for the Association of Serum FGF23 Level and MAFLD |
Similarly, on stratifying the sample as per diabetes status and adjusting for all confounding factors (Model 3), each one SD increment in serum FGF23 level was significantly related to the risks of MAFLD in both non-diabetic (OR, 1.27; 95% CI, 1.15–1.49; P<0.001) and diabetic (OR, 1.28; 95% CI, 1.07–1.74; P=0.030) groups.
Analysis of Multiple Factors Affecting LFC
Partial correlation analysis showed that serum FGF23 level was positively correlated with LFC after adjustment for sex and age (r=0.162; P<0.001). Furthermore, multiple linear regression analysis was performed with LFC as the dependent variable and BMI, WC, ALT, AST, ALP, GGT, FPG, 2hPG, HOMA-IR, TG, HDL-C, LDL-C, CRP, and serum FGF23 as the independent variables. In addition to traditional risk factors such as BMI, WC, HDL-C, and HOMA-IR, serum FGF23 level influenced the LFC (standardized β=0.038; P=0.039) in the total population after further adjusting for presence of diabetes. Even on stratifying the sample as per diabetes status, serum FGF23 level remained an independent risk factor of LFC in non-diabetic (standardized β=0.036; P=0.039) and diabetic (standardized β=0.033; P=0.034) groups (Table 3).
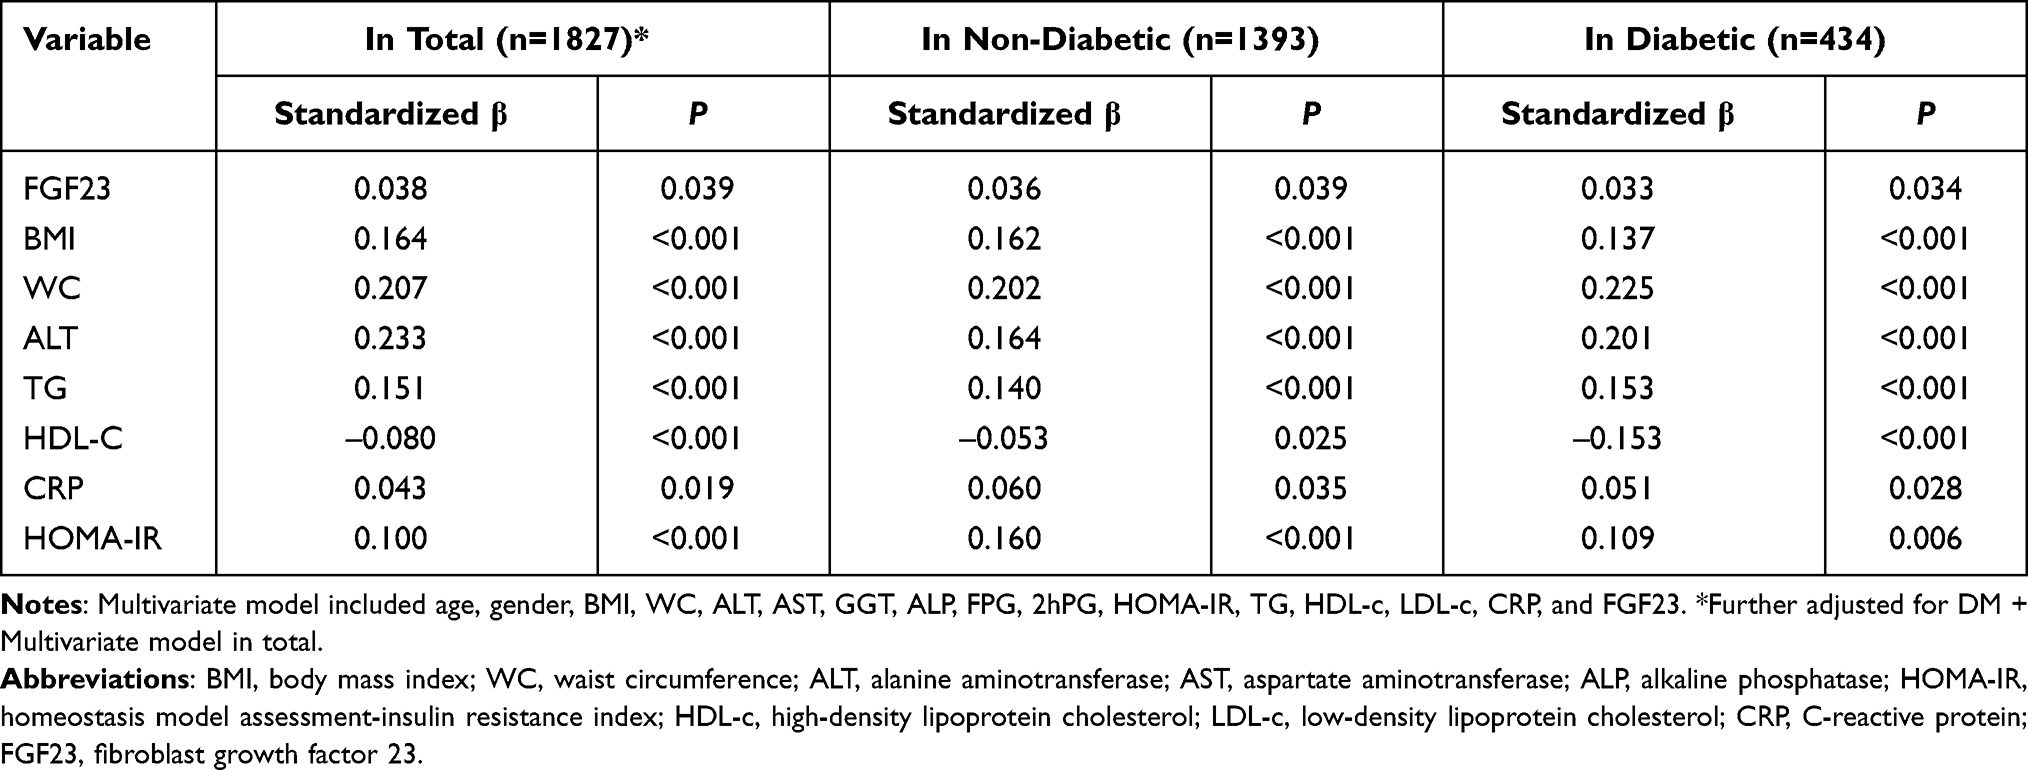 |
Table 3 Multivariate Regression Analyses Showing Factors Independently Associated with LFC |
Discussion
Our study findings show that participants with MAFLD had higher serum FGF23 level than those without MAFLD, regardless of their diabetes status. Serum FGF23 level was positively related to MAFLD and LFC, independent of other metabolic factors.
A new positive definition for the MAFLD was proposed by an international expert consensus in 2020. The expanded criteria of inclusion rather than exclusion are expected to provide a more comprehensive overview of the widespread hepatic steatosis disease and lay more emphasis on the contribution of metabolic diseases in the presence and progression of hepatic steatosis. The international expert consensus hopes to identify participants at early stages of metabolic dysfunction and higher risk of disease progression through this definition.16 Since the definition for MAFLD is a conceptional one, a retrospective study with population-based data from the National Health and Nutrition Examination Surveys in the United States from 1988 to 1994 showed that the definition of MAFLD was more practical than that of NAFLD for identifying participants with fatty liver disease with high risk of disease progression.25 Additionally, Huang et al analyzed the liver biopsy results of 166 patients with fatty liver and found that the novel diagnostic criteria for MAFLD could better identify those with a high degree of disease severity for early intervention than the previous NAFLD criteria.26 Moreover, a study which enrolled 765 Japanese patients revealed that using the definition of MAFLD rather than that of NAFLD led to better identification of liver stiffness evaluated by non-invasive methods including Fibro-Scan and FIB-4 index.27
Increasing evidence indicates the involvement of bone in the regulation of homeostasis including adiposity metabolism and energy balance. Through the interaction of bone-derived factors and adipocytokines, bone and adipose tissue establish a steady feedback system of homeostasis.28 FGF23 was considered to play a role in the regulation of fat accumulation and distribution as a factor mainly produced and secreted by osteoblasts and osteoclasts.29 Clinical studies demonstrate that serum FGF23 level are associated not only with overall obesity but also with central obesity. Moreover, it is believed that serum FGF23 level was related to the increase of fat mass and occurrence and development of metabolic syndrome and its components.9 Our previous study revealed that serum FGF23 level was independently associated with visceral fat accumulation.19
Ectopic fat distribution is a stronger determinant of metabolic health than increased fat mass itself.30 Increased liver fat content is closely related to insulin resistance, obesity, diabetes, and other metabolic dysfunctions.31,32 It is generally considered that magnetic resonance spectroscopy (MRS) is the best noninvasive way to detect liver fat content. In 2012, Xia et al proposed an improved method in assessing liver fat by ultrasound hepatic/renal echo-intensity ratio and ultrasound hepatic echo-intensity attenuation rate.24 It showed no significant difference between ultrasound and MRS in the LFC of moderate to severe fatty liver. Difference of estimated liver fat contents between different ultrasound machines and operators was reasonably well. Thus, computer-aided US is a valid method to estimate liver fat content and can be applied extensively after standardization of ultrasound quantitative parameters. Moreover, Li et al found that LFC assessed by ultrasound was positively correlated with subclinical atherosclerosis and bone density in middle-aged and elderly people recruited from communities.33,34
Previous studies have established the correlation between FGF23 and NAFLD in diabetic inpatients. He et al have exhibited a positive correlation of serum FGF23 level with NAFLD and fatty liver index in 331 diabetic inpatients,17 and Hu et al have found that serum FGF23 level was positively correlated with the presence and severity of NAFLD using Fibro-Scan to evaluate hepatic steatosis in 296 diabetic inpatients.18 Since the concept of MAFLD was proposed recently, the correlation between serum FGF23 level and MAFLD remains unclear and only inpatients with diabetes have been included in previous studies that examine this association. We selected a large sample of participants (n=1827) from the community and we found that per SD increase in serum FGF23 was associated with a higher risk of MAFLD (19%) after adjusting for age, sex, liver enzymes, and metabolism indices. Additionally, this association persisted in the sample even after stratifying it into non-diabetic (n=1393) and diabetic (n=434) groups.
Fatty liver is one of the manifestations of liver fat deposition. Ultrasound can quantify LFC to evaluate hepatic steatosis.24,35 We revealed that serum FGF23 was a positive risk factor for LFC after adjusting for age, sex, and metabolic indicators. Similar results were found in participants with or without diabetes. Previous studies show that serum FGF23 is related to the distribution of visceral adiposity.8,19 FGF 1C, a potential receptor of FGF23, is highly expressed in macrophages, known as Kupffer cells in the liver, and increases fat deposition in the liver via increased activity of diacylglycerol transferase when polarized to the M1 phenotype.36 Xu et al have revealed that FGF receptor inhibitor could increase the level of FGF23 and activate the phosphorylation of JAK2, whereas anti-FGF23 could inhibit its phosphorylation. The activation of JAK/STAT signaling pathway is involved in insulin resistance and triglyceride accumulation in the liver.7 The emerging evidence shows that the activation of JAK1/STAT3 signaling pathway leads to liver inflammation and liver fat deposition, which can significantly increase the synthesis of FGF23 in the liver, suggesting a bidirectional effect between liver fat deposition and FGF23.37
To the best of our knowledge, this is the first study of the associations of serum FGF23 level and MAFLD. However, this study had a few limitations. First, the study population only included participants from the Shanghai community, limiting the generalizability of the findings. Second, the cross-sectional design of the study could not determine the causal relationship between increased serum FGF23 level and MAFLD. Therefore, further large-scale, prospectively designed studies are needed. Third, compared with the constantly updated detection methods (such as fibro scan), abdominal ultrasound may miss mild fatty liver. In addition, serum iron and ferritin were not collected in our study, and hemochromatosis could not be ruled out. Moreover, Vit D was strongly related to FGF23; it was a pity that we did not collect the date of Vit D.
In conclusion, serum FGF23 level was positively correlated with MAFLD and LFC in both non-diabetic and diabetic populations, suggesting that serum FGF23 is a supplementary biomarker for screening MAFLD.
Data Sharing Statement
The data used to support the findings of this study are available from the corresponding author upon request.
Ethical Approval and Informed Consent
The study was approved by the Ethics Committee of Shanghai Jiao Tong University Affiliated Sixth People’s Hospital, and all procedures were performed in accordance with the 1964 Declaration of Helsinki and its later amendments or comparable ethical standards. The study methods and potential risks were fully explained to all participants, and each participant provided a written informed consent prior to enrollment.
Funding
This work was funded by the Shanghai Municipal Science and Technology Commission Medical Guide Project (19411964300).
Disclosure
The authors declare that they have no conflicts of interest.
References
1. Chen G, Liu Y, Goetz R, et al. α-Klotho is a non-enzymatic molecular scaffold for FGF23 hormone signalling. Nature. 2018;553(7689):461–466. doi:10.1038/nature25451
2. D’Arrigo G, Pizzini P, Cutrupi S, et al. FGF23 and the PTH response to paricalcitol in chronic kidney disease. Eur J Clin Invest. 2020;50(2):e13196. doi:10.1111/eci.13196
3. Musgrove J, Wolf M. Regulation and effects of FGF23 in chronic kidney disease. Annu Rev Physiol. 2020;82(1):365–390. doi:10.1146/annurev-physiol-021119-034650
4. Dokumacioglu E, Iskender H, Musmul A. Effect of hesperidin treatment on α-Klotho/FGF-23 pathway in rats with experimentally-induced diabetes. Biomed Pharmacother. 2019;109:1206–1210. doi:10.1016/j.biopha.2018.10.192
5. Chirinos JA, Orlenko A, Zhao L, et al. Multiple plasma biomarkers for risk stratification in patients with heart failure and preserved ejection fraction. J Am Coll Cardiol. 2020;75(11):1281–1295. doi:10.1016/j.jacc.2019.12.069
6. Rodríguez-Ortiz ME, Alcalá-Díaz JF, Canalejo A; The CORDIOPREV study, et al. Fibroblast growth factor 23 predicts carotid atherosclerosis in individuals without kidney disease. Eur J Intern Med. 2020;74:79–85. doi:10.1016/j.ejim.2019.12.008
7. Xu L, Zhang L, Zhang H, et al. The participation of fibroblast growth factor 23 (FGF23) in the progression of osteoporosis via JAK/STAT pathway. J Cell Biochem. 2018;119(5):3819–3828. doi:10.1002/jcb.26332
8. Hu X, Ma X, Luo Y, et al. Contribution of fibroblast growth factor 23 to Framingham risk score for identifying subclinical atherosclerosis in Chinese men. Nutr Metab Cardiovasc Dis. 2017;27(2):147–153. doi:10.1016/j.numecd.2016.11.009
9. Streicher C, Zeitz U, Andrukhova O, et al. Long-term Fgf23 deficiency does not influence aging, glucose homeostasis, or fat metabolism in mice with a nonfunctioning vitamin D receptor. Endocrinology. 2012;153(4):1795–1805. doi:10.1210/en.2011-1878
10. Ursem SR, Vervloet MG, Büttler RM, et al. The interrelation between FGF23 and glucose metabolism in humans. J Diabetes Complications. 2018;32(9):845–850. doi:10.1016/j.jdiacomp.2018.06.013
11. Younossi ZM. Non-alcoholic fatty liver disease-A global public health perspective. J Hepatol. 2019;70(3):531–544. doi:10.1016/j.jhep.2018.10.033
12. European Association for the Study of the Liver (EASL); European Association for the Study of Diabetes (EASD); European Association for the Study of Obesity (EASO). EASL-EASD-EASO clinical practice guidelines for the management of non-alcoholic fatty liver disease. J Hepatol. 2016;64(6):1388–1402. doi:10.1016/j.jhep.2015.11.004.
13. Chalasani N, Younossi Z, Lavine JE, et al. The diagnosis and management of nonalcoholic fatty liver disease: practice guidance from the American association for the study of liver diseases. Hepatology. 2018;67(1):328–357. doi:10.1002/hep.29367
14. Khan RS, Bril F, Cusi K, Newsome PN. Modulation of insulin resistance in nonalcoholic fatty liver disease. Hepatology. 2019;70(2):711–724. doi:10.1002/hep.30429
15. Bernstein DE. Nonalcoholic fatty liver disease: an expanding health care epidemic. Clin Liver Dis. 2018;22(1):xiii–xiv. doi:10.1016/j.cld.2017.10.001
16. Eslam M, Newsome PN, Sarin SK, et al. A new definition for metabolic dysfunction-associated fatty liver disease: an international expert consensus statement. J Hepatol. 2020;73(1):202–209. doi:10.1016/j.jhep.2020.03.039
17. He X, Shen Y, Ma X, et al. The association of serum FGF23 and non-alcoholic fatty liver disease is independent of vitamin D in type 2 diabetes patients. Clin Exp Pharmacol Physiol. 2018;45(7):668–674. doi:10.1111/1440-1681.12933
18. Hu X, Yang L, Yu W, et al. Association of serum fibroblast growth factor 23 levels with the presence and severity of hepatic steatosis is independent of sleep duration in patients with diabetes. Diabetes Metab Syndr Obes. 2020;13:1171–1178. doi:10.2147/DMSO.S241348
19. Wagner CA, Imenez Silva PH, Rubio-Aliaga I. And the fat lady sings about phosphate and calcium. Kidney Int. 2017;91(2):270–272. doi:10.1016/j.kint.2016.11.009
20. Xu Y, Ma X, Pan X, He X, Wang Y, Bao Y. Serum adipocyte fatty acid-binding protein levels: an indicator of non-alcoholic fatty liver disease in Chinese individuals. Liver Int. 2019;39(3):568–574. doi:10.1111/liv.14021
21. American Diabetes Association. Standards of medical care in diabetes–2010. Diabetes Care. 2010;33(Suppl1):S11–S61. doi:10.2337/dc10-S011.
22. Matthews DR, Hosker JP, Rudenski AS, Naylor BA, Treacher DF, Turner RC. Homeostasis model assessment: insulin resistance and beta-cell function from fasting plasma glucose and insulin concentrations in man. Diabetologia. 1985;28(7):412–419. doi:10.1007/BF00280883
23. Agbim U, Asrani SK. Non-invasive assessment of liver fibrosis and prognosis: an update on serum and elastography markers. Expert Rev Gastroenterol Hepatol. 2019;13(4):361–374. doi:10.1080/17474124.2019.1579641
24. Xia MF, Yan HM, He WY, et al. Standardized ultrasound hepatic/renal ratio and hepatic attenuation rate to quantify liver fat content: an improvement method. Obesity. 2012;20(2):444–452. doi:10.1038/oby.2011.302
25. Lin S, Huang J, Wang M, et al. Comparison of MAFLD and NAFLD diagnostic criteria in real world. Liver Int. 2020;40(9):2082–2089. doi:10.1111/liv.14548
26. Huang SC, Su HJ, Kao JH, et al. Clinical and histologic features of patients with biopsy-proven metabolic dysfunction-associated fatty liver disease. Gut Liver. 2021;15(3):451–458. doi:10.5009/gnl20218
27. Yamamura S, Eslam M, Kawaguchi T, et al. MAFLD identifies patients with significant hepatic fibrosis better than NAFLD. Liver Int. 2020;40(12):3018–3030. doi:10.1111/liv.14675
28. Fukumoto S, Martin TJ. Bone as an endocrine organ. Trends Endocrinol Metab. 2009;20(5):230–236. doi:10.1016/j.tem.2009.02.001
29. Mirza MA, Alsiö J, Hammarstedt A, et al. Circulating fibroblast growth factor-23 is associated with fat mass and dyslipidemia in two independent cohorts of elderly individuals. Arterioscler Thromb Vasc Biol. 2011;31(1):219–227. doi:10.1161/ATVBAHA.110.214619
30. Blüher M. Metabolically healthy obesity. Endocr Rev. 2020;41(3):405–420. doi:10.1210/endrev/bnaa004
31. Stefan N, Schick F, Häring HU. Causes, characteristics, and consequences of metabolically unhealthy normal weight in humans. Cell Metab. 2017;26(2):292–300. doi:10.1016/j.cmet.2017.07.008
32. Blüher M. Adipose tissue dysfunction contributes to obesity related metabolic diseases. Best Pract Res Clin Endocrinol Metab. 2013;27(2):163–177. doi:10.1016/j.beem.2013.02.005
33. Li X, Xia M, Ma H, et al. Liver fat content is associated with increased carotid atherosclerosis in a Chinese middle-aged and elderly population: the Shanghai Changfeng study. Atherosclerosis. 2012;224(2):480–485. doi:10.1016/j.atherosclerosis.2012.07.002
34. Xia MF, Lin HD, Yan HM, et al. The association of liver fat content and serum alanine aminotransferase with bone mineral density in middle-aged and elderly Chinese men and postmenopausal women. J Transl Med. 2016;14(1):11. doi:10.1186/s12967-016-0766-3
35. Xia M, Sun X, Zheng L, et al. Regional difference in the susceptibility of non-alcoholic fatty liver disease in China. BMJ Open Diabetes Res Care. 2020;8(1):e001311. doi:10.1136/bmjdrc-2020-001311
36. Masuda Y, Ohta H, Morita Y, et al. Expression of Fgf23 in activated dendritic cells and macrophages in response to immunological stimuli in mice. Biol Pharm Bull. 2015;38(5):687–693. doi:10.1248/bpb.b14-00276
37. Daryadel A, Ruiz PA, Gehring N, et al. Systemic Jak1 activation provokes hepatic inflammation and imbalanced FGF23 production and cleavage. FASEB J. 2021;35(2):e21302. doi:10.1096/fj.202002113R
 © 2021 The Author(s). This work is published and licensed by Dove Medical Press Limited. The full terms of this license are available at https://www.dovepress.com/terms.php and incorporate the Creative Commons Attribution - Non Commercial (unported, v3.0) License.
By accessing the work you hereby accept the Terms. Non-commercial uses of the work are permitted without any further permission from Dove Medical Press Limited, provided the work is properly attributed. For permission for commercial use of this work, please see paragraphs 4.2 and 5 of our Terms.
© 2021 The Author(s). This work is published and licensed by Dove Medical Press Limited. The full terms of this license are available at https://www.dovepress.com/terms.php and incorporate the Creative Commons Attribution - Non Commercial (unported, v3.0) License.
By accessing the work you hereby accept the Terms. Non-commercial uses of the work are permitted without any further permission from Dove Medical Press Limited, provided the work is properly attributed. For permission for commercial use of this work, please see paragraphs 4.2 and 5 of our Terms.