")
Back to Journals » Diabetes, Metabolic Syndrome and Obesity » Volume 15
Serum Fibrinogen-Like Protein 1 Levels in Obese Patients Before and After Laparoscopic Sleeve Gastrectomy: A Six-Month Longitudinal Study
Authors Dilimulati D, Du L, Huang X, Jayachandran M, Cai M, Zhang Y, Zhou D, Zhu J, Su L, Zhang M, Qu S
Received 14 May 2022
Accepted for publication 7 August 2022
Published 17 August 2022 Volume 2022:15 Pages 2511—2520
DOI https://doi.org/10.2147/DMSO.S374011
Checked for plagiarism Yes
Review by Single anonymous peer review
Peer reviewer comments 2
Editor who approved publication: Prof. Dr. Antonio Brunetti
Diliqingna Dilimulati,* Lei Du,* Xiu Huang,* Muthukumaran Jayachandran, Meili Cai, Yuqin Zhang, Donglei Zhou, Jiangfan Zhu, Lili Su, Manna Zhang, Shen Qu
Department of Endocrinology and Metabolism, Shanghai Tenth People’s Hospital, School of Medicine, Tongji University, Shanghai, 200072, People’s Republic of China
*These authors contributed equally to this work
Correspondence: Shen Qu; Manna Zhang, Department of Endocrinology and Metabolism, Shanghai Tenth People’s Hospital, 301 Middle Yanchang Road, Shanghai, 200072, People’s Republic of China, Tel +8602166301004 ; +8613774448495, Email [email protected]; [email protected]
Purpose: Fibrinogen-like protein (FGL)-1 is an original hepatokine with a critical role in developing hepatic steatosis. This study intends to examine the pre- and postoperative serum FGL-1 levels in bariatric patients and identify its relationship with other clinical indicators.
Patients and Methods: Ninety-two individuals (60 bariatric patients and 32 people with normal weight) were enrolled in this research between July 2018 and April 2021. All bariatric patients finished follow-up visits 6 months after laparoscopic sleeve gastrectomy (LSG). Clinical data, anthropometric parameters, biochemical variables, FibroScan, and serum FGL-1 levels were collected at baseline and 6 months after LSG.
Results: FGL-1 levels in patients with obesity (44.66± 20.03 ng/mL) were higher than in individuals with normal weight (20.73± 9.73 ng/mL, p < 0.001). After LSG, FGL-1 levels were significantly decreased (27.53± 11.45 ng/mL, p < 0.001). Besides, body mass index (BMI), liver enzyme levels, glucose metabolism, lipid metabolism, uric acid (UA), controlled attenuation parameter (CAP), and liver stiffness measurement (LSM) were significantly improved. After adjusting possible confounders, FGL-1 levels at baseline were negatively associated with changes in LSM levels; changes in FGL-1 levels showed positive correlations with changes in alanine aminotransferase (ALT), aspartate aminotransferase (AST) and UA levels at 6 months after surgery.
Conclusion: Serum FGL-1 levels were significantly decreased following LSG in patients with obesity. The preoperative serum FGL-1 levels could be a predictor of postoperative liver fibrosis improvement. Furthermore, the decreased FGL-1 levels were associated with improved liver enzymes and UA but not with bodyweight or glucolipid metabolism.
Keywords: obesity, fibrinogen-like protein 1, liver fibrosis, laparoscopic sleeve gastrectomy
Introduction
With the global incidence of obesity rising dramatically over the past 40 years, obesity has been a crucial growing concern.1 Obesity increases the risk of developing sleep apnea syndrome, hyperuricemia, non-alcoholic fatty liver (NAFLD), and type 2 diabetes mellitus (T2DM).2 All these conditions can be alleviated by losing weight.3 In long-term clinical trials, bariatric surgery is a valid weight-loss method for patients.4 Among different types of operations, one of the most widely used is the laparoscopic sleeve gastrectomy (LSG).5 LSG has been shown to reduce insulin resistance by reducing adipose tissue and obesity-related inflammation, as well as changes in gastrointestinal hormones and adipokines.6 In addition to altering adipokines, bariatric surgery also regulates myokines and hepatokines.7 It’s been shown that bariatric surgery alters many hepatokines, such as angiopoietin-like protein 6 (ANGPTL-6), selenoprotein P (SeP), fetuin-A, and fibroblast growth factor 21 (FGF-21).8–10
Fibrinogen-like protein (FGL)-1 is a hepatokines secreted by the liver, which is otherwise known as hepassocin.11 FGL-1 has a similar structure to angiopoietin-like factors (ANGPTLs), which modulate energy utilization and lipid metabolism.12 Also, FGL-1 regulates hepatocyte proliferation and liver regeneration, as well as involves in regulating lipid metabolism and the progression of several cancer types.13,14 Previous cross-sectional studies found serum FGL-1 levels elevated in conditions including NAFLD, pre-diabetes, T2DM, gestational diabetes mellitus (GDM), and obesity.15–18 Furthermore, by increasing the extracellular phosphorylation of signal-regulated kinase 1/2 (ERK1/2), FGL-1 promotes hepatic lipogenesis, insulin resistance, and adipogenesis.15,18 In addition, FGL-1 has also been involved in the insulin resistance of skeletal muscle through EGFR/JNK-mediated pathway.19 Taken together, these studies suggest that FGL-1 is a valuable biomarker for metabolic dysregulation and obesity.
Despite this, research on the effects of LSG on FGL-1 levels has been limited. Therefore, this present study aims to determine FGL-1 levels in bariatric patients before and after LSG and further validate the relationship between serum FGL-1 levels and metabolic parameters.
Materials and Methods
Study Population
Between July 2018 and April 2021, ninety-two individuals (32 individuals with normal weight and 60 patients with obesity that underwent LSG) were enrolled at Shanghai Tenth People’s Hospital. The inclusion criteria of bariatric patients: 1) age 15–65 years, 2) BMI ≥ 35 kg/m2 or BMI ≥ 30 kg/m2 with at least 2 obesity-associated comorbidities.20 The exclusion criteria of bariatric patients: 1) presence of endocrine diseases causing obesity (such as Cushing syndrome, primary hypothyroidism, primary hypogonadism, and hypothalamic diseases); 2) serum aspartate aminotransferase (AST) or alanine aminotransferase (ALT) levels were more than twofold the normal limit that was caused by chronic liver diseases such as virus hepatitis, autoimmune hepatitis, and alcoholic liver disease; 3) heart failure with left ventricular ejection fraction (LVEF) < 50%, cardiovascular diseases, cardiovascular instability, and myocardial infarction during the past 6 months; 4) serum creatinine (Cr) levels > 133 μmol/L and acute/chronic nephritis; 5) use of medications (such as metformin, glucagon-like peptide 1, sodium-glucose cotransporter-2 inhibitor, and orlistat) that affect body weight; 6) severe psychiatric diseases. During the same period, thirty-two age-matched healthy adults with normal weight (BMI range from 18.5 to 24) were recruited from the medical examination center. The exclusion criteria of normal weight individuals: 1) any chronic diseases (such as diabetes, dyslipidemia, and hypertension); 2) presence of malignant tumors, autoimmune diseases, and infectious diseases; 3) any medication use; 4) clinical or laboratory data missing. This study complies with the principles of the Declaration of Helsinki, and the Ethics Committee approved the research protocol of Shanghai Tenth People’s Hospital, and the clinical trial registration number is NCT04548232. Informed consent was obtained from all participants, and for patients under 18 years old, parental consent and participant assent were obtained.
Anthropometric and Biochemical Measurements
All patients with obesity had an integrated examination preoperatively and followed up at 6 months post-surgery. Professional instruments accurately measured the height and weight of all patients and calculated their body mass index (BMI). After the participants sat quietly for 15 minutes, blood pressure was measured twice properly and the average was used for analysis. All blood samples were taken after 12 hours of fasting. The biochemical parameters detected as follows: ALT, AST, γ-glutamyl transpeptidase (γGT), fasting plasma glucose (FPG), fasting insulin (FINS), glycosylated hemoglobin A1 (HbA1c), total cholesterol (TC), triglycerides (TG), high-density lipoprotein cholesterol (HDL-c), low-density lipoprotein cholesterol (LDL-c), uric acid (UA), Cr, blood urea nitrogen (BUN). Homeostasis model assessment of insulin resistance (HOMA-IR) calculated by FPG (mmol/L) × FINS (mU/L)/22.5.21 As described in previous studies, liver steatosis and fibrosis were indicated with controlled attenuation parameter (CAP) and liver stiffness measurement (LSM) by FibroScan.22 The serum FGL-1 levels were quantified according to the instruction manual using a human FGL-1 enzyme-linked immunosorbent assay kit (Cusabio, Wuhan, China). Diabetes was defined by FPG ≥ 7.0 mmol/L, and/or HbA1c ≥ 6.5%, and/or 2-hour postprandial blood glucose ≥ 11.1 mmol/L, and/or previous diagnosis of diabetes. Dyslipidemia was defined by LDL-c ≥ 4.14 mmol/L, and/or HDL-c < 1.04 mmol/L, and/or TG ≥ 2.26 mmol/L, and/or previous diagnosis of dyslipidemia. Hypertension was defined as SBP ≥ 140 mmHg and/or DBP ≥ 90 mmHg, or previous diagnosis of hypertension.23
Sample Size Calculation and Statistical Analysis
Based on the previous literature,24 the assumed mean difference in FGL-1 levels of at least 1600 pg/mL (±1500) between obese participants and normal-weight participants, and the power analysis showed that a minimum of 24 participants for each group was required to achieve a significant outcome (alpha = 0.05, power = 0.95) using the online calculator provided by the Massachusetts General Hospital Mallinckrodt General Clinical Research Center (http://hedwig.mgh.harvard.edu/sample_size/size.html). SPSS statistical software version 25.0 was used for statistical analysis. Data are shown as mean ± standard deviation (SD) on account many variables are normally distributed, and the independent-samples t-test was applied to evaluate differences between normally distributed variables. In the meanwhile, the categorical variables are expressed as percentages, and the differences between categorical variables were analyzed by the chi-square test. A standard t-test was performed to compare the conditions pre- and post-surgery. Pearson’s correlation coefficient was applied to investigate the relationship between FGL-1 levels and other indices at baseline. Multiple linear regression was performed to assess the association between FGL-1 levels at baseline and changes in LSM. Further, multiple linear regression was used to evaluate the relationship between changes in FGL-1 levels and changes in other parameters. A p-value < 0.05 was considered significant.
Results
Clinical Characteristics of the Individuals at Baseline
Among 257 bariatric patients, 60 patients (16 men and 44 women) who met the inclusion and exclusion criteria were included in this study, and other 32 individuals with normal weight were enrolled in the control group (Figure 1). As shown in Table 1, basic anthropometric examination data, biochemical indices, and serum FGL-1 levels were summarized. Between the obese and normal-weight groups, the average age and gender distribution were similar. The BMI of healthy controls was 20.75±1.73 kg/m2, and that of the obesity group was 39.84±6.10 kg/m2. Compared to individuals with normal weight, patients with obesity had significantly higher FPG, FINS, HOMA-IR, SBP, DBP, ALT, AST, γGT, TG, UA levels, and lower HDL-c levels (all p<0.05). In addition, concentrations of serum FGL-1 in the obese group were significantly higher than that in the normal group (44.66±20.03 vs 20.73±9.73 ng/mL, p<0.001). Before surgery, 27 bariatric patients (45%) had diabetes, 36 bariatric patients (60%) had dyslipidemia, and 24 bariatric patients (40%) had hypertension. In addition, 21 of the 60 bariatric patients received medications, including 8 patients (13.33%) were treated with hypoglycemic drugs, 11 patients (18.33%) were treated with antihypertensive drugs, 4 patients (6.67%) were treated with euthyrox, 3 patients (5%) were treated with Diane-35, and 1 patient (1.6%) was treated with hypolipidemic drugs.
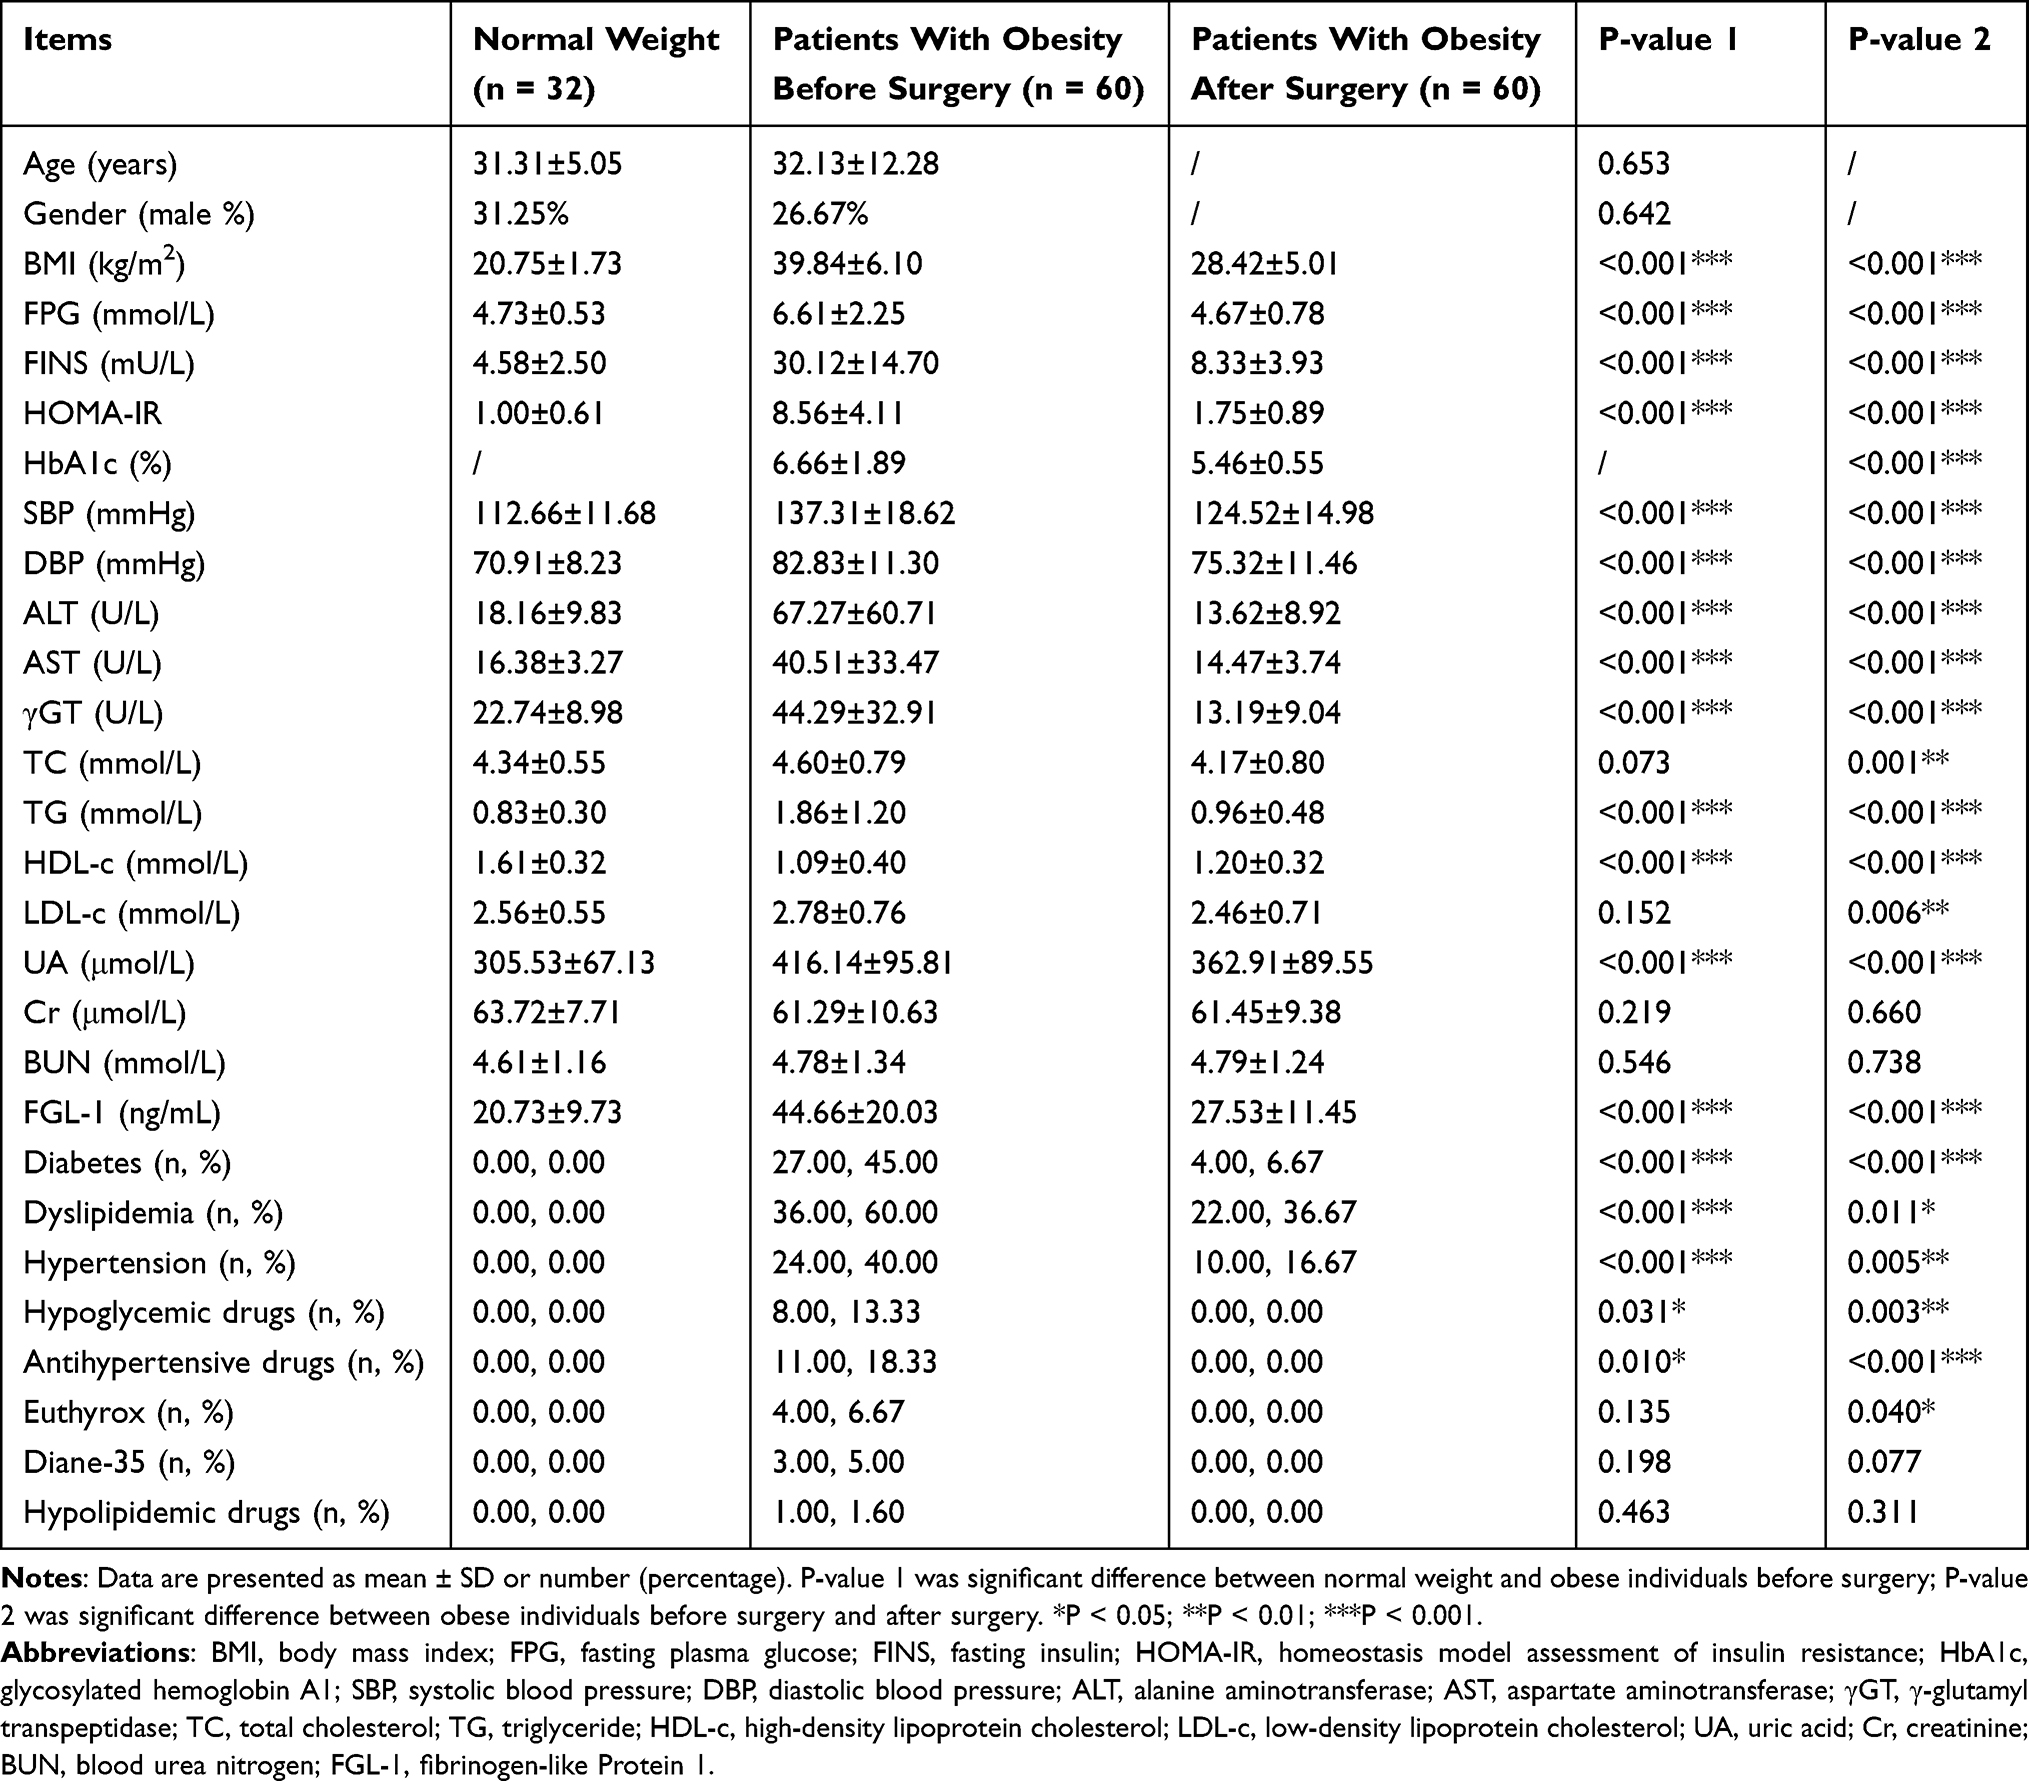 |
Table 1 Clinical Characteristics of the Study |
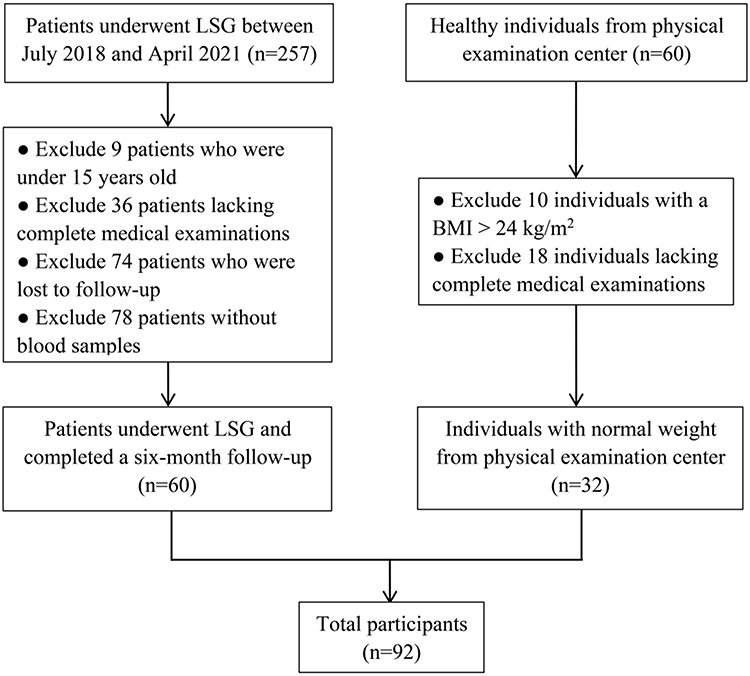 |
Figure 1 Study flow chart. |
Changes in Serum FGL-1 Levels and Other Indicators 6 Months After LSG
At 6 months postoperatively (Table 1), significant improvements in BMI, FPG, FINS, HOMA-IR, HbA1c, SBP, DBP, ALT, AST, γGT, TC, TG, HDL-c, LDL-c, and UA were observed (for all, p < 0.05). BMI declined significantly from 39.84±6.10 kg/m2 to 28.42±5.01 kg/m2. As shown in Figure 2, FGL-1 levels decreased significantly from 44.66±20.03 ng/mL to 27.53±11.45 ng/mL after LSG (p < 0.001). CAP levels decreased significantly from 348.51±43.54 dB/m to 263.71±58.83 dB/m after LSG (p < 0.001). LSM levels decreased significantly from 9.17±7.82 kPa to 5.70±2.26 kPa after LSG (p = 0.006). Furthermore, at 6 months postoperatively, only 4 patients (6.67%) still met the diagnostic criteria for diabetes, 22 patients (36.67%) met the diagnostic criteria for dyslipidemia, and 10 patients (16.67%) met the diagnostic criteria for hypertension. All three major comorbidities of obesity showed significant improvement (p < 0.05). Besides, all patients were taken off medication for at least six months after bariatric surgery and were given diet and lifestyle guidance.
 |
Figure 2 Changes in FGL-1 (A), CAP (B), and LSM (C) levels at 6 months after LSG. Data are presented as mean. Error bars are standard deviations. |
Correlation of Baseline Serum FGL-1 Levels and Other Indicators
To analyze the relationships between FGL-1 levels and other indices at baseline, Pearson’s correlation coefficient was performed (Figure 3). FGL-1 levels were positively associated with BMI, FPG, FINS, HOMA-IR, UA, ALT, AST, γGT, TG, SBP, and DBP, and were negatively associated with HDL-c (all p < 0.05). Whereas, FGL-1 levels were not related to TC, LDL-c, Cr, and BUN (for all, p > 0.05).
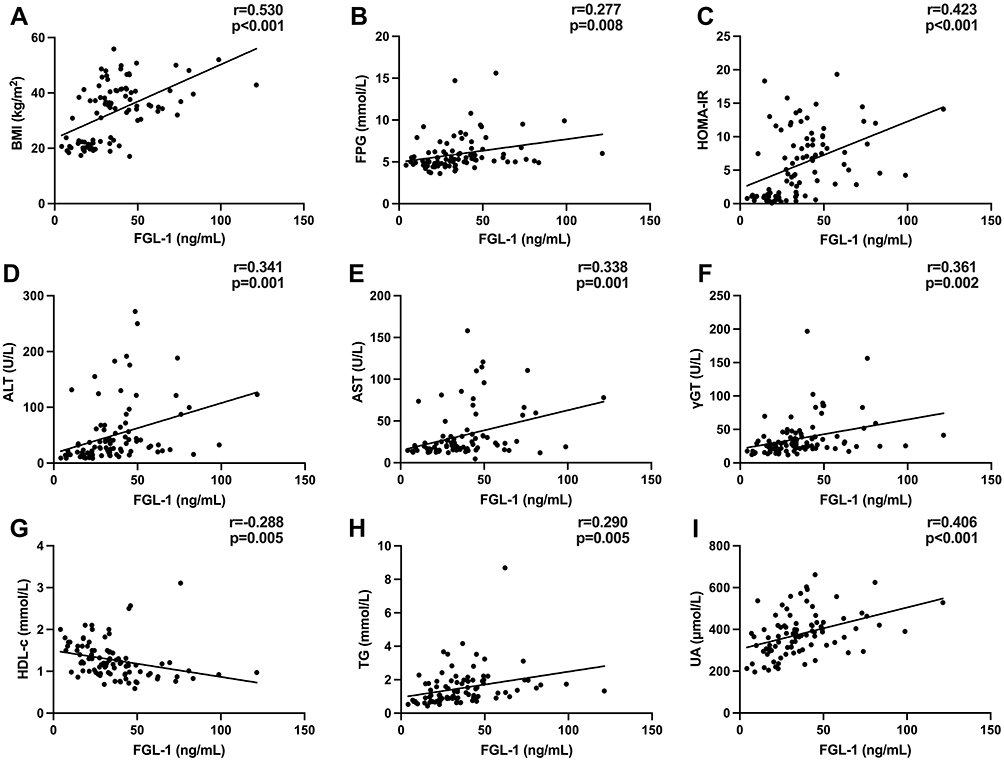 |
Figure 3 Correlation between FGL-1 levels and metabolic factors at baseline. FGL-1 levels were positively associated with BMI (A), FPG (B), HOMA-IR (C), ALT (D), AST (E), γGT (F), TG (H) and UA (I); It was also negatively correlated with HDL-c (G). |
Serum FGL-1 Levels at Baseline Were Related to Changes in LSM Levels
To determine whether baseline FGL-1 levels are associated with changes (Δ) in other indices, linear regression analysis was performed (data not shown) and only ΔLSM levels were negatively associated with baseline FGL-1 levels (p = 0.005). As shown in Table 2, with adjustment for confounders in Model 2–4, ΔLSM levels were still significantly associated with baseline FGL-1 levels (all p < 0.05). After adjusting the gender, BMI, TG, HbA1c, SBP, and preoperative medication use, ΔLSM levels were still negatively associated with baseline FGL-1 levels (p = 0.016).
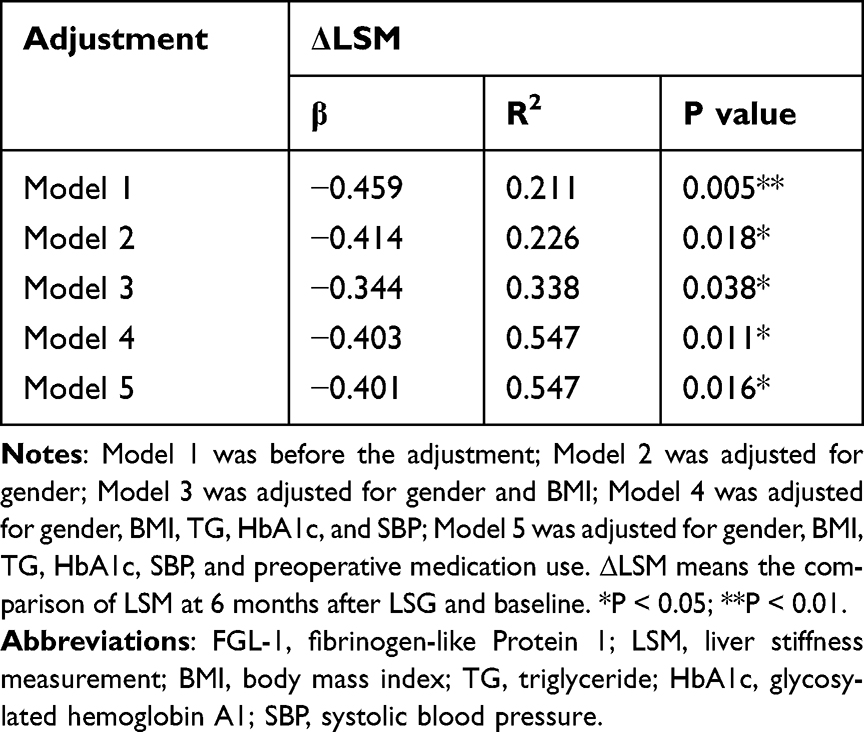 |
Table 2 Multiple Linear Analysis of FGL-1 Levels at Baseline and Changes in LSM Levels After LSG |
Changes in FGL-1 Levels Were Related to Changes in Liver Enzymes and UA
To further explore the association between decreased FGL-1 levels and other indices, linear regression analysis was used after adjusting possible confounding factors. As shown in Table 3, ΔFGL-1 levels were associated with ΔALT, ΔAST, and ΔUA (all p < 0.05) after LSG. Otherwise, ΔFGL-1 levels did not correlate with ΔBMI, ΔHbA1c, ΔHOMA-IR, ΔFPG, ΔFINS, ΔγGT, ΔTC, ΔTG, ΔHDL-c, and ΔLDL-c (for all, p > 0.05).
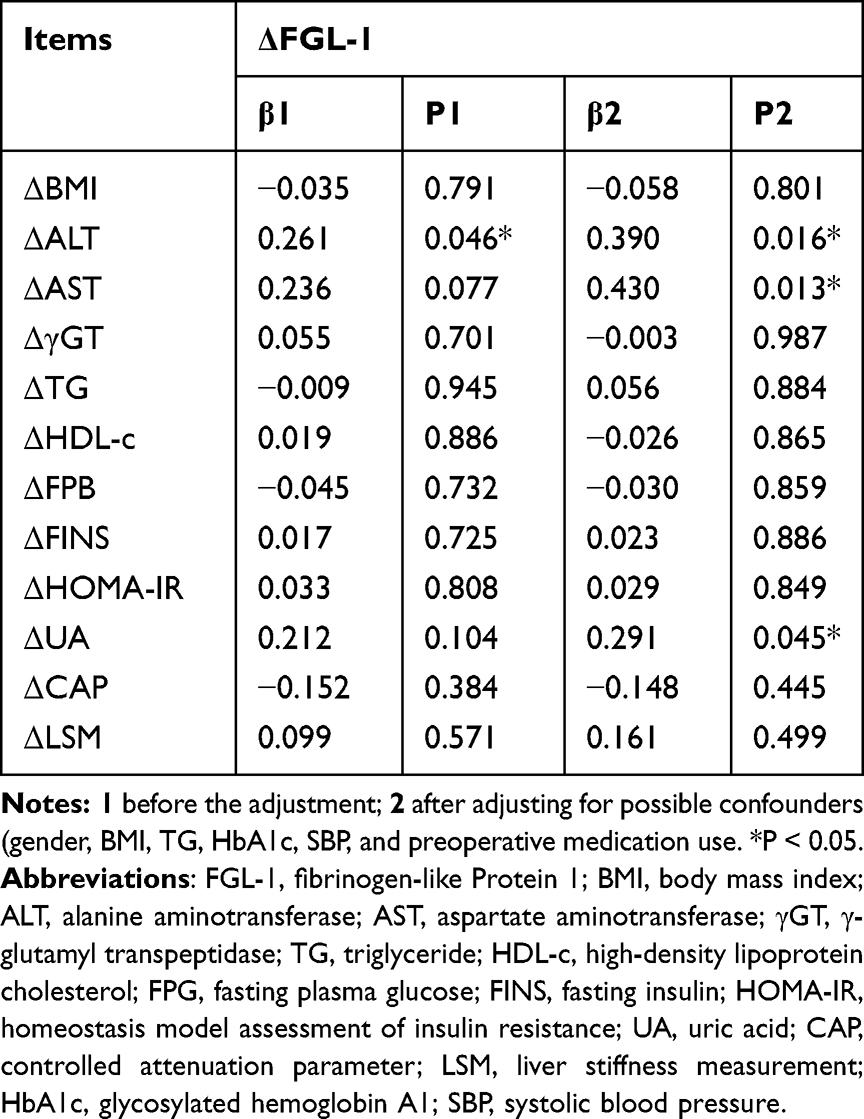 |
Table 3 Multiple Linear Analysis of Changes in FGL-1 Levels and Changes in Metabolic Markers After LSG |
Discussion
The global epidemic of obesity has garnered more and more attention over the past two decades.25 Previous research has shown that the liver regulates energy homeostasis via hepatokine secretion.26 Moreover, hepatokine secretion generally improves after bariatric surgery, which might drive the long-term metabolic improvements following bariatric surgery.27 Recently, studies found that plasma FGL-1 levels are associated with obesity, NAFLD, and T2DM.15,16,24 However, the role of FGL-1 in obese patients who undergo LSG remains obscure, and the current study explored whether FGL-1 changes after LSG are correlated with other metabolic indices.
In this study, individuals with obesity have higher FGL-1 levels than individuals of normal weight. In addition, Pearson’s correlation coefficient revealed that FGL-1 levels were positively correlated with BMI, ALT, AST, γGT, TG, FPG, FINS, HOMA-IR, UA, SBP, DBP, and were negatively correlated with HDL-c. These findings were generally in line with the previous studies.24,28 One of the mechanisms behind this may be that FGL-1 provokes lipid accumulation in the liver by activating the ERK1/2 pathway.15 Moreover, FGL-1 promotes adipogenesis via the ERK1/2-C/EBPβ-dependent pathway.18 Finally, increased FGL-1 expression induces insulin resistance through an EGFR/JNK mediated pathway.19 Since FGL-1 is not only linked to obesity but also other indicators of obesity, it is interesting to explore the FGL-1 levels before and after LSG and its association with changes in clinical indicators.
The multiple linear regression indicated that baseline FGL-1 levels were negatively associated with ΔLSM levels, suggesting that higher preoperative FGL-1 levels were associated with greater postoperative improvement in liver fibrosis. In previous studies, Yang et al29 demonstrated that FGL-1 protects the liver from steatosis and fibrosis in mice with non-alcoholic steatohepatitis (NASH), and FGL-1 may be an effective treatment strategy for NASH. However, in the present study, although there was a significant postoperative improvement in hepatic steatosis and hepatic fibrosis, only improvement in hepatic fibrosis was associated with baseline FGL-1 levels. These results suggest that FGL-1 might be an independent predictor for the effect of LSG on liver fibrosis.
With the decrease in body weight, FGL-1 levels significantly decreased at 6 months after LSG, indicating that LSG can reduce FGL-1 levels. These data were supported by another study showing that bariatric surgery in rodents could reduce hepatic FGF-21 expression compared to the sham surgery group.30 In previous studies, Wu et al15,18 indicated that deletion of FGL-1 in HepG2 cells reduced lipid accumulation, and knockdown of FGL-1 expression in mouse adipose tissue could decrease adipose hypertrophy, which suggested reduced FGL-1 after LSG may be related to the reduction of lipid accumulation and adipose hypertrophy. However, the change in FGL-1 was not related to reduced BMI. Similar to these results, Lim et al found that bariatric surgery could affect hepatokine levels regardless of weight loss.8
After adjusting for possible confounders, the changes in FGL-1 are associated with the improvement of ALT and AST levels, supported by the previous clinical studies showing that changes in hepatokine levels were related to improvements in liver metabolism after bariatric surgery.8 To our knowledge, FGL-1 is known to regulate hepatocyte proliferation and is expressed mainly in the liver.31,32 Meanwhile, it has been reported that plasma FGL-1 concentrations and the liver enzyme increased significantly in hyperglycemic crisis patients and both decreased significantly after treatment.33 There seem to be some mechanisms for improving liver metabolism independent of weight loss that future studies need to explore.
Meanwhile, the changes in FGL-1 are associated with the improvement of UA levels after adjusting for possible confounders. Additionally, another study found that with increasing FGL-1 tertiles, patients had higher UA levels.28 UA is produced in the liver, adipose tissue, and muscle.34 After excessive fructose and sucrose consumption, the liver will produce more catabolic effectors, including hepatokines and UA.35 On the other hand, Xie et al36 found UA stimulates lipid accumulation in the liver by the ROS/JNK/AP-1 pathway. Therefore, UA is closely related to liver metabolism, explaining the association between UA and FGL-1. However, further studies are needed to determine the link between UA and FGL-1.
This study is the first to follow up on the change in FGL-1 levels following bariatric surgery. The current study also has some limitations. Firstly, there was a short follow-up duration of this study. Secondly, this retrospective study only included Chinese individuals and has a relatively small sample size. Thirdly, it was not possible to establish a causal relationship in this study.
Conclusion
To sum up, serum FGL-1 levels were higher in patients with obesity. The preoperative serum FGL-1 levels could be a predictor of postoperative liver fibrosis improvement. Moreover, FGL-1 levels decreased significantly at 6 months postoperatively and positively correlated with improved liver enzymes and uric acid.
Data Sharing Statement
All data for this study are available from the corresponding author upon request.
Acknowledgments
We appreciate all participants in this study.
Funding
This study was supported by the National Key Research and Development Program of China (2018YFC1314100), Clinical Research Plan of SHDC (No. SHDC2020CR1017B), the Natural Science Foundation of China (81970677), and the Shanghai Committee of Science and Technology, China (18411951803, 17AZ1910603).
Disclosure
The authors report no conflicts of interest in this work.
References
1. Jaacks LM, Vandevijvere S, Pan A, et al. The obesity transition: stages of the global epidemic. Lancet Diabetes Endocrinol. 2019;7(3):231–240. doi:10.1016/S2213-8587(19)30026-9
2. Bray GA, Heisel WE, Afshin A, et al. The science of obesity management: an endocrine society scientific statement. Endocr Rev. 2018;39(2):79–132. doi:10.1210/er.2017-00253
3. Bray GA, Fruhbeck G, Ryan DH, Wilding JP. Management of obesity. Lancet. 2016;387(10031):1947–1956. doi:10.1016/S0140-6736(16)00271-3
4. Arterburn DE, Telem DA, Kushner RF, Courcoulas AP. Benefits and risks of bariatric surgery in adults: a review. JAMA. 2020;324(9):879–887.
5. Chen G, Zhang GX, Peng BQ, Cheng Z, Du X. Roux-En-Y Gastric bypass versus sleeve gastrectomy plus procedures for treatment of morbid obesity: systematic review and meta-analysis. Obes Surg. 2021;31(7):3303–3311. doi:10.1007/s11695-021-05456-0
6. Rao RS, Yanagisawa R, Kini S. Insulin resistance and bariatric surgery. Obes Rev. 2012;13(4):316–328. doi:10.1111/j.1467-789X.2011.00955.x
7. Faramia J, Ostinelli G, Drolet-Labelle V, Picard F, Tchernof A. Metabolic adaptations after bariatric surgery: adipokines, myokines and hepatokines. Curr Opin Pharmacol. 2020;52:67–74. doi:10.1016/j.coph.2020.06.005
8. Lim J, Park HS, Lee SK, Jang YJ, Lee YJ, Heo Y. Longitudinal changes in serum levels of angiopoietin-like protein 6 and selenoprotein P after gastric bypass surgery. Obes Surg. 2016;26(4):825–832. doi:10.1007/s11695-015-1808-2
9. Yang PJ, Ser KH, Lin MT, et al. Diabetes associated markers after bariatric surgery: fetuin-A, but not matrix metalloproteinase-7, is reduced. Obes Surg. 2015;25(12):2328–2334. doi:10.1007/s11695-015-1688-5
10. Hosseinzadeh A, Roever L, Alizadeh S. Surgery-induced weight loss and changes in hormonally active fibroblast growth factors: a systematic review and meta-analysis. Obes Surg. 2020;30(10):4046–4060. doi:10.1007/s11695-020-04807-7
11. Watt MJ, Miotto PM, De Nardo W, Montgomery MK. The liver as an endocrine organ-linking NAFLD and insulin resistance. Endocr Rev. 2019;40(5):1367–1393. doi:10.1210/er.2019-00034
12. Demchev V, Malana G, Vangala D, et al. Targeted deletion of fibrinogen like protein 1 reveals a novel role in energy substrate utilization. PLoS One. 2013;8(3):e58084. doi:10.1371/journal.pone.0058084
13. de Oliveira Dos Santos AR, de Oliveira Zanuso B, Miola VFB, et al. Adipokines, myokines, and hepatokines: crosstalk and metabolic repercussions. Int J Mol Sci. 2021;22(5):2639. doi:10.3390/ijms22052639
14. Yan J, Yu YL, Wang N, et al. LFIRE-1/HFREP-1, a liver-specific gene, is frequently downregulated and has growth suppressor activity in hepatocellular carcinoma. Oncogene. 2004;23(10):1939–1949. doi:10.1038/sj.onc.1207306
15. Wu HT, Lu FH, Ou HY, et al. The role of hepassocin in the development of non-alcoholic fatty liver disease. J Hepatol. 2013;59(5):1065–1072. doi:10.1016/j.jhep.2013.06.004
16. Wu HT, Ou HY, Hung HC, et al. A novel hepatokine, HFREP1, plays a crucial role in the development of insulin resistance and type 2 diabetes. Diabetologia. 2016;59(8):1732–1742. doi:10.1007/s00125-016-3991-7
17. Kang L, Li HY, Ou HY, et al. Role of placental fibrinogen-like protein 1 in gestational diabetes. Transl Res. 2020;218:73–80. doi:10.1016/j.trsl.2020.01.001
18. Wu HT, Chen SC, Fan KC, et al. Targeting fibrinogen-like protein 1 is a novel therapeutic strategy to combat obesity. FASEB J. 2020;34(2):2958–2967. doi:10.1096/fj.201901925R
19. Jung TW, Chung YH, Kim HC, Abd El-Aty AM, Jeong JH. Hyperlipidemia-induced hepassocin in the liver contributes to insulin resistance in skeletal muscle. Mol Cell Endocrinol. 2018;470:26–33. doi:10.1016/j.mce.2017.10.014
20. Rubino F, Nathan DM, Eckel RH, et al. Metabolic surgery in the treatment algorithm for type 2 diabetes: a joint statement by international diabetes organizations. Obes Surg. 2017;27(1):2–21. doi:10.1007/s11695-016-2457-9
21. Wallace TM, Levy JC, Matthews DR. Use and abuse of HOMA modeling. Diabetes Care. 2004;27(6):1487–1495. doi:10.2337/diacare.27.6.1487
22. Dilimulati D, Cai M, Lin Z, et al. Correlation between sex hormones and non-alcoholic fatty liver disease before and after laparoscopic sleeve gastrectomy. Obes Surg. 2021;31(11):4901–4910. doi:10.1007/s11695-021-05663-9
23. Borges-Canha M, Neves JS, Mendonca F, et al. Beta cell function as a baseline predictor of weight loss after bariatric surgery. Front Endocrinol. 2021;12:714173. doi:10.3389/fendo.2021.714173
24. Huang RL, Li CH, Du YF, et al. Discovery of a role of the novel hepatokine, hepassocin, in obesity. Biofactors. 2020;46(1):100–105. doi:10.1002/biof.1574
25. Fan JG, Kim SU, Wong VW. New trends on obesity and NAFLD in Asia. J Hepatol. 2017;67(4):862–873. doi:10.1016/j.jhep.2017.06.003
26. Stefan N, Haring HU. The role of hepatokines in metabolism. Nat Rev Endocrinol. 2013;9(3):144–152. doi:10.1038/nrendo.2012.258
27. Poloczek J, Kazura W, Kwasnicka E, Gumprecht J, Jochem J, Stygar D. Effects of bariatric surgeries on fetuin-A, selenoprotein P, angiopoietin-like protein 6, and fibroblast growth factor 21 concentration. J Diabetes Res. 2021;2021:5527107. doi:10.1155/2021/5527107
28. Tsai IT, Hung WC, Lu YC, et al. Circulating hepassocin level in patients with stable angina is associated with fatty liver and renal function. Int J Med Sci. 2021;18(1):1–7. doi:10.7150/ijms.50646
29. Yang Y, Liu X, Chen H, et al. HPS protects the liver against steatosis, cell death, inflammation, and fibrosis in mice with steatohepatitis. FEBS J. 2022. doi:10.1111/febs.16430
30. Stygar D, Piglowski W, Chelmecka E, et al. Changes in liver gene expression and plasma concentration of rbp4, fetuin-A, and Fgf21 in sprague-dawley rats subjected to different dietary interventions and bariatric surgery. Biomed Res Int. 2018;2018:3472190. doi:10.1155/2018/3472190
31. Gao M, Yan H, Yin RH, et al. Hepassocin is required for hepatic outgrowth during zebrafish hepatogenesis. Biochem Bioph Res Co. 2015;463(3):466–471. doi:10.1016/j.bbrc.2015.05.121
32. Li CY, Cao CZ, Xu WX, et al. Recombinant human hepassocin stimulates proliferation of hepatocytes in vivo and improves survival in rats with fulminant hepatic failure. Gut. 2010;59(6):817–826. doi:10.1136/gut.2008.171124
33. Ou HY, Wu HT, Lin CH, et al. The hepatic protection effects of hepassocin in hyperglycemic crisis. J Clin Endocrinol Metab. 2017;102(7):2407–2415. doi:10.1210/jc.2016-3287
34. Lima WG, Martins-Santos MES, Chaves VE. Uric acid as a modulator of glucose and lipid metabolism. Biochimie. 2015;116:17–23. doi:10.1016/j.biochi.2015.06.025
35. De Bandt JP, Jegatheesan P, Tennoune-El-Hafaia N. Muscle loss in chronic liver diseases: the example of nonalcoholic liver disease. Nutrients. 2018;10:9. doi:10.3390/nu10091195
36. Xie D, Zhao H, Lu J, et al. High uric acid induces liver fat accumulation via ROS/JNK/AP-1 signaling. Am J Physiol Endocrinol Metab. 2021;320(6):E1032–E1043. doi:10.1152/ajpendo.00518.2020
 © 2022 The Author(s). This work is published and licensed by Dove Medical Press Limited. The full terms of this license are available at https://www.dovepress.com/terms.php and incorporate the Creative Commons Attribution - Non Commercial (unported, v3.0) License.
By accessing the work you hereby accept the Terms. Non-commercial uses of the work are permitted without any further permission from Dove Medical Press Limited, provided the work is properly attributed. For permission for commercial use of this work, please see paragraphs 4.2 and 5 of our Terms.
© 2022 The Author(s). This work is published and licensed by Dove Medical Press Limited. The full terms of this license are available at https://www.dovepress.com/terms.php and incorporate the Creative Commons Attribution - Non Commercial (unported, v3.0) License.
By accessing the work you hereby accept the Terms. Non-commercial uses of the work are permitted without any further permission from Dove Medical Press Limited, provided the work is properly attributed. For permission for commercial use of this work, please see paragraphs 4.2 and 5 of our Terms.