")
Back to Journals » Diabetes, Metabolic Syndrome and Obesity » Volume 13
Serum Ferritin Independently Predicts the Incidence of Chronic Kidney Disease in Patients with Type 2 Diabetes Mellitus
Authors Wu YH, Wang SY , Li MX, He H, Yin WJ, Guo YH, Zhang HQ, Sun ZM, Zhang D, Wang X, Sun SY, Tang SX, Du R, Zhang CH
Received 22 August 2019
Accepted for publication 29 November 2019
Published 14 January 2020 Volume 2020:13 Pages 99—105
DOI https://doi.org/10.2147/DMSO.S228335
Checked for plagiarism Yes
Review by Single anonymous peer review
Peer reviewer comments 2
Editor who approved publication: Prof. Dr. Juei-Tang Cheng
Yun Hong Wu, Su Yuan Wang, Ming Xia Li, Hua He, Wei Jin Yin, Yan Hong Guo, Hui Qin Zhang, Zeng Mei Sun, Dan Zhang, Xi Wang, Shu Yao Sun, Shu Xi Tang, Rong Du, Cheng Hui Zhang
Department of Endocrinology and Metabolism, Hospital of Chengdu Office of People’s Government of Tibetan Autonomous Region, Chengdu, People’s Republic of China
Correspondence: Cheng Hui Zhang
Department of Endocrinology and Metabolism, Hospital of Chengdu Office of People’s Government of Tibetan Autonomous Region, No. 20 Ximianqiao Street, Chengdu, Sichuan 610041, People’s Republic of China
Email [email protected]
Aim: This study aimed to determine whether serum ferritin (SF) is an independent risk factor of the incidence of chronic kidney disease (CKD) and rapid renal function decline (RFD) in male Tibetan patients with type 2 diabetes mellitus (T2DM).
Methods: We performed a retrospective cohort study that included 191 male Tibetan patients with T2DM without CKD. Patients were divided into three groups according to the level of SF. The following outcomes were measured: cumulative incidence of chronic kidney disease [i.e. estimated glomerular filtration rate (eGFR) < 60 mL/min per 1.73 m 2 and/or urinary albumin/creatine ratio (ACR) ≥ 30 mg/g] and RFD (i.e. decrease in eGFR of ≥ 25% from baseline or a decline rate of ≥ 3 mL/min per 1.73 m 2 annually).
Results: In total, over a median follow-up period of 23 months, 30 (15.7%) and 89 patients (46.6%) developed CKD and RFD. In multivariable Cox models, a 100 ng/mL increment in SF was associated with a 1.12-fold (95% CI: 1.02– 1.24) higher adjusted risk for incidence of CKD. The adjusted-HR of CKD was 1.31 (95% CI: 0.38– 4.53) and 2.92 (95% CI: 0.87– 9.77) for those in tertile 2 and tertile 3, respectively, compared with the patients in tertile 1. However, SF was not significantly associated with RFD (adjusted-HR: 1.06, 95% CI: 0.99– 1.14).
Conclusion: Serum ferritin independently predicts the incidence of CKD in male Tibetan patients with T2DM. High levels of serum ferritin may play a role in the pathogenesis leading to the development of CKD in T2DM.
Keywords: serum ferritin, chronic kidney disease, type 2 diabetes mellitus
Introduction
Chronic kidney disease (CKD) is one of the global public health problems.1 The China National Survey of CKD from 2007 to 2010 reported an overall CKD prevalence of 10.8%, and approximately 119.5 million individuals in China have CKD.2 The heavy health and socioeconomic burden of end-stage renal disease (ESRD) underlines the importance of early screening for modifiable risk factors of CKD to prevent or delay the deterioration of renal function.3 Diabetes mellitus (DM) is recognized as the major cause of CKD and ESRD.4 Other risk factors include hyperglycaemia, dyslipidaemia, hypertension, obesity, and hyperuricemia.5–8
Iron is an essential element for crucial biological function, but excessive iron is also potentially harmful to many tissues and organs as it can cause overproduction of reactive oxygen species (ROS) via the Fenton reaction that lead to cellular damage.9–11 Serum ferritin (SF) concentration is an indicator of iron storage in humans. Some published studies have reported that SF is associated with the incidence of CKD.12,13 However, most of these studies were either cross-sectional or conducted in general populations with normal SF concentrations.
Previously, we found that SF concentration increased in individuals residing in the Tibetan Plateau, which may be caused by hypoxia, erythropoietic demand, and consumption of red meat.14–16 To explore the association between SF and the prevalence of CKD, we performed a cross-sectional study and found an independent association between SF and the prevalence of CKD in male Tibetan patients with type 2 diabetes mellitus (T2DM).
This retrospective cohort study aimed to longitudinally assess the effect of SF on the incidence of CKD and rapid renal function decline (RFD) among male T2DM patients from the Tibetan Plateau. We hypothesized that SF could independently predict the incidence of CKD and RFD.
Methods
Subjects and Design
This was a retrospective cohort study that included T2DM patients without CKD at baseline. Data were collected from electronic medical records (EMR) in our hospital from 2014 to 2017. The inclusion criteria were: a) age 18 to 79 years; b) no diagnosis of CKD or a history of renal disease; c) a follow-up duration of at least 6 months; and d) estimated glomerular filtration rate (eGFR) and urinary albumin-creatinine ratio (ACR) at baseline visit and follow-up visit were recorded. Patients with tumours, hepatic disease, including increased liver aminotransferase, liver cirrhosis, and viral hepatitis, haematological disease, and a history of alcoholism were excluded from the study. This study was approved by the ethics committee of Hospital of Chengdu Office of People’s Government of Tibetan Autonomous Region, and the study was conducted in accordance with the Declaration of Helsinki. The need for written informed consent was waived owing to the retrospective nature of the study. We have confirmed of patient data confidentiality.
Data Collection
Clinical (age, weight, height, diabetes duration, history of hypertension, and blood pressure) and biochemical parameters [fasting blood glucose (FBG), haemoglobin A1c (HbA1c), total cholesterol (TC), high-density lipoprotein cholesterol (HDL-C), low-density lipoprotein cholesterol (LDL-C), serum creatinine (Cr), uric acid, ACR, and SF] were collected from EMRs. Body mass index (BMI) was calculated as weight (kg) divided by height (m) squared. Hypertension was defined as a history of hypertension or use of anti-hypertensive agents. Albuminuria was defined as an ACR >30 mg/g. The eGFR was calculated following the Modification of Diet in Renal Disease equation: 194 × serum Cr −1.094 × age −0.287 (×0.739 if women).2
Renal Outcomes
The primary outcome was the incidence of CKD, i.e., eGFR less than 60 mL/min per 1.73 m2 or the presence of albuminuria.17 The secondary outcome was RFD, which was defined as a decrease in eGFR ≥25% from baseline or a rate of decline in eGFR ≥3 mL/min per 1.73 m2 per year. These values were chosen on the basis of previous studies.18,19 The rate of decline in eGFR was calculated as (initial eGFR – final eGFR)/follow-up year.
Statistical Analysis
Continuous data were presented as mean ± standard deviation (SD) if the distribution is normal, and median (25th, 75th percentile) was used if the data showed skewed distribution. Categorical variables were described as number (percentage). One-way ANOVA or Chi-square test was performed for the comparisons among different groups. The associations between baseline SF and renal outcome were first evaluated via Kaplan-Meier survival analysis stratified by serum ferritin tertile. The significance of the differences in cumulative incidence of CKD and RFD was evaluated with the log rank test. Unadjusted and adjusted Cox proportional hazards models were used to identify associations between SF and the renal outcomes. The hazard ratio (HR) and the 95% confidence interval (95% CI) were calculated. All analyses were performed using the statistical package R version 3.1.2 (R Foundation for Statistical Computing, Vienna, Austria) and Empower (X & Y solutions, Inc. Boston, Massachusetts). A two-tailed P-value <0.05 was considered statistically significant.
Results
General Characteristics
In total, 191 patients with a mean age of 51.1 ± 9.4 years were included in this study. The baseline characteristics of all patients are presented by SF tertiles (T1: 118.3–545.1 ng/mL; T2: 551.1–895.1 ng/mL; and T3: 906.4–2992.0 ng/mL) in Table 1. The mean duration of diabetes was 6.7 years. A total of 35.1% of patients had hypertension. Patients in tertile 1 had significantly lower FBG than those in tertiles 2 and 3 (P = 0.038). However, there were no significant differences in other baseline characteristics among three groups, including age, diabetic duration, BMI, prevalence of hypertension, systolic blood pressure (SBP), diastolic blood pressure (DBP), HbA1c, TC, HDL-C, LDL-C, uric acid, creatinine, eGFR, and ACR.
 |
Table 1 Baseline Characteristics of the Subjects Grouped by Serum Ferritin Tertiles |
Over a median follow-up period of 23 months, 30 patients (15.7%) had CKD. There were no significant differences in the incidence of CKD among the three groups (Table 2). Eighty-nine patients (46.6%) had RFD, and the incidence of RFD was higher in tertiles 2 and 3 than that in tertile 1, but the difference was not significant. Figure 1 shows the Kaplan–Meier curves illustrating the cumulative incidence of CKD and RFD stratified by SF tertile. The cumulative incidence of CKD was lower in tertile 1 than that in tertile 2 and tertile 3. However, the difference was not statistically significant (log rank test: p = 0.066). We also did not observe differences in cumulative incidence of RFD among the three groups (log rank test: P = 0.078).
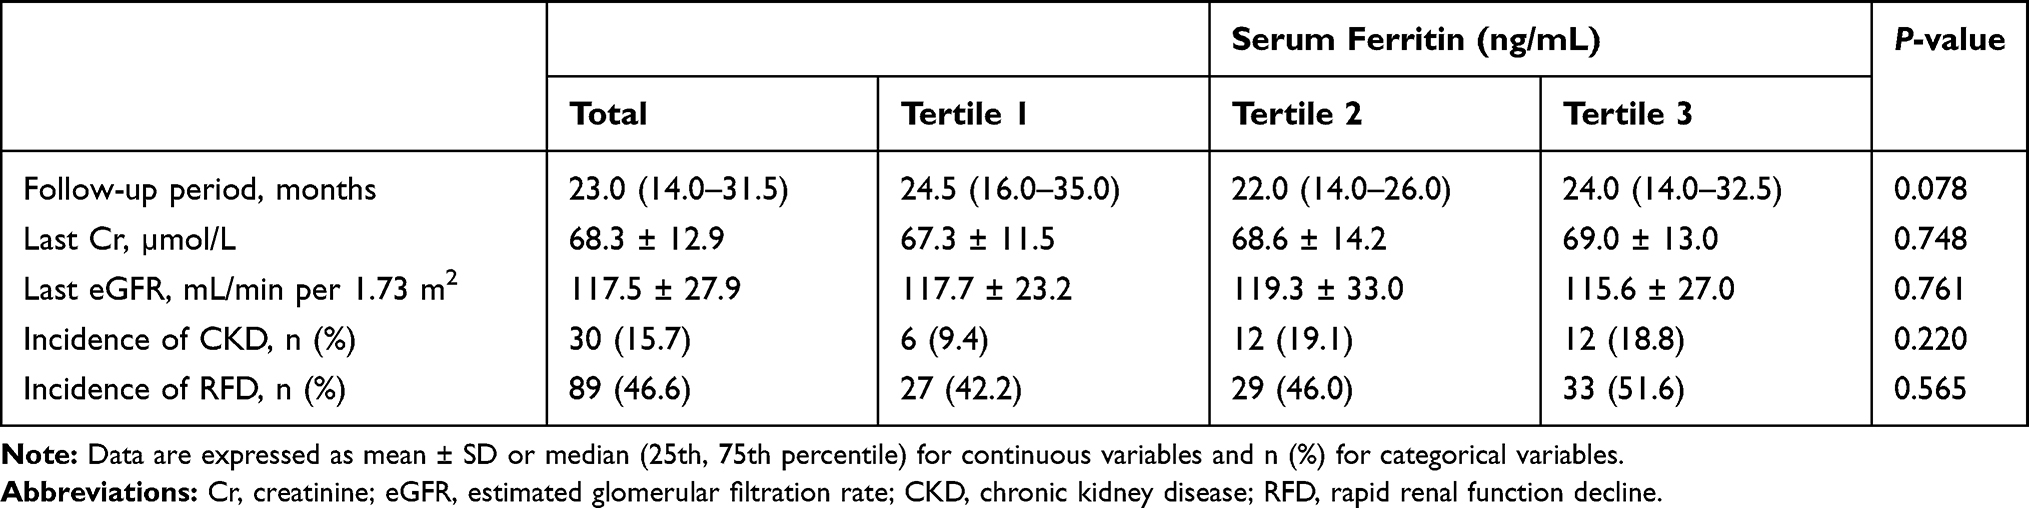 |
Table 2 Follow-Up Characteristics of the Study Population |
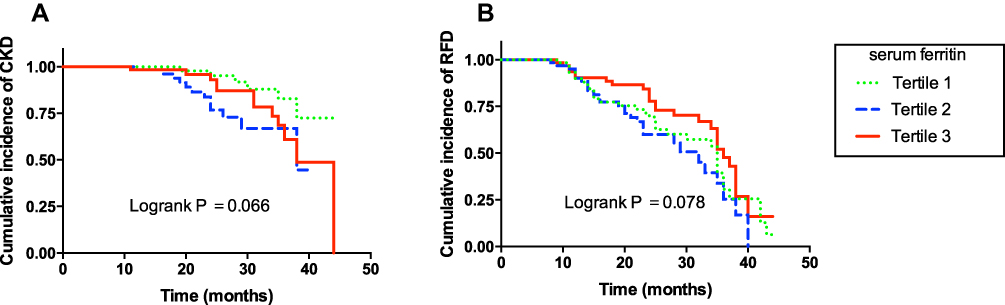 |
Figure 1 Kaplan–Meier survival curve for CKD (A) and RFD (B) of all patients stratified by serum ferritin tertiles. |
Variables in Relation to Renal Outcomes
The unadjusted associations between the clinical variables and incidence of CKD and RFD are presented in Table 3. Our results showed that diabetic duration, ACR, and HbA1c were positively associated with incidence of CKD (P <0.05). eGFR was positively associated with RFD (P <0.05). There were no significant associations between age, BMI, lipid profile and renal outcomes.
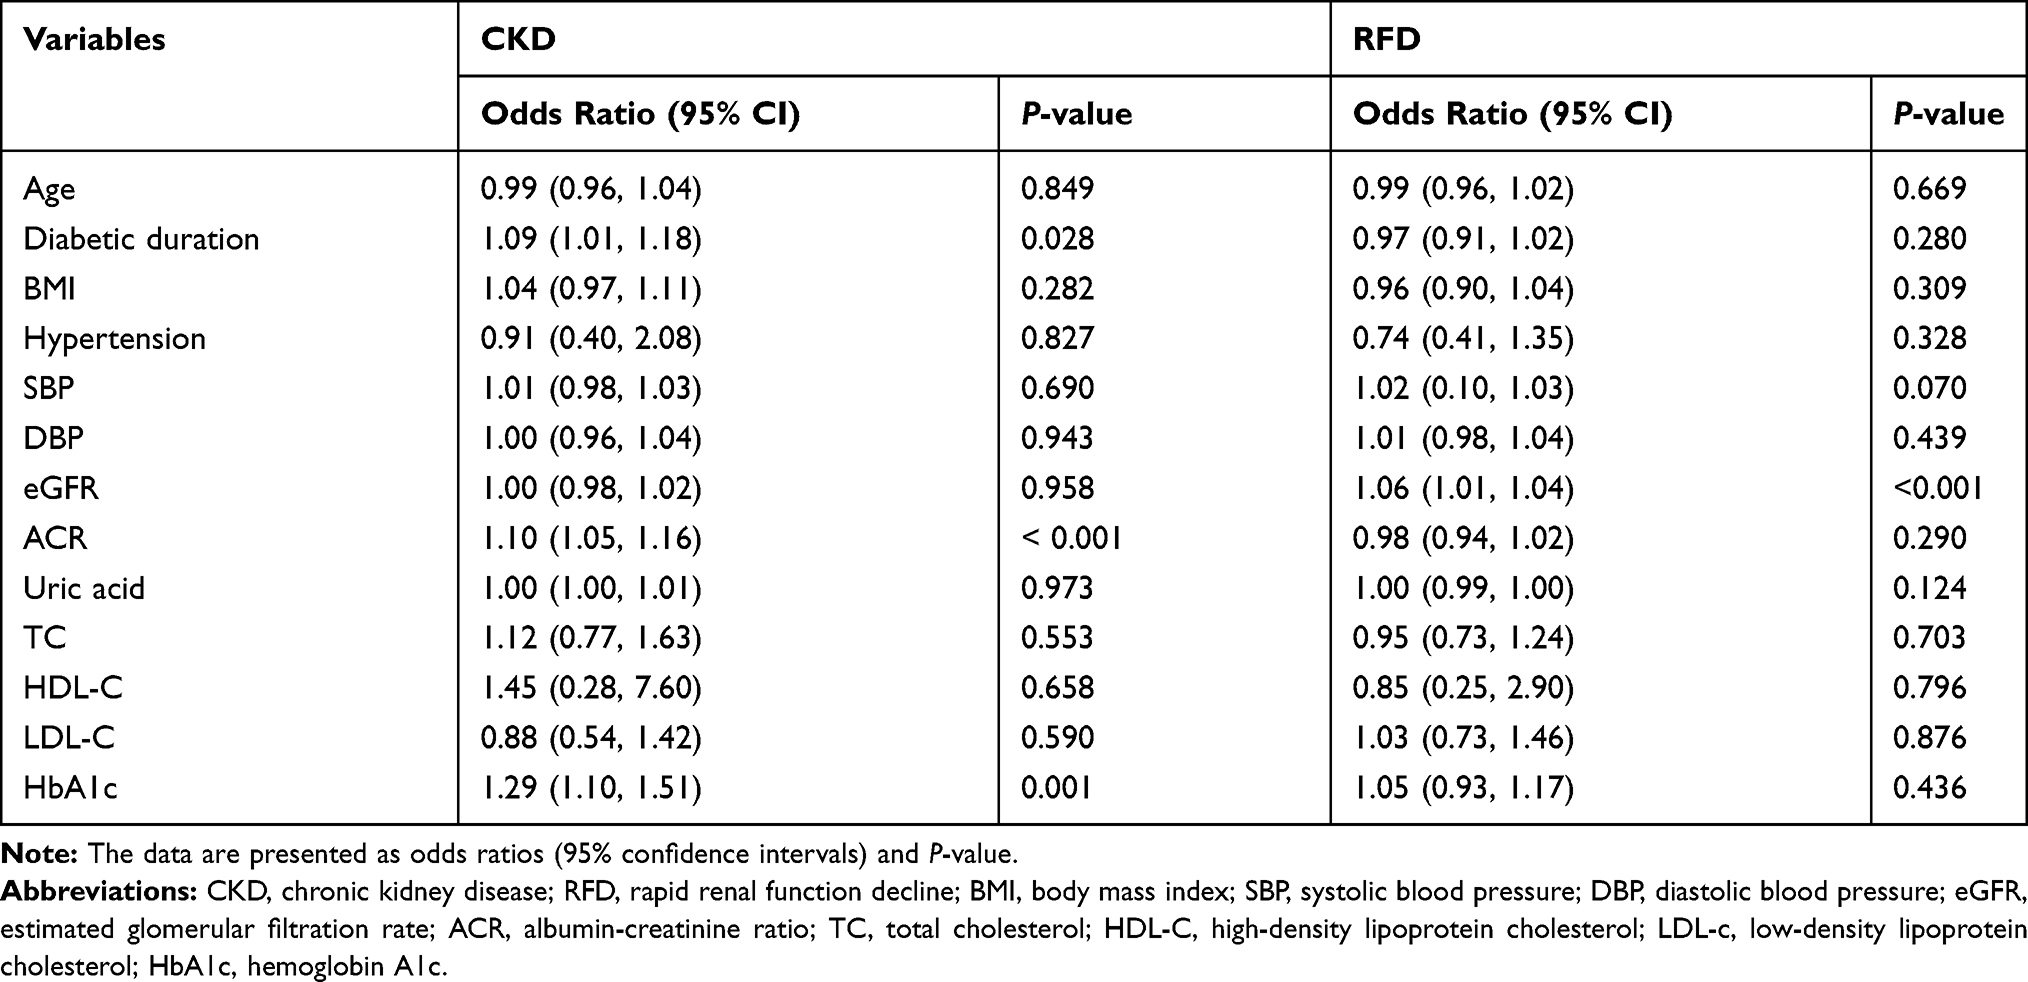 |
Table 3 The Correlations Between Clinical Variables and Renal Outcomes by Univariate Analysis |
Association Between SF and Renal Outcomes
Table 4 shows the results of Cox regression analysis for the influence of baseline SF level on the incidence of CKD in both the crude model and adjusted model. After adjustment for diabetic duration, SBP, uric acid, HbA1c, ACR and eGFR, a 100 ng/mL increment in SF was associated with a 1.12-fold (95% CI: 1.02–1.24) higher risk for CKD. The adjusted HR of CKD was 1.31 (95% CI: 0.38–4.53) and 2.92 (95% CI: 0.87–9.77) for those in tertile 2 and tertile 3, respectively, compared with the patients in tertile 1, but this difference was not statistically significant. Table 5 shows the association between SF and RFD. SF level was not significantly associated with the risk of RFD after adjusting for other variables (HR: 1.06, 95% CI: 0.99–1.14).
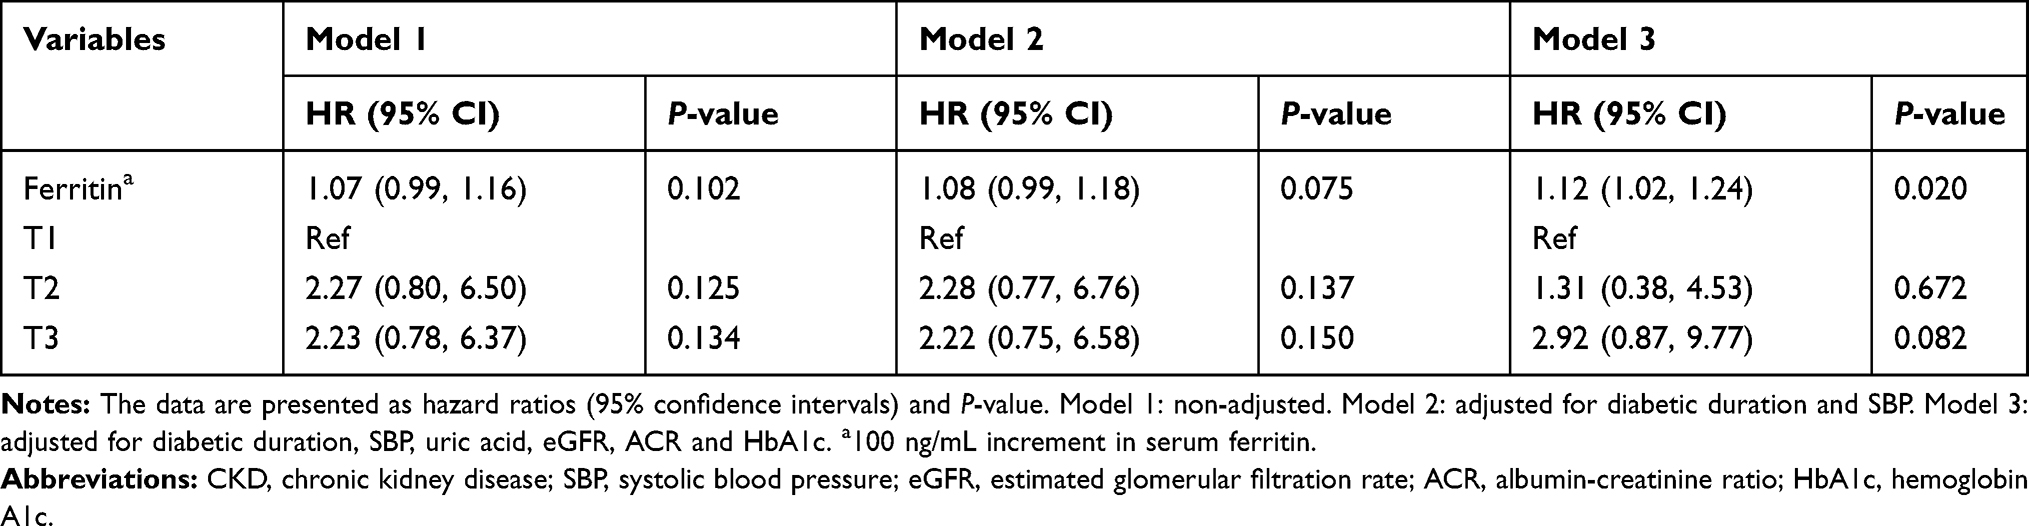 |
Table 4 Cox Regression Analysis of SF and Incidence of CKD |
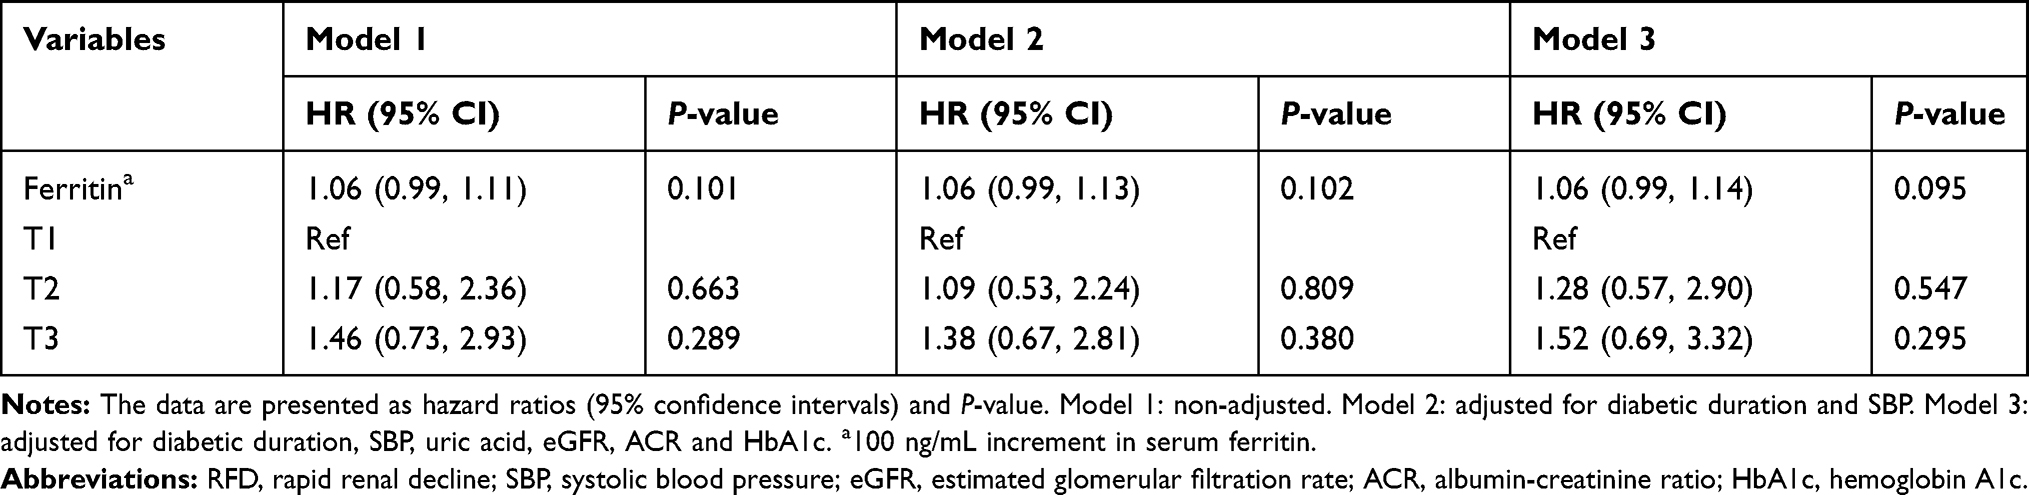 |
Table 5 Cox Regression Analysis of SF and Incidence of RFD |
Discussion
To our knowledge, this is the first longitudinal study to evaluate the association of SF with renal outcomes in T2DM patients without CKD. Most previous studies on the association between SF levels and renal outcomes were cross-sectional or case-control studies that enrolled participants with a normal or moderately elevated SF level, whereas our patients had markedly higher SF levels than those observed in previous studies. We found that SF predicted the incidence of CKD but not RFD.
Some published studies have investigated the association between SF and renal outcome. Kang et al12 conducted a large cross-sectional study that included 13,462 participants in Korea. The mean SF level was 130.6 ± 1.9 ng/mL for men and 57.7 ± 0.8 ng/mL for women. Compared with the normal-ferritin group, the adjusted odds ratios (95% CI) for CKD of the high-ferritin group were 1.57 (1.01–2.44) in men and 1.06 (0.38–2.96) in women, which suggested that SF was associated with a higher prevalence risk of CKD in men, but not in women in Korea. Chen et al13 found that in community-dwelling Chinese, SF in the highest quartiles was associated with increased risk of CKD, such an association was dependent on confounding factors. When gamma-glutamyl transferase and SF were analysed in combination, the rate of CKD increased. Both of these two studies were conducted in the general Han populations, and the SF level was within the normal range. Our previous data revealed that SF concentration was higher in individuals living in the Tibetan Plateau. Thus, we conducted a cross-sectional study of 1071 male Tibetan patients with T2DM. Similar with the findings of Kang et al, we found an independent association between SF and the prevalence of CKD. This retrospective cohort study aimed to longitudinally assess whether increased SF could be a predictive risk factor for the incidence of CKD, and our result confirmed that SF might be an independent predictive factor of CKD.
Iron stores primarily exist in the form of ferritin. The World Health Organization defines the upper limit for normal ferritin value at 200 ng/mL and 150 ng/mL in adult men and women without current infection. In this cohort, only a few patients had normal SF value, and some patients even had SF concentrations higher than 1000 ng/mL after excluding those who had hereditary hemochromatosis, inflammation, malignancy, blood transfusions, and hepatic diseases.20 Iron overload leads to an increased production of ROS, which is associated with bimolecular oxidative damage. If left untreated, sustained iron overloaded can cause progressive iron accumulation in the liver, heart, and pancreas as well as other tissues and organs and lead to a multi-visceral disease.21 The pro-oxidant capacity of iron has been demonstrated in CKD and ESRD patients, and the roles of inflammation and oxidative stress on CKD development and progression have been highlighted.22–24
Predicting the development and progression of kidney disease in T2DM patients is challenging. Radcliffe et al25 reviewed the clinical predictive factors in diabetic kidney disease progression and found that increased HbA1c, SBP, albuminuria, early decline in glomerular filtration rate, long diabetes duration, old age, high uric acid level, presence of concomitant microvascular complications, and positive family history were associated with progression of diabetic kidney disease. In our study, except for SF, long duration of DM and high baseline HbA1c level were predictors for the incidence of CKD.
Krolewski et al19 found that SBP was a predictor of incident albuminuria and rapid renal function decline in T2DM patients. By contrast, the baseline blood pressure level was not associated with incidence of CKD in our study. This may possibly be due to the low baseline SBP in our cohort. Specifically, the mean baseline SBP in our cohort was 123 mm Hg, which is lower than the recommended SBP of 130 mm Hg.26 Both LDL-C and CKD are risk factors for cardiovascular disease.27,28 However, in their prospective cohort study, Salinero-Fort et al29 reported that dyslipidaemia is one of the risk factors of CKD. In this study, we found that LDL-C was associated with RFD but not with the incidence of CKD.
There are also several limitations in this study. First, this was a retrospective cohort, and thus not all relevant data were available. For example, the smoking and drinking status was not available at baseline and thus this was not analysed. Second, our median follow-up time was only 23 months, and a longer follow-up would be more useful to observe the renal outcomes. We are planning to perform a prospective cohort study with a longer follow-up period of up to 5 years in this study population. This study only enrolled patients from the Tibetan plateau; therefore, the generalizability of the findings might be limited. Further investigation that includes a more diverse ethnic background is needed to obtain a more generalized conclusion on the association between SF and CKD.
Conclusion
This study is the first to show that SF was an independent predictive factor of onset of CKD in male Tibetan patients with T2DM. This result indicates that high levels of SF may play a role in the pathologic pathway leading to the development of CKD in T2DM.
Disclosure
The authors report no conflicts of interest in this work.
References
1. Eknoyan G, Lameire N, Barsoum R, et al. The burden of kidney disease: improving global outcomes. Kidney Int. 2004;66:1310–1314. doi:10.1111/j.1523-1755.2004.00894.x
2. Yano Y, Fujimoto S, Asahi K, Watanabe T. Prevalence of chronic kidney disease in China. Lancet. 2012;380:214. doi:10.1016/S0140-6736(12)61209-4
3. Chingha KB, Beddhu S. Metabolic syndrome and chronic kidney disease. Minerva Urol Nefrol. 2006;58:1–12.
4. Cooper ME. Pathogenesis, prevention, and treatment of diabetic nephropathy. Lancet. 1998;352:213–219. doi:10.1016/S0140-6736(98)01346-4
5. Luk AO, So WY, Ma RC, et al. Metabolic syndrome predicts new onset of chronic kidney disease in 5,829 Patients with type 2 diabetes: a 5-year prospective analysis of the Hong Kong diabetes registry. Diabetes Care. 2008;31:2357–2361. doi:10.2337/dc08-0971
6. Fan F, Qi L, Jia J, et al. Noninvasive central systolic blood pressure is more strongly related to kidney function decline than peripheral systolic blood pressure in a Chinese community-based population. Hypertension. 2016;67:1166–1172. doi:10.1161/HYPERTENSIONAHA.115.07019
7. Othman M, Kawar B, Elnahas AM. Influence of obesity on progression of non-diabetic chronic kidney disease: a retrospective cohort study. Nephron Clin Pract. 2009;113:c16–c23. doi:10.1159/000228071
8. Rodenbach KE, Schneider MF, Furth SL, et al. Hyperuricemia and progression of CKD in children and adolescents: the chronic kidney disease in children (CKiD) cohort study. Am J Kidney Dis. 2015;66:984–992. doi:10.1053/j.ajkd.2015.06.015
9. Ferrannini E. Insulin resistance, iron, and the liver. Lancet. 2000;355:2181–2182. doi:10.1016/S0140-6736(00)02397-7
10. Rajpathak SN, Crandall JP, Wylierosett J, Kabat GC, Rohan TE, Hu FB. The role of iron in type 2 diabetes in humans. Biochim Biophys Acta. 2009;1790:671–681. doi:10.1016/j.bbagen.2008.04.005
11. Tsuji Y, Ayaki H, Whitman SP, Morrow CS, Torti SV, Torti FM. Coordinate transcriptional and translational regulation of ferritin in response to oxidative stress. Mol Cell Biol. 2000;20:5818–5827. doi:10.1128/MCB.20.16.5818-5827.2000
12. Kang HT, Linton JA, Kwon SK, Park BJ, Lee JH. Ferritin level is positively associated with chronic kidney disease in Korean men, based on the 2010–2012 Korean National Health and Nutrition Examination Survey. Int J Environ Res Public Health. 2016;13:1058. doi:10.3390/ijerph13111058
13. Chen T, Ren Y, Gao Y, Tian H. Serum gamma-glutamyl transferase and ferritin synergistically associated with the rate of chronic kidney disease. Dis Markers. 2017;2017:9765259. doi:10.1155/2017/9765259
14. Leung PS, Srai SK, Mascarenhas M, Churchill LJ, Debnam ES. Increased duodenal iron uptake and transfer in a rat model of chronic hypoxia is accompanied by reduced hepcidin expression. Gut. 2005;54:1391–1395. doi:10.1136/gut.2004.062083
15. Gassmann M, Muckenthaler MU. Adaptation of iron requirement to hypoxic conditions at high altitude. J Appl Physiol (1985). 2015;119:1432–1440. doi:10.1152/japplphysiol.00248.2015
16. Papanikolaou G, Pantopoulos K. Systemic iron homeostasis and erythropoiesis. IUBMB Life. 2017;69:399–413. doi:10.1002/iub.v69.6
17. Levey AS, Eckardt KU, Tsukamoto Y, et al. Definition and classification of chronic kidney disease: a position statement from kidney disease: improving global outcomes (KDIGO). Kidney Int. 2005;67:2089–2100. doi:10.1111/j.1523-1755.2005.00365.x
18. Su HM, Tsai WC, Lin TH, et al. P wave dispersion and maximum P wave duration are independently associated with rapid renal function decline. PLoS One. 2012;7:e42815. doi:10.1371/journal.pone.0042815
19. Krolewski AS, Skupien J, Rossing P, et al. Fast renal decline to end-stage renal disease: an unrecognized feature of nephropathy in diabetes. Kidney Int. 2017;91:1300–1311. doi:10.1016/j.kint.2016.10.046
20. Piperno A. Classification and diagnosis of iron overload. Haematologica. 1998;83:447–455.
21. Deugnier Y, Bardou-Jacquet E, Laine F. Dysmetabolic iron overload syndrome (DIOS). Presse Med. 2017;46:e306–e311. doi:10.1016/j.lpm.2017.05.036
22. Buren PV, Velez RL, Vaziri ND, Zhou XJ. Iron overdose: a contributor to adverse outcomes in randomized trials of anemia correction in CKD. Int Urol Nephrol. 2012;44:499–507. doi:10.1007/s11255-011-0028-5
23. Hojs R, Ekart R, Bevc S, Hojs N. Markers of inflammation and oxidative stress in the development and progression of renal disease in diabetic patients. Nephron. 2016;133:159–162. doi:10.1159/000447434
24. Cachofeiro V, Goicochea M, de Vinuesa SG, Oubiña P, Lahera V, Luño J. Oxidative stress and inflammation, a link between chronic kidney disease and cardiovascular disease. Kidney Int Suppl. 2008;74:S4–S9. doi:10.1038/ki.2008.516
25. Radcliffe NJ, Seah JM, Clarke M, Macisaac RJ, Jerums G, Ekinci EI. Clinical predictive factors in diabetic kidney disease progression. J Diabetes Investig. 2017;8:6–18. doi:10.1111/jdi.12533
26. Marathe PH, Gao HX, Close KL. American Diabetes Association standards of medical care in diabetes 2017. J Diabetes. 2017;9:320–324. doi:10.1111/1753-0407.12524
27. Gordon DJ, Probstfield JL, Garrison RJ, et al. High-density lipoprotein cholesterol and cardiovascular disease. Four prospective American studies. Circulation. 1989;79:8–15. doi:10.1161/01.CIR.79.1.8
28. Ruilope LM, van Veldhuisen DJ, Ritz E, Luscher TF. Renal function: the Cinderella of cardiovascular risk profile. J Am Coll Cardiol. 2001;38:1782–1787. doi:10.1016/S0735-1097(01)01627-8
29. Salinerofort MA, San Andrés-Rebollo FJ, de Burgos-lunar C, et al. Five-year incidence of chronic kidney disease (Stage 3–5) and associated risk factors in a Spanish cohort: the MADIABETES Study. PLoS One. 2015;10:e0122030. doi:10.1371/journal.pone.0122030
 © 2020 The Author(s). This work is published and licensed by Dove Medical Press Limited. The full terms of this license are available at https://www.dovepress.com/terms.php and incorporate the Creative Commons Attribution - Non Commercial (unported, v3.0) License.
By accessing the work you hereby accept the Terms. Non-commercial uses of the work are permitted without any further permission from Dove Medical Press Limited, provided the work is properly attributed. For permission for commercial use of this work, please see paragraphs 4.2 and 5 of our Terms.
© 2020 The Author(s). This work is published and licensed by Dove Medical Press Limited. The full terms of this license are available at https://www.dovepress.com/terms.php and incorporate the Creative Commons Attribution - Non Commercial (unported, v3.0) License.
By accessing the work you hereby accept the Terms. Non-commercial uses of the work are permitted without any further permission from Dove Medical Press Limited, provided the work is properly attributed. For permission for commercial use of this work, please see paragraphs 4.2 and 5 of our Terms.