")
Back to Journals » International Journal of Chronic Obstructive Pulmonary Disease » Volume 12
Serum cytokine levels related to exposure to volatile organic compounds and PM2.5 in dwellings and workplaces in French farmers – a mechanism to explain nonsmoking COPD
Authors Audi C, Baïz N, Maesano CN, Ramousse O , Reboulleau D, Magnan A, Caillaud D , Annesi-Maesano I
Received 22 July 2016
Accepted for publication 28 October 2016
Published 5 May 2017 Volume 2017:12 Pages 1363—1374
DOI https://doi.org/10.2147/COPD.S117866
Checked for plagiarism Yes
Review by Single anonymous peer review
Peer reviewer comments 2
Editor who approved publication: Dr Richard Russell
Christelle Audi,1,* Nour Baïz,1,* Cara N Maesano,1 Ollivier Ramousse,2 Damien Reboulleau,3 Antoine Magnan,3 Denis Caillaud,4 Isabella Annesi-Maesano1
1Sorbonne Universités, UPMC Univ Paris 06, INSERM, Institut Pierre Louis d’Epidémiologie et de Santé Publique, UMRS 1136, Epidemiology of Allergic and Respiratory Diseases Department, Medical School Saint-Antoine, Paris, 2Mutualité Sociale Agricole, Clermont-Ferrand, Auvergne, 3Centre du Thorax de Nantes INSERM, UMR1087, Institut du thorax, Nantes, 4Respiratory Diseases Department, CHU Clermont-Ferrand, Clermont-Ferrand, Auvergne, France
*These authors contributed equally to this work
Abstract: Although French farmers smoke less on average than individuals from the general population, they suffer more from COPD. Exposure to biological and chemical air pollutants in the farm may be the cause of these higher COPD rates. This study investigates the role of biocontaminants, including the relationship of exposure to volatile organic compounds (VOCs) and fine particulate matter (of diameter of 2.5 µm [PM2.5]) objectively measured in the farm settings (dwellings and workplaces) to serum cytokines involved in COPD, in a sample of 72 farmers from 50 farms in the Auvergne region, France. Mean concentrations of VOCs were highest inside the home, while levels of PM2.5 were highest in workplaces (stables and granaries). After adjusting for confounders, high exposure to PM2.5 was significantly associated with a decreased level of serum cytokines (among others, IL13: β: –0.94, CI: –1.5 to –0.2, P-value =0.004; IL8: β: –0.82, CI: –1.4 to –0.2, P-value =0.005) and high exposure to VOCs according to a VOC global score with a decreased IL13 level (β: –0.5, CI: –0.9 to –0.1, P-value =0.01). Moreover, respiratory symptoms and diseases, including COPD, were associated with a decreased level of serum cytokines significantly in the case of IL5. An alteration of immune response balance in terms of cytokine levels in relation to indoor chemical air pollution exposure may contribute to respiratory health impairment in farmers.
Keywords: indoor rural air pollution, COPD, French farmers, VOCs, PM2.5, cytokines
Introduction
COPD represents an important public health issue and is one of the major leading causes of chronic morbidity and mortality worldwide.1 Although tobacco smoking is the most common factor in the etiology of COPD, other causal associations have been found among both smokers and nonsmokers between the disease and occupational respirable exposures,2,3 including dusts, gases, vapors and biological and chemical agents.4 In agricultural workers, COPD has been associated with exposure to ammonia, hydrogen sulfide and mineral dust,5 organic dust exposure6 and biomass.7,8 Despite lower rates of smoking in farmers and agricultural workers compared to the general population,9,10 a higher prevalence of COPD has been observed.5,11 In France, research on COPD among agricultural workers dates back to 1989 when Dalphin et al12 studied the prevalence of bronchitis in French dairy producers and concluded that they are at risk of chronic bronchitis. Recently, a French controlled cross-sectional study has demonstrated that farmers have a higher prevalence of COPD than nonfarming working subjects,13 supporting existing evidence of a causal relationship between agricultural exposures and development of this disease.
COPD is characterized by an inflammation that is chronically present in the lower respiratory tract of the patients. Among others, Sahlander et al14 hypothesized that the percentage of Th, cell cytokine and IL profiles and acute responses to pro-inflammatory stimuli, which are considered to be markers of innate immunity, differ between smokers and/or farmers, who are chronically exposed to organic agents, and healthy nonexposed subjects. Th cells producing IL4, IL13 and circulating neutrophils were increased in smokers and farmers. Sundblad et al15 showed an altered airway response to inhaled organic and pro-inflammatory agents, among both farmers and smokers, compared to the general population. Exposure to chemical air pollution has also been linked with increased levels of certain cytokines that are involved in airway inflammation. In the past decade, studies reported on the association between markers of long-term exposure to urban air pollution and chronic perturbations of blood inflammatory markers.16–18 Panasevich et al18 assessed IL6, TNFα, CRP and fibrinogen and reported significantly higher IL6 levels after long-term exposure to elevated residential levels of 30-year average traffic-related NO2. Chuang et al16 assessed two markers of inflammation, IL6 and neutrophils, and reported that an increase in annual average particulate air matter (PM10 and PM2.5, respectively) and NO2 was marginally associated with elevated IL6 and neutrophils. However, Mostafavi et al19 have shown that long-term exposure to NOx was associated with a lower rate of IL2, IL8, IL10 and TNFα. Finally, a toxicological study in Rio de Janeiro showed that suspended particles can either increase or decrease the secretion of cytokines in vitro in the case of human bronchial epithelial cells.20 To date, the relationship between exposure to air pollution and cytokines in rural settings has been rarely investigated.15 Yet, studying the relationship between inflammation and exposure to air pollution, a potential cause of COPD and respiratory health impairment development, becomes interesting, especially in agricultural areas where smoking or higher levels of traffic pollution cannot explain the progression of these health outcomes.
The aim of the present study was to determine the relationship between exposure to objectively assessed VOCs and PM and unusual levels of serum cytokines among farmers, which may be involved in the development of respiratory diseases. Cytokines included TNFα, IFNγ) and IL4, IL5, IL6, IL8, IL10, IL13 and IL17. In order to take into account the fact that individuals are exposed to a cocktail of VOCs at once, we introduced a global score of exposure to VOCs.
Materials and methods
Study population
In the FERMA Study, all patients provided written informed consent and the study was conducted in accordance with the Declaration of Helsinki and the agreement of the local independent ethics committee, Comité de Protection des Personnes Sud-Est 6, AU766 (Ref ID RCB 2008-A000734-51). The study population was drawn from the FERMA (risk factors of the rural environment and the allergic and respiratory diseases) study conducted in the Auvergne region, France. FERMA participants included both men and women, and the study was conducted in two phases. A farmer is defined as the owner of the farmed land or any family member aged >15 years and living in the farm. According to French rural code, a farm is defined as a workplace where agricultural activity is practiced, with a minimal area of installation defined according to the type of agricultural activity and managed by a farm operator.
In the first phase (FERMA Phase I), 494 farmers, both farmers and farm workers, from several cities of the Auvergne region, were recruited between 2009 and 2010 during the compulsory occupational medicine visit conducted by the MSA (FERMA Phase I). This consisted of the administration of a standardized epidemiological questionnaire and a general medical checkup, including clinical tests, some specific to the FERMA survey (blood pressure, pulse, saturation, pulmonary function testing, bronchodilator reversibility testing, eCO, eNO, etc.) as well as biological sampling (blood, urine, saliva [for DNA], etc.).
In the second phase (FERMA Phase II), which began 1 year later, a subsample of 109 farmers living in 50 farms agreed to a follow-up occurring within 2 years from the initial medical visit as well as to an air quality assessment of their homes and workplaces (stable and granary). This phase lasted until 2012. Of the 109 farmers participating in Phase II, 72 with complete data relevant to the present study were selected.
Air pollution measurements and sample collection
Selection of air pollutants
In this study, nine VOCs (out of the 59 VOCs initially assessed) and one size of PM were assessed in relation to pro- and anti-inflammatory cytokines, which may be involved in the development of respiratory diseases. The selection of VOCs was based on their potential impact on air quality and their known toxicity, according to a hierarchical classification designed by a panel of experts, including one of the authors (Dr Isabella Annesi-Maesano; www.air-interieur.org). The VOCs include hexane, benzene, ethylbenzene, trichloroethylene, toluene, tetrachloroethylene, decane isomers, butoxyethyl acetate and undecane isomers. Fine particles (PM2.5) were considered because of their impact on the respiratory system.21
Measurement of indoor air pollutants
Air quality was assessed over a 3-month period within the home in both living room and bedroom, where participants are expected to spend the greatest number of hours, as well inside granaries and stables. Measurements were taken for PM2.5 in all locations, and measurements for VOCs were taken in all locations, except the bedroom. VOCs were measured continuously for 1 week using a Radiello Passive Sampler, references 145 (for BTEX) and 130.22 Passive samplers were placed at a height far from obvious sources of pollution, such as a fireplace, stove and newly purchased or cleaned furniture. VOCs were collected onto Carbograph 4 absorbents contained within the samplers, extracted through thermal desorption and analyzed by gas phase chromatography equipped with flame ionization detection and/or mass spectrometry in a unique laboratory (Fondazione Salvatore Maugeri, Padua, Italy). Simultaneously, an Aerocet 530 device23 was used in mass mode with a 2-minute sampling time to evaluate the mass concentration of PM2.5 (μg/m3).
Cytokines assessments
Cytokines were measured in blood samples frozen at −80°C using a multiplex cytokine assay kit (PRO Mouse Cytokine 23-PLEX, 1×96 [Reference: M60009RDPD/Bio-Rad Laboratories]). Cytokine levels were expressed in picograms per milliliter. The concentrations of cytokines were log transformed in order to limit influence of high concentrations and to normalize distributions.
Health assessments
Respiratory symptoms and diseases were assessed through a standardized questionnaire completed by a physician during a face-to-face interview with the subjects. Respiratory symptoms included morning cough in the past 12 months, phlegm in the past 12 months, shortness of breath in the past 12 months, wheezing in the past 12 months, shortness of breath after intense effort in the past 12 months and instances of suddenly wakening due to an attack of shortness of breath in the past 12 months. Respiratory diseases included asthma, COPD and SAD. Pulmonary function tests were performed, including spirometry using an MIR-Spirobank G spirometer system attached to a laptop computer. COPD and SAD were defined using spirometry. COPD was defined according to the GOLD criteria as FEV/FVC <70% after bronchodilation and SAD as an FEF25–75<80% of the predicted level and FEV/FVC >70%, after bronchodilation during the reversibility test (with salbutamol), taking into account a reduced lung volume as assessed by one of the authors after analysis of the spirometric curve. Asthma was defined on the basis of the following question: “Have you been diagnosed with asthma by a physician?”
Epidemiological and statistical analysis
Exposure variables
In order to study the association with PM exposure and the variation of cytokine levels given the lack of linearity of this relationship, a binary exposure variable was introduced:
- For PM2.5, a subject was considered as having a high exposure (=1) if the average concentration of PM2.5 throughout the entire farm (dwellings and workplaces) was greater than the value of the third quartile of the total distribution and as having a low exposure (=0) if the average concentration of PM2.5 was less or equal to this value.
- For VOCs, a subject was considered to have high exposure to VOCs (=1) if the global VOC score of exposure was ≥4 and a low exposure (=0) if the score was <4.
The global VOC scores were determined by assigning an exposure score, 0 or 1, to each of the nine individual VOC concentrations (averaged over all measurement sites) based on the value of the third quartile for each concentration. High values above this threshold were given an exposure score of 1, and low values below this threshold were given an exposure score of 0. The sum of these nine concentration scores determined the overall global VOC score for each participant and ranged from 0 to 9.24
Descriptive analysis
Descriptive analyses were performed on all variables. Proportions were used in the case of qualitative variables, position (mean and median) and dispersion (standard deviation, first and third quartiles) indicators for quantitative variables such as concentrations of VOCs, PM2.5 mass concentration and cytokine concentrations. A boxplot statistical analysis (median, first and third quartile, min–max) was performed for each exposure variable (PM2.5 and VOCs, respectively) to study their distribution throughout the farm. Air pollutant distributions were provided in the living room, bedroom and the stable/granary separately for PM2.5 and in the living room and the stable/granary for VOCs. A descriptive analysis was also performed for each IL and cytokine. Mean, median, standard deviation, minimum and maximum values for each IL and cytokine were determined.
Relationship between IL/cytokine levels and respiratory symptoms and diseases
In order to verify whether modifications in IL/cytokine levels in relation to PM2.5 and VOCs exposure might constitute a candidate for respiratory health impairment, we analyzed the association between IL/cytokine concentrations and respiratory symptoms and respiratory diseases using the Mann–Whitney U test.
In addition, we examined the effect of modification of the association between IL/cytokine levels and respiratory symptoms and diseases by stratifying the population according to smoking status and testing the interaction term (ie, cytokine level*smoking status). No effect of modification by the smoking status was observed (interaction terms were not significant), showing that smoking status did not have any impact on these health outcomes in our population.
Relationship between exposure to air pollution analysis and IL/cytokine levels
Initially, to examine the association of exposure to air pollutants with cytokine levels, a simple linear regression model was performed with cytokines taken as a continuous, dependent variable and exposure to PM2.5 and VOCs categorized as a dichotomous variable (highly exposed vs otherwise) and an independent variable. Successively, to check whether the relationships persisted after adjustment for confounders, an adjusted multiple regression model was performed. Confounders taken into account were age, sex, the presence or absence of pets, presence or absence of mold in the house and smoking. These factors were chosen based on the literature and previous works conducted by the authors.24 The regression analysis was performed by taking into account the cluster effect of two or more farmers living in the same dwelling. These models were performed through the GENMOD procedure of SAS software. Associations were expressed using the regression coefficient (β) and its 95% CI. Data management and statistical analyses were performed using SAS software version 9.3 (SAS Institute Inc, Cary, NC, USA). P-values <0.05 were considered statistically significant for all analyses.
Results
Descriptive analysis of the study population
The general characteristics of the study population are described in Table 1. Measurements of air pollution were conducted on 50 farms located in three cities of the Auvergne region: Riom-ès-Montagnes (19 farms), Saint-Sauves (19 farms) and Saugues (12 farms). Seventy-two farmers completed the health questionnaire. Forty-six (63.8%) respondents were males and 26 (36.1%) were females, with an overall mean age of 47 years. Nine (12.5%) farmers were current smokers, and 26 (36.1%) were former smokers. Nine (12.5%) had only primary education, while more than half had completed high school (58.3%) and ten (13.8%) had completed higher education. Most farmers had also grown up in a farm (91.6%). Concerning other confounding attributes; 88.8% of farmers reported having pets at home, while 5.6% declared having mold and fungi in their house. Demographic and agricultural characteristics of farmers participating in FERMA Phase II and those having participated in the FERMA Phase I were similar (data not shown).
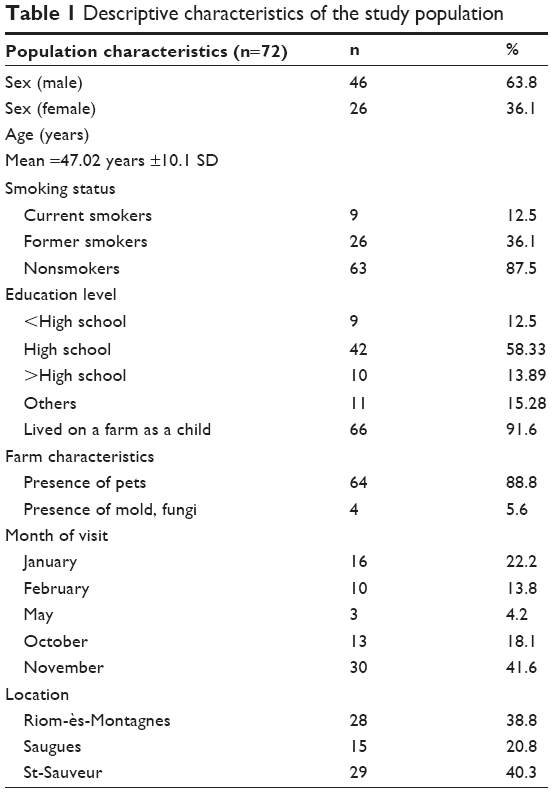 | Table 1 Descriptive characteristics of the study population |
Air quality and exposure among farmers
Four VOCs were detected below the LD (which is the lowest analyte concentration that can be detected, but not necessarily quantified) in >60% of the living rooms, and six VOCs had values between LD and LQ (which is the lowest concentration at which the analyte can not only be reliably detected, but some predefined goals for bias and imprecision are also met) in 20% of the living rooms. Similarly, >70% of stables had four VOC values detected below the LD and five VOCs had values between LD and LQ in >15% of the stables. More than 60% of granaries had values of four VOCs under the LD, and values of three VOCs were detected between LD and LQ in >30% of granaries. VOCs were measured in all workplaces and dwellings. Only 33 farms had VOC measurements done in the stable, and 19 had measurements performed in the granary. The distribution of VOCs in all settings is presented as a boxplot in Figure 1. Most VOCs had higher mean values in the living room, followed by the granary. The stables had the lowest mean concentrations of VOCs (Table S1). A graph representing the global VOC scores in terms of number of farms is presented in Figure 2. The global score of exposure to VOCs varied between farms; ten farms had a score of 3 (indicating that there were elevated levels of three VOCs), nine had a score of 4, six and two farms were highly polluted with a score of 5 and 6, respectively.
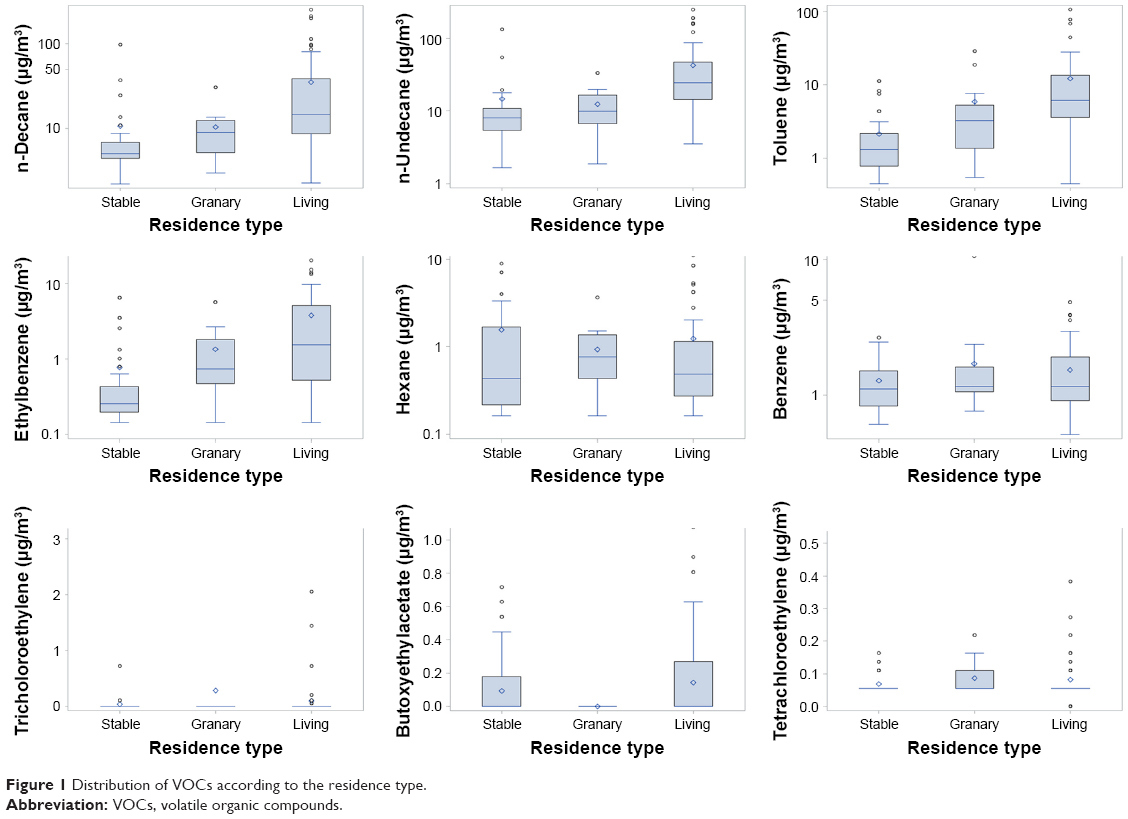 | Figure 1 Distribution of VOCs according to the residence type. |
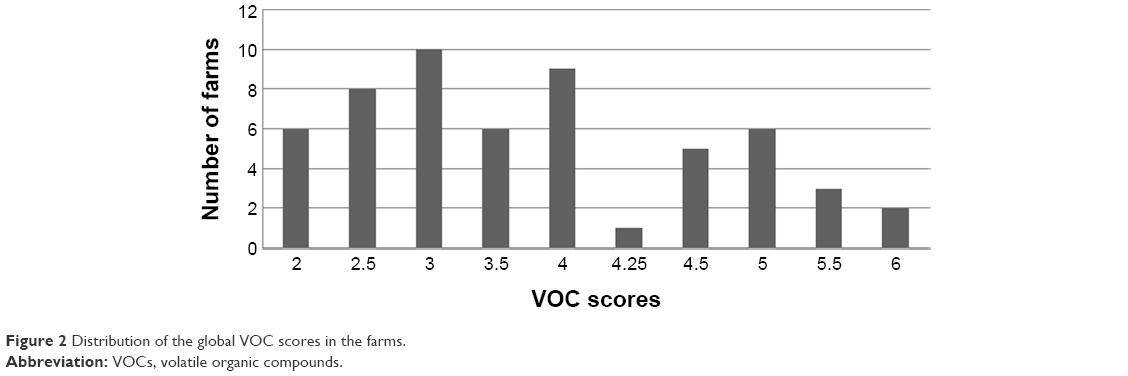 | Figure 2 Distribution of the global VOC scores in the farms. |
The distribution of PM2.5 in workplaces and dwellings is presented as a boxplot in Figure 3. The workplaces (stables and granaries) presented the highest mean value of PM2.5 (11 μg/m3), with the highest median value (3 μg/m3) and the highest third quartile value (8 μg/m3; Table S2). Living rooms and bedrooms had similar PM2.5 values. PM2.5 measures in stables and granaries were presented together as a single measure.
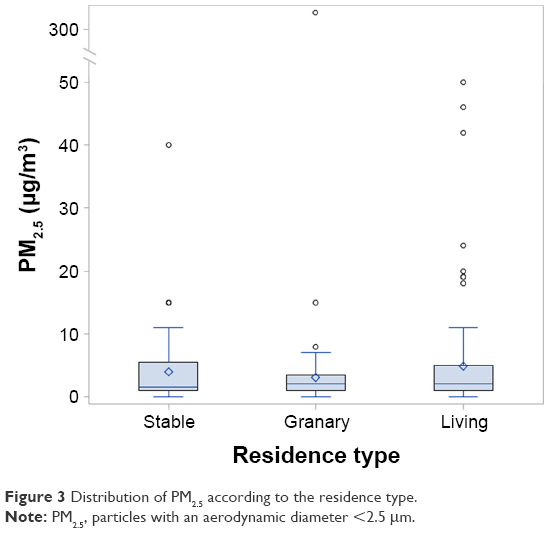 | Figure 3 Distribution of PM2.5 according to the residence type. |
Cytokine levels among farmers
The distribution rates of each cytokine and IL are presented as a histogram in Figure 4. Almost all of our study population had very low levels of cytokines in the serum: the mean values of ILs were between 6 pg/mL and 25 pg/mL, and those of cytokines TNFα and IFNγ were 83.02 pg/mL and 201.79 pg/mL, respectively.
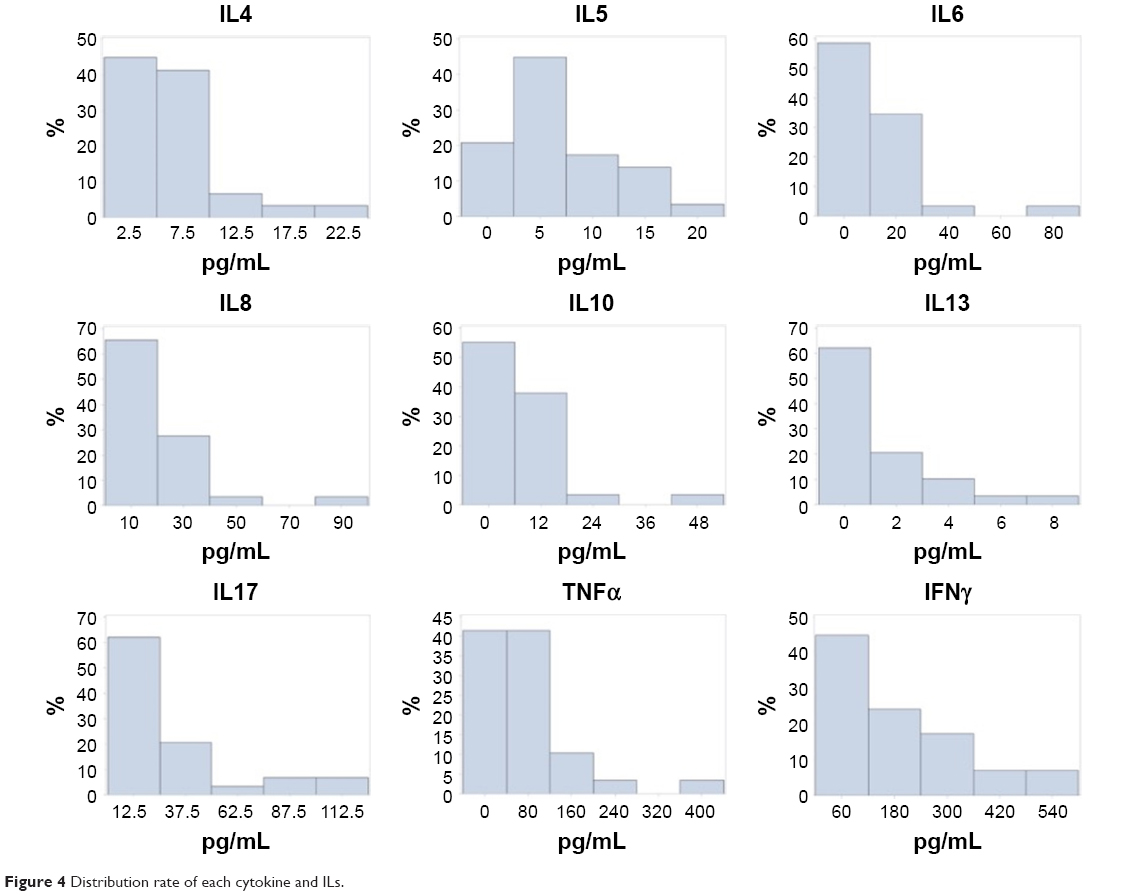 | Figure 4 Distribution rate of each cytokine and ILs. |
Relationship between IL/cytokine levels and respiratory symptoms and diseases
Subjects with morning cough in the past 12 months had lower levels of IL5 and IL10 with borderline significance (P=0.08 and P=0.09, respectively; Table 2). Subjects woken up by an attack of shortness of breath in the past 12 months as well as subjects suffering from COPD had a significantly lower concentration of IL5 (P=0.009 and P=0.008, respectively; Table 2). These subjects also had lower levels of IL4, IL8, IL10, IL17, IFNγ and TNFα. Asthmatic subjects had lower levels of IL4, IFNγ and TNFα, with borderline significance (Table 2).
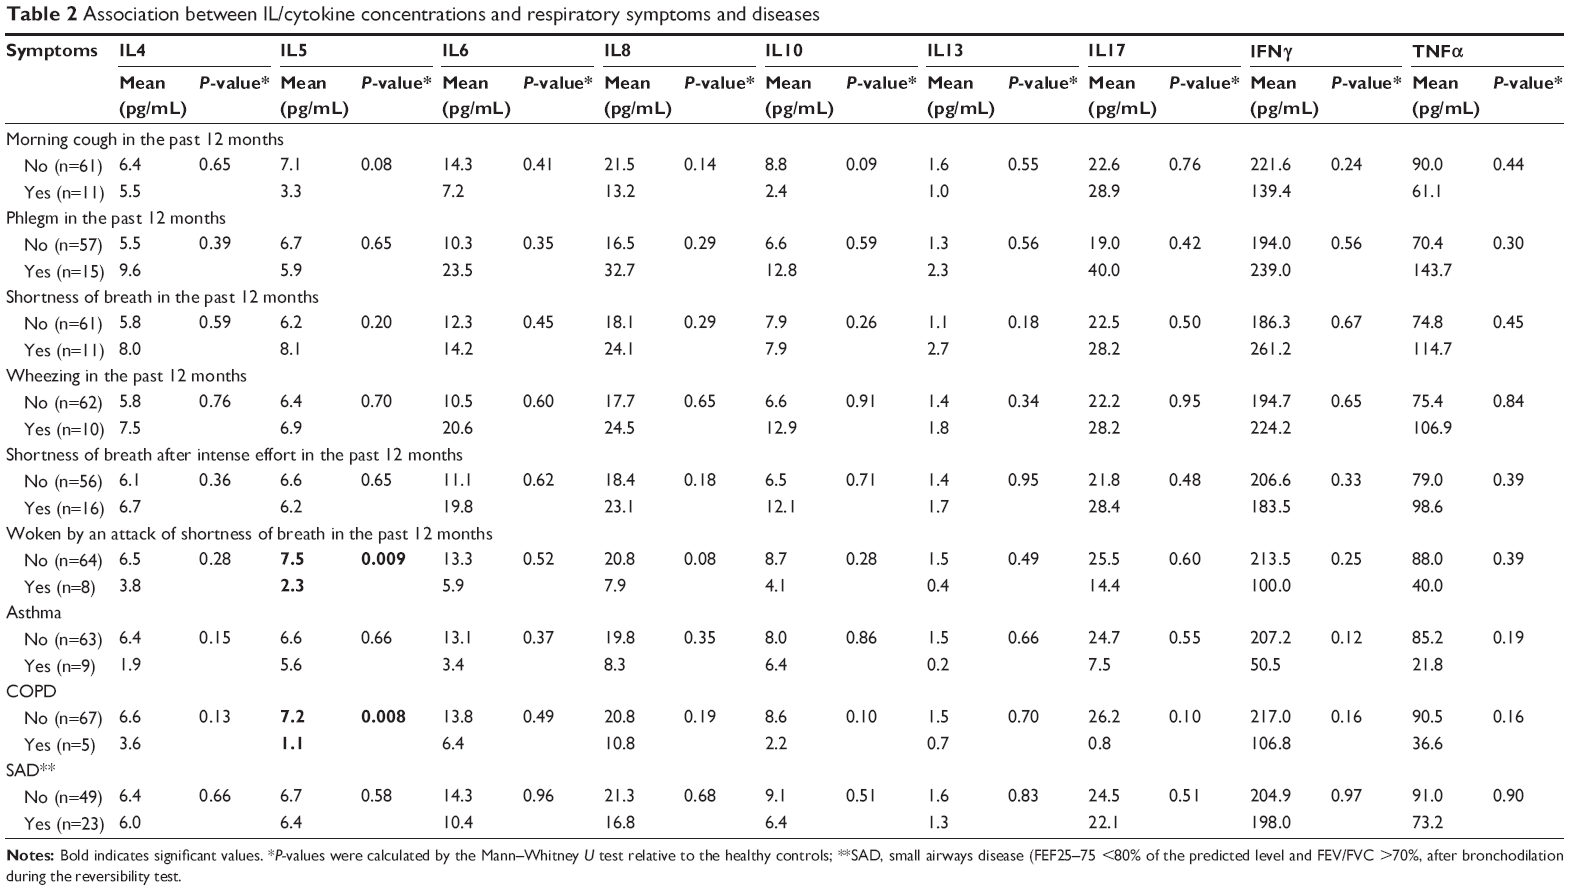 | Table 2 Association between IL/cytokine concentrations and respiratory symptoms and diseases |
Relationship between exposure to air pollution and the distribution of inflammatory cytokines and ILs
Tables 3 and 4 show the results of multiple linear regression models of the associations between dependent variables, ie, each cytokine, and independent variables, ie, the exposure to PM2.5 and VOC scores, as well as confounding variables. The VOCs score was statistically associated only with an alteration in IL13 for which a decreased level was observed after adjustment: β: −0.5, CI: −0.9 to −0.1, P-value =0.01. Exposure to PM2.5 was statistically inversely related to IL4, IL6, IL8 and IL13 as well as to IFNγ and TNFα. All linear regression coefficients were negative, thus indicating that farmers’ exposure to PM2.5 leads to a reduction in cytokine level. For example, IL8: β: −0.82, CI: −1.4 to −0.2, P-value =1.003 and IL13: β: −0.94, CI: −1.5 to −0.2, P-value =0.004, respectively.
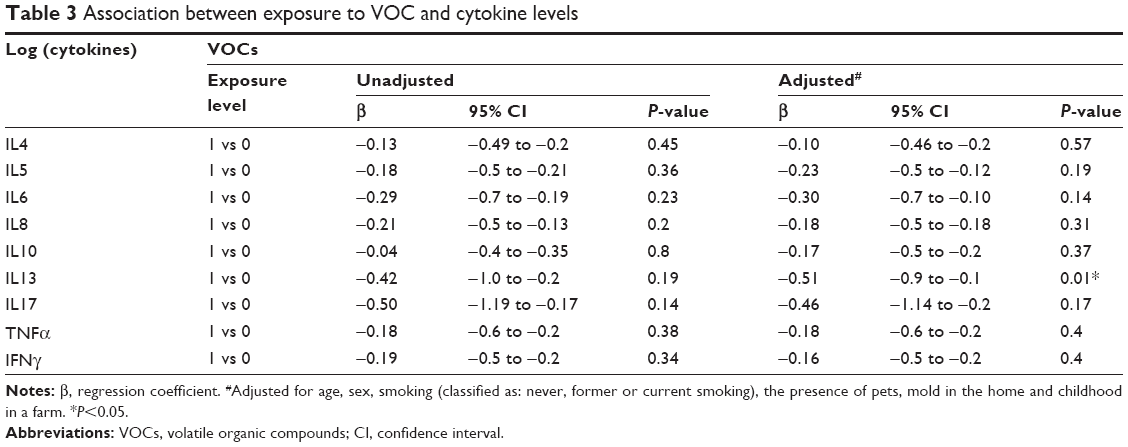 | Table 3 Association between exposure to VOC and cytokine levels |
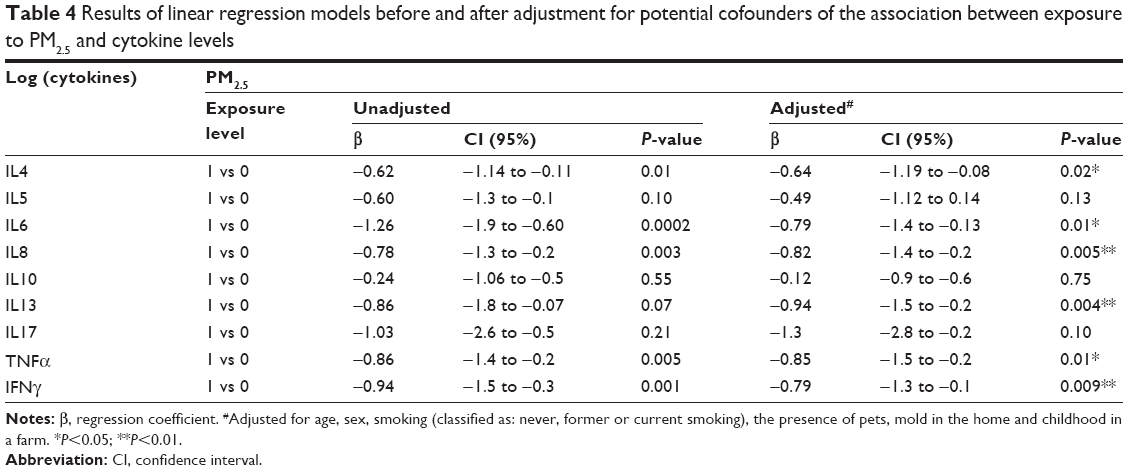 | Table 4 Results of linear regression models before and after adjustment for potential cofounders of the association between exposure to PM2.5 and cytokine levels |
Discussion
Main findings and literature
Our data show an inverse relationship of indoor chemical air pollutants in the farm and serum inflammatory cytokines in their occupants. This may help to explain the existence of COPD among farmers in the absence of significant smoking habits. Furthermore, the associations found between respiratory symptoms and diseases and decreased levels of cytokines further support this hypothesis. Thus, the alteration of the inflammatory profile associated with exposure to VOCs and PM2.5 observed in our study may be involved in the development of respiratory diseases such as COPD among exposed farmers. For a long time, the bronchial epithelium was considered as a simple physical barrier that mechanically prevents the passage of inhaled polluting particles. However, it is now clear that the bronchial epithelium plays a crucial role in the initiation of pulmonary defenses, a complex process involving a wide range of molecules, mediators and immune cells. The hypothesis can be raised that the malfunction of one or the other of these systems that may lead to the development of chronic airway inflammation, which is typical of COPD, is due to exposure to air pollution. In our study, the strongest relationship with these markers was found for PM, probably because the inhalation of fine particles brings them in direct contact with the lung and the alveoli.
This finding of an inverse association between exposure to air pollution and cytokines is in contrast with the results from previous studies on long-term exposure to air pollution and markers of inflammation, which have generally reported positive associations.18 Similarly, in their studies on an animal model, Pedroza et al25 showed a pro-inflammatory action of IL6 in chronic and inflammatory airway diseases. However, more recently, Mostafavi et al19 have shown that long-term exposure to NOx was associated with a lower rate of IL2, IL8, IL10 and TNFα. Similarly, a study by Forbes et al17 showed negative associations between long-term exposure to air pollution and markers of inflammation. In addition, some studies of short-term air pollution also reported inverse associations with selected inflammatory markers (fibrinogen26 and IL6).27 Inverse associations with markers of inflammation were observed with other markers such as endotoxin28 and carbon monoxide.29 Finally, an epidemiological study using induced sputum, a relevant marker of lung inflammation, also showed an altered inflammatory profile in a population of farmers facing rural air pollution, including organic pollution.15 The concentration of IL6 in induced sputum decreased in farmers exposed to biological agents, such as organic dust. The researchers concluded that subjects who are repeatedly exposed to organic matter might develop a certain adaptation.15 Furthermore, toxicological studies have shown inhibition of IL6 and IL8 after exposure to PM.30–34 Recently, Rodriguez-Cotto et al20 showed that PM in the city of Rio de Janeiro can either increase or decrease the secretion of cytokines in vitro while being site specific and time dependent. Previously, PM exposure had been shown to activate or inhibit the secretion of IL8 in vitro.35
The reasons for the inverse associations we observed between air pollution exposure and cytokine levels remain unclear. However, two hypotheses arise regarding possible biological mechanisms: the deregulation of the inflammatory system could correspond to an immunosuppressive action or result from compartmentalization of organs, respectively. The immunosuppressive action generated by the pollutants could be the result of an adaptation phenomenon that develops following exposure to air pollutant. Alternatively, the inflammatory parameters measured in circulating blood may not reflect the inflammatory condition of the lungs. We think that both hypotheses are possible depending on the type of cytokines and ILs.
In terms of the natural history of COPD, the cytokines we chose are of interest. IL4 is involved in asthma but there is no evidence so far of its involvement in COPD. Similarly, IL5 is central to the initiation and sustenance of eosinophilic airway inflammation typical of asthma. The decrease in IL4 and IL5 with exposure to PM in our population is compatible with the existence of COPD in these individuals. IL6, among others, exerts a protective action of the epithelium by inhibiting the production of pro-inflammatory cytokines, TNF and IL1B.25 In our study, farmers exposed to PM had lower IL6 levels as evidence of this phenomenon. IL8 is produced under inflammation stimulation and attracts and activates neutrophilic granulocyte.36 Its diminution could modify the immune response. IL10 is an immunoregulatory cytokine mainly secreted not only by macrophages but also by Th1 and Th2 lymphocytes, dendritic cells, cytotoxic T-cells, B lymphocytes, monocytes and mast cells. IL10 inhibits the capacity of monocytes and macrophages to present antigen to T-cells and therefore downregulates the expression of IL1β, IL6, IL8, IL12 and TNFα.37 IL13 plays an important role in protecting the lung and its diminution could promote COPD development. IL17 has a prime role in neutrophilia and airway smooth muscle38,39 typical of asthma. Serum IL17 has not been associated with COPD. However, Di Stefano et al40 obtained bronchial mucosa biopsies from patients with stable COPD and found that the levels of IL17A were increased in their bronchial mucosa, which could be due to the type of specimen used. IFNγ could be compromised by PM as it is in the case of tobacco smoke.41 Finally, TNFα is involved in the innate immune response.42
Study strengths and limitations
While there have been studies employing a multipollutant approach to assess exposure to several VOCs in urban dwellings,43,44 this study contributes to the literature by bringing a multipollutant analysis in a rural area where potential sources of VOCs, both indoor and outdoor, are also numerous. In addition, cytokines have been scarcely related to objective air pollution assessments in rural settings using an epidemiological approach taking into account potential confounders of the relationships.
Our study presents, however, certain limitations. Cytokines were measured from whole blood and may not represent those secreted by the lungs. The survey was conducted only in the Auvergne region, which is not representative of other farming regions in France or elsewhere. In addition, the number of farms in the study was limited. As statistical significance depends in part on the sample size, minimal but important differences from a clinical point of view may go unnoticed if the sample size is small as in our case. However, in spite of the small sample size, we observed highly significant relationships that do not seem to be due to chance. Finally, one of the most important limitations is the fact that we assumed that assessment of both serum markers and air pollutants was representative of the usual situation. Cytokine assessments were done once at the beginning of the survey and air pollution assessments were carried out during a limited period (1 week) considered as typical of usual individual exposure.
Conclusion
This study showed a significant association between exposure to common chemical air pollutants of the rural environment, VOCs and PM2.5, and a decrease in cytokine levels in French farmers of the Auvergne region. Decrease in cytokine levels in relation to PM2.5 and VOCs exposure might constitute a candidate for respiratory health impairment, through an alteration of immune response and thus be one potential leading cause of COPD. This alteration of cytokine levels appears to depend on several events and signaling pathways.31,45 Overall, this study provides a basis for future studies necessary to confirm and clarify our results.
Abbreviations
VOCs, volatile organic compounds; PM, particulate matter; PM10, particles with an aerodynamic diameter <10 μm; PM2.5, particles with an aerodynamic diameter <2.5 μm; UFPM, ultrafine PM; TSP, total suspended particulates; LD, limit of detection; LQ, limit of quantification; β, linear regression coefficient; Th, T-helper; MSA, Mutuelle des Salariés Agricoles; eCO, exhaled carbon monoxide; eNO, exhaled nitrogen monoxide; SAD, small airways disease.
Acknowledgments
The authors would like to thank Amir Moustafa for his help with the data management. This publication arises from the project FERMA supported by the French National Research Program for Environmental and Occupational Health of ANSES (EST-07-71).
Disclosure
The authors report no conflicts of interest in this work.
References
Omland O, Wurtz ET, Aasen TB, et al. Occupational chronic obstructive pulmonary disease: a systematic literature review. Scand J Work Environ Health. 2014;40(1):19–35. | ||
Eisner MD, Anthonisen N, Coultas D, et al; Committee on Nonsmoking COPD, Environmental and Occupational Health Assembly. An official American Thoracic Society public policy statement: novel risk factors and the global burden of chronic obstructive pulmonary disease. Am J Respir Crit Care Med. 2010;182(5):693–718. | ||
Ryu JY, Sunwoo YE, Lee SY, et al. Chronic obstructive pulmonary disease (COPD) and vapors, gases, dusts, or fumes (VGDF): a meta-analysis. COPD. 2015;12(4):374–380. | ||
Allain YM, Roche N, Huchon G. Pollution atmosphérique, facteur de risque des BPCO? [Atmospheric air pollution: a risk factor for COPD?]. Rev Mal Respir. 2010;27(4):349–363. French. | ||
Eduard W, Pearce N, Douwes J. Chronic bronchitis, COPD, and lung function in farmers: the role of biological agents. Chest. 2009;136(3):716–725. | ||
Wurtz ET, Schlunssen V, Malling TH, Hansen JG, Omland O. Occupational chronic obstructive pulmonary disease in a Danish population-based study. COPD. 2015;12(4):435–443. | ||
Kurmi OP, Semple S, Devereux GS, et al. The effect of exposure to biomass smoke on respiratory symptoms in adult rural and urban Nepalese populations. Environ Health. 2014;13:92. | ||
Salvi S. Tobacco smoking and environmental risk factors for chronic obstructive pulmonary disease. Clin Chest Med. 2014;35(1):17–27. | ||
Hoppin JA, Umbach DM, Long S, et al. Respiratory disease in United States farmers. Occup Environ Med. 2014;71(7):484–491. | ||
Leveque-Morlais N, Tual S, Clin B, Adjemian A, Baldi I, Lebailly P. The AGRIculture and CANcer (AGRICAN) cohort study: enrollment and causes of death for the 2005–2009 period. Int Arch Occup Environ Health. 2015;88(1):61–73. | ||
Robbe P, Spierenburg EA, Draijer C, et al. Shifted T-cell 1 after agricultural dust exposure in mice and men. Thorax. 2014;69(7):630–637. | ||
Dalphin JC, Bildstein F, Pernet D, Dubiez A, Depierre A. Prevalence of chronic bronchitis and respiratory function in a group of dairy farmers in the French Doubs province. Chest. 1989;95(6):1244–1247. | ||
Guillien A, Puyraveau M, Soumagne T, et al. Prevalence and risk factors for COPD in farmers: a cross-sectional controlled study. Eur Respir J. 2016;47(1):95–103. | ||
Sahlander K, Larsson K, Palmberg L. Altered innate immune response in farmers and smokers. Innate Immun. 2010;16(1):27–38. | ||
Sundblad BM, von Scheele I, Palmberg L, Olsson M, Larsson K. Repeated exposure to organic material alters inflammatory and physiological airway responses. Eur Respir J. 2009;34(1):80–88. | ||
Chuang KJ, Yan YH, Chiu SY, Cheng TJ. Long-term air pollution exposure and risk factors for cardiovascular diseases among the elderly in Taiwan. Occup Environ Med. 2011;68(1):64–68. | ||
Forbes LJ, Patel MD, Rudnicka AR, et al. Chronic exposure to outdoor air pollution and markers of systemic inflammation. Epidemiology. 2009;20(2):245–253. | ||
Panasevich S, Leander K, Rosenlund M, et al. Associations of long- and short-term air pollution exposure with markers of inflammation and coagulation in a population sample. Occup Environ Med. 2009;66(11):747–753. | ||
Mostafavi N, Vlaanderen J, Chadeau-Hyam M, et al. Inflammatory markers in relation to long-term air pollution. Environ Int. 2015;81:1–7. | ||
Rodriguez-Cotto RI, Ortiz-Martinez MG, Rivera-Ramirez E, et al. Particle pollution in Rio de Janeiro, Brazil: increase and decrease of pro-inflammatory cytokines IL-6 and IL-8 in human lung cells. Environ Pollut. 2014;194:112–120. | ||
Pollution JWCTFoHAoA. Health Effects of Particulate Matter; 2013. Available from: http://www.euro.who.int/__data/assets/pdf_file/0006/189051/Health-effects-of-particulate-matter-final-Eng.pdf. Accessed November 30, 2016. | ||
Sigma-Aldrich [webpage on the Internet]. radiello® Passive Air Sampler Overview and Applications. Available from: http://www.sigmaaldrich.com/technical-documents/articles/analytical/radiello-air-sampler.html. Accessed November 30, 2016. | ||
Air Quality [webpage on the Internet]. Aerocet-531S Mass Particle Counter/Dust Monitor. Available from: http://www.metone.com/particulate-aero531.php. Accessed November 30, 2016. | ||
Billionnet C, Sherrill D, Annesi-Maesano I; GERIE Study. Estimating the health effects of exposure to multi-pollutant mixture. Ann Epidemiol. 2012;22(2):126–141. | ||
Pedroza M, Schneider DJ, Karmouty-Quintana H, et al. Interleukin-6 contributes to inflammation and remodeling in a model of adenosine mediated lung injury. PLoS One. 2011;6(7):e22667. | ||
Seaton A, Soutar A, Crawford V, et al. Particulate air pollution and the blood. Thorax. 1999;54(11):1027–1032. | ||
Ruckerl R, Greven S, Ljungman P, et al; AIRGENE Study Group. Air pollution and inflammation (interleukin-6, C-reactive protein, fibrinogen) in myocardial infarction survivors. Environ Health Perspect. 2007;115(7):1072–1080. | ||
Lauw FN, ten Hove T, Dekkers PE, de Jonge E, van Deventer SJ, van Der Poll T. Reduced Th1, but not Th2, cytokine production by lymphocytes after in vivo exposure of healthy subjects to endotoxin. Infect Immun. 2000;68(3):1014–1018. | ||
Morse D, Pischke SE, Zhou Z, et al. Suppression of inflammatory cytokine production by carbon monoxide involves the JNK pathway and AP-1. J Biol Chem. 2003;278(39):36993–36998. | ||
Alfaro-Moreno E, Nawrot TS, Nemmar A, Nemery B. Particulate matter in the environment: pulmonary and cardiovascular effects. Curr Opin Pulm Med. 2007;13(2):98–106. | ||
Alfaro-Moreno E, Torres V, Miranda J, et al. Induction of IL-6 and inhibition of IL-8 secretion in the human airway cell line Calu-3 by urban particulate matter collected with a modified method of PM sampling. Environ Res. 2009;109(5):528–535. | ||
Fuentes-Mattei E, Rivera E, Gioda A, Sanchez-Rivera D, Roman-Velazquez FR, Jimenez-Velez BD. Use of human bronchial epithelial cells (BEAS-2B) to study immunological markers resulting from exposure to PM(2.5) organic extract from Puerto Rico. Toxicol Appl Pharmacol. 2010;243(3):381–389. | ||
Gioda A, Fuentes-Mattei E, Jimenez-Velez B. Evaluation of cytokine expression in BEAS cells exposed to fine particulate matter (PM2.5) from specialized indoor environments. Int J Environ Health Res. 2011;21(2):106–119. | ||
Schwarze PE, Totlandsdal AI, Lag M, Refsnes M, Holme JA, Ovrevik J. Inflammation-related effects of diesel engine exhaust particles: studies on lung cells in vitro. Biomed Res Int. 2013;2013:685142. | ||
Becker S, Mundandhara S, Devlin RB, Madden M. Regulation of cytokine production in human alveolar macrophages and airway epithelial cells in response to ambient air pollution particles: further mechanistic studies. Toxicol Appl Pharmacol. 2005;207(2 suppl):269–275. | ||
Zarogoulidis P, Katsikogianni F, Tsiouda T, Sakkas A, Katsikogiannis N, Zarogoulidis K. Interleukin-8 and interleukin-17 for cancer. Cancer Invest. 2014;32(5):197–205. | ||
Trifunovic J, Miller L, Debeljak Z, Horvat V. Pathologic patterns of interleukin 10 expression – a review. Biochem Med (Zagreb). 2015;25(1):36–48. | ||
Chesne J, Braza F, Chadeuf G, et al. Prime role of IL-17A in neutrophilia and airway smooth muscle contraction in a house dust mite-induced allergic asthma model. J Allergy Clin Immunol. 2015;135(6):1643–1643. | ||
Chesne J, Braza F, Mahay G, Brouard S, Aronica M, Magnan A. IL-17 in severe asthma. Where do we stand? Am J Respir Crit Care Med. 2014;190(10):1094–1101. | ||
Di Stefano A, Caramori G, Gnemmi I, et al. T helper type 17-related cytokine expression is increased in the bronchial mucosa of stable chronic obstructive pulmonary disease patients. Clin Exp Immunol. 2009;157(2):316–324. | ||
Lugade AA, Bogner PN, Thatcher TH, Sime PJ, Phipps RP, Thanavala Y. Cigarette smoke exposure exacerbates lung inflammation and compromises immunity to bacterial infection. J Immunol. 2014;192(11):5226–5235. | ||
Clark IA. The advent of the cytokine storm. Immunol Cell Biol. 2007;85(4):271–273. | ||
Arif AA, Shah SM. Association between personal exposure to volatile organic compounds and asthma among US adult population. Int Arch Occup Environ Health. 2007;80(8):711–719. | ||
Billionnet C, Gay E, Kirchner S, Leynaert B, Annesi-Maesano I. Quantitative assessments of indoor air pollution and respiratory health in a population-based sample of French dwellings. Environ Res. 2011;111(3):425–434. | ||
Martin LD, Rochelle LG, Fischer BM, Krunkosky TM, Adler KB. Airway epithelium as an effector of inflammation: molecular regulation of secondary mediators. Eur Respir J. 1997;10(9):2139–2146. |
Supplementary materials
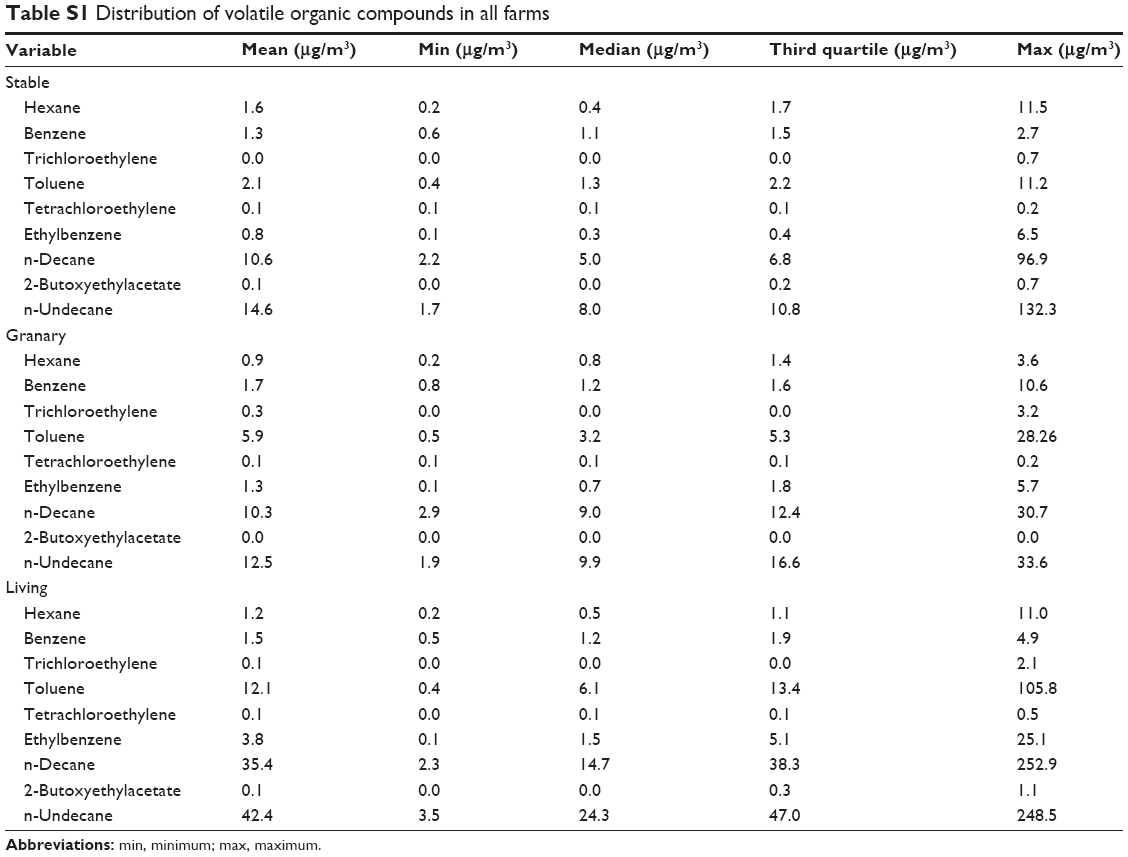 | Table S1 Distribution of volatile organic compounds in all farms |
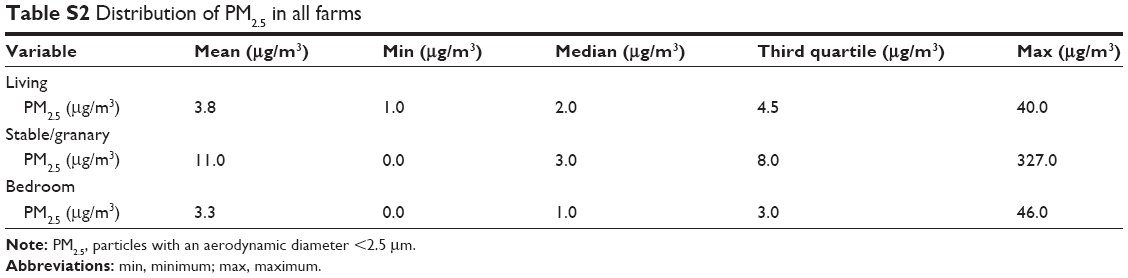 | Table S2 Distribution of PM2.5 in all farms |
 © 2017 The Author(s). This work is published and licensed by Dove Medical Press Limited. The full terms of this license are available at https://www.dovepress.com/terms.php and incorporate the Creative Commons Attribution - Non Commercial (unported, v3.0) License.
By accessing the work you hereby accept the Terms. Non-commercial uses of the work are permitted without any further permission from Dove Medical Press Limited, provided the work is properly attributed. For permission for commercial use of this work, please see paragraphs 4.2 and 5 of our Terms.
© 2017 The Author(s). This work is published and licensed by Dove Medical Press Limited. The full terms of this license are available at https://www.dovepress.com/terms.php and incorporate the Creative Commons Attribution - Non Commercial (unported, v3.0) License.
By accessing the work you hereby accept the Terms. Non-commercial uses of the work are permitted without any further permission from Dove Medical Press Limited, provided the work is properly attributed. For permission for commercial use of this work, please see paragraphs 4.2 and 5 of our Terms.