")
Back to Journals » OncoTargets and Therapy » Volume 9
Serum biomarker panels for diagnosis of gastric cancer
Authors Tong W, Ye F, He L, Cui L, Cui M, Hu Y, Li W, Jiang J, Zhang D, Suo J
Received 6 April 2015
Accepted for publication 22 June 2015
Published 26 April 2016 Volume 2016:9 Pages 2455—2463
DOI https://doi.org/10.2147/OTT.S86139
Checked for plagiarism Yes
Review by Single anonymous peer review
Peer reviewer comments 3
Editor who approved publication: Professor Daniele Santini
Weihua Tong,1 Fei Ye,2 Liang He,1 Lifeng Cui,1 Miao Cui,2 Yuan Hu,2 Wei Li,1 Jing Jiang,3 David Y Zhang,2 Jian Suo1
1Department of Gastrointestinal Surgery, The First Hospital, Jilin University, Changchun, Jilin, People’s Republic of China; 2Department of Pathology, Icahn School of Medicine at Mount Sinai, New York, NY, USA; 3Division of Clinical Epidemiology, The First Hospital, Jilin University, Changchun, Jilin, People’s Republic of China
Purpose: Currently, serum biomarkers that are sufficiently sensitive and specific for early detection and risk classification of gastric adenocarcinomas are not known. In this study, ten serum markers were assessed using the Luminex system and enzyme-linked immunosorbent assay for the diagnosis of gastric cancer and analysis of the relation between prognosis and metastases.
Patients and methods: A training set consisting of 228 gastric adenocarcinoma and 190 control samples was examined. A Luminex multiplex panel with nine biomarkers, consisting of three proteins discovered through our previous studies and six proteins previously reported to be cancer-associated, was constructed. One additional biomarker was detected using a commercial kit containing EDTA. Logistic regression, random forest (RF), and support vector machine (SVM) were used to identify the panel of discriminatory biomarkers in the training set. After selecting five proteins as candidate biomarkers, multivariate classification analyses were used to identify algorithms for diagnostic biomarker combinations. These algorithms were independently validated using a set of 57 gastric adenocarcinoma and 48 control samples.
Results: Serum pepsinogen I, serum pepsinogen II, A Disintegrin And Metalloproteinase domain-containing protein 8 (ADAM8), vascular endothelial growth factor (VEGF), and serum IgG to Helicobacter pylori were selected as classifiers in the three algorithms. These algorithms differentiated between the majority of gastric adenocarcinoma and control serum samples in the training/test set with high accuracy (RF 79.0%, SVM 83.8%, logistic regression 76.2%). These algorithms also differentiated the samples in the validation set (accuracy: RF 82.5%, SVM 86.1%, logistic regression 78.7%).
Conclusion: A panel of combinatorial biomarkers comprising VEGF, ADAM8, IgG to H. pylori, serum pepsinogen I, and pepsinogen II were developed. The use of biomarkers is a less invasive method for the diagnosis of gastric adenocarcinoma. They may supplement clinical gastroscopic evaluation of symptomatic gastric cancer patients and enhance the diagnostic accuracy.
Keywords: gastric adenocarcinoma, cancer diagnosis, cancer screening, Luminex
Introduction
Gastric adenocarcinoma accounts for 40% of all new gastric cancer cases worldwide. It is the fifth most common cancer globally and the third most common cause of cancer-related deaths (estimated 723,000 deaths, 8.8% of the total in 2012),1 mainly because of a late diagnosis. The disease is particularly prevalent in Far Eastern countries. Gastric adenocarcinoma is the most common malignancy in the People’s Republic of China, and was the second leading cause of death by malignancy (14.33%) in 2012.2 Gastric cancer patients have considerably lower survival rates than those with other gastroenterological tract cancers, except for cancer of the esophagus. Five-year survival rates of patients with localized disease (stages I, II, N0) (63.2%) decreased to 28.4% after the cancer spread to regional lymph nodes (stages II, III, N1–N3), and to 3.9% following the detection of distant metastases (stage IV).3
An early diagnosis coupled with good treatment strategy for gastric cancer can significantly improve the survival rates. Esophagogastroduodenoscopy is the most reliable method for diagnosis of gastric adenocarcinoma. It is used broadly in gastroscopy in the People’s Republic of China, South Korea, and Japan because of the high incidence of gastric adenocarcinoma in these countries. South Korea and Japan are the only two countries that provide a government-sponsored screening program for gastric cancer. These resulted in low mortality-to-incidence ratio (0.43 in Japan, 0.35 in South Korea), indicating the benefits of population-based screening in high-prevalence regions.1 The screening programs run in these countries include gastroscopy and serology tests. However, the feasibility and effectiveness of gastroscopy is questionable for the countries with low incidence rates for gastric cancers.
Hence, serum biomarkers that identify patients with high risk for gastric adenocarcinoma would increase the effectiveness of endoscopy and improve the early diagnosis rate. In past decades, studies have revealed several serum biomarkers for gastric cancer which comprise carcinoembryonic antigen, cancer antigen (CA) 19-9, and CA 72-4, among others. However, the sensitivity of these serum biomarkers used during diagnosis of gastric adenocarcinoma (20%–30%) is lower as compared to other cancers.4–6 Resent proteomic-based research identified several significantly more selective and specific biomarkers.7 Also, miRNAs are emerging as a new potentially important tool in diagnostics of gastric cancer.8 These new approaches, however, often require specific technique and expensive instrumentation and cannot be used for routine screening tests.
Traditionally, the detection of serum markers was done using the enzyme-linked immunosorbent assay (ELISA). However, the disadvantage of this method is that it requires larger volumes of sample and incurs high costs compared to the recent method of multiplex detection. The Luminex® xMAP® technology enables the large numbers of biological tests to be conducted and analyzed quickly, cost-effectively, and accurately as compared to the ELISA tests.
In this study, we developed a diagnostic serum biomarker panel using Luminex multiplex technology and validated its performance by differentiating the patients with gastric adenocarcinoma from the healthy controls.
Materials and methods
Patient samples
During 2008–2010, serum samples were collected from patients (n=285) with newly diagnosed primary gastric adenocarcinoma without the presence of other cancers at The First Hospital of Jilin University, Changchun, People’s Republic of China. All gastric cancer patients underwent radical tumor resection with histologically confirmed diagnosis of gastric adenocarcinoma. Control samples (n=238) were collected from attendees of the health check-up program from the same hospital between 2008 and 2010. Patients from the control group had no history of cancer. All participants underwent: 1) routine medical history and physical examination; 2) routine blood and Helicobacter pylori IgG tests; 3) chest X-ray; 4) abdominal ultrasound investigation or computed tomography scan; 5) gastroduodenoscopy; and 6) mammography in women. Two hundred and thirty-eight control samples without inflammatory conditions, or confirmed or suspected cancer that needed medical treatment, were included. All blood samples were collected before any medical treatment in the early morning. Peripheral blood was collected and stored in SST II tubes (BD, Franklin Lakes, NJ, USA) at room temperature for 1hour, then centrifuged at 3,000×g for 5minutes. Supernatants were collected, separated in aliquots, and stored at -80°C. All participants signed an informed consent form. The study was approved by the Institutional Review Board at The First Hospital of Jilin University.
Clinical data on demographics and pathological characteristics were available for all patients whose serum samples were used for this study (Table 1). The T status, N status, and TNM stage of each tumor were classified according to the seventh edition of the AJCC classification.9
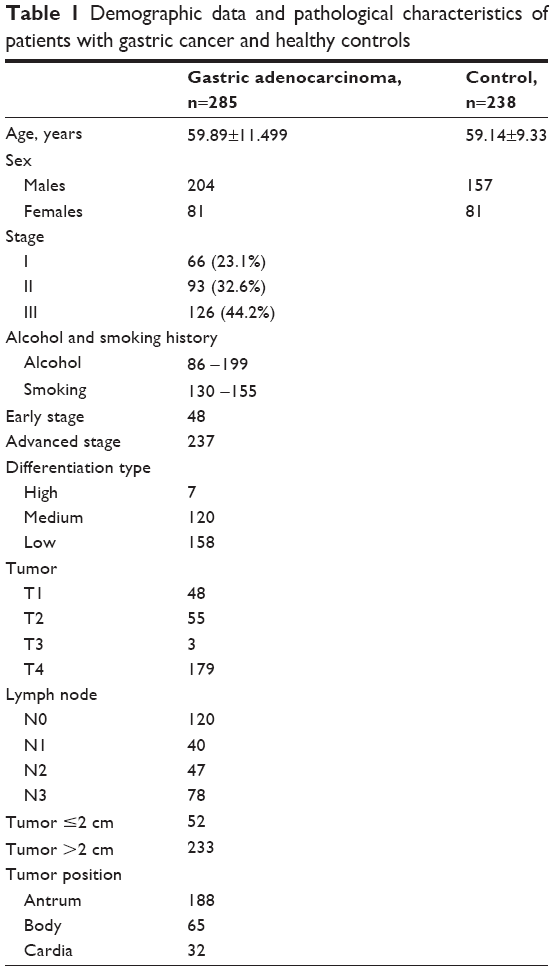 | Table 1 Demographic data and pathological characteristics of patients with gastric cancer and healthy controls |
Samples were randomly divided into two datasets. Serum samples from 228 patients with gastric adenocarcinoma and 190 control serum samples were grouped as a training set. Serum samples from 48 patients with gastric adenocarcinoma and 47 control serum samples were grouped as an independent validation set. Patient demographics and clinical profiles are presented in Table 2.
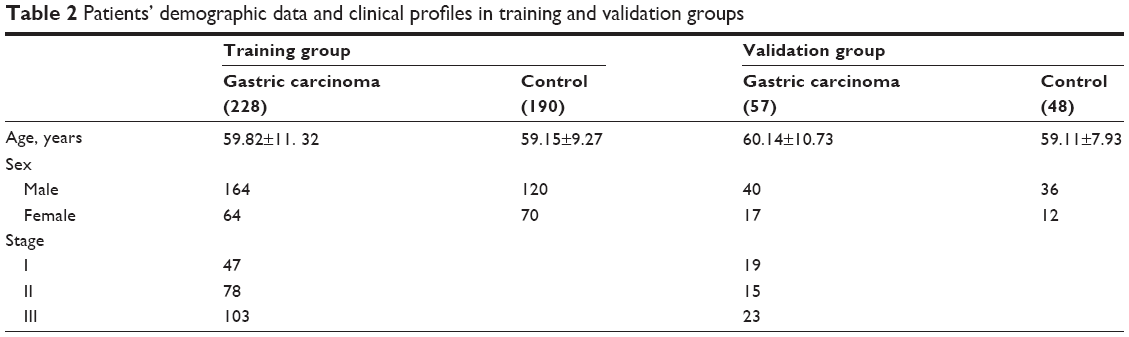 | Table 2 Patients’ demographic data and clinical profiles in training and validation groups |
Construction of 9-plex bead array panel
The xMAP bead-based technology (Luminex Corp., Austin, TX, USA) permits simultaneous analysis of multiple analytes in a single run. It is an antibody-based microarray, with high sensitivity and high throughput advantage, which has been used extensively in clinical diagnosis and research work. Among the nine target proteins (Table 3) chosen for this project, COX2, ADAM8, and beta-catenin were identified in our previous studies.10,11 There was difference in the expression of beta-catenin between the gastric cancer tissue and normal gastric mucosa tissue. COX2 and ADAM8 were higher in the gastric cancer tissues with lymph node metastases than in those without metastasis. Serum pepsinogen I (PGI) and serum pepsinogen II (PGII), as well as PGI/PGII ratio were used in the screening of gastric cancer in the countries with high and moderate incidence rates, such as the People’s Republic of China, Japan, and South Korea. Most studies have demonstrated that low concentrations of PGI and low PGI/PGII ratios in the serum or plasma are indicators of atrophic gastritis, which is linked to elevated risk of gastric cancer.12–15 H. pylori and gastric atrophy have both been identified as etiological factors for gastric cancer. H. pylori was declared as a class I carcinogen by the International Agency for Research on Cancer in 1994.16 Epidemiological surveys support a positive association between H. pylori infection and the development of gastric cancer.17–19 In this study, all patients and health controls had been tested for H. pylori IgG with ELISA kit (Biohit ELISA kit; Biohit, Helsinki, Finland). Intercellular cell adhesion molecule (ICAM), vascular endothelial growth factor (VEGF), epidermal growth factor receptor (EGFR), and hemoglobin were also associated with gastric cancer development and metastasis in previous studies.20–26
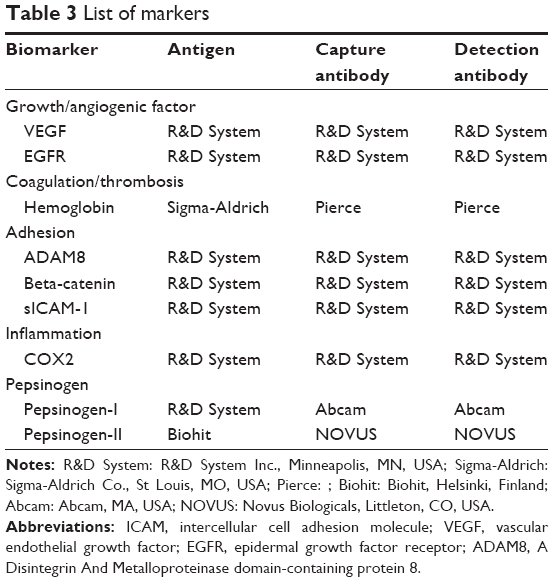 | Table 3 List of markers |
All antibodies have been validated in ELISA and were used according to the manufacturer’s instructions. The antigen protein has been validated for ELISA too. We developed all kits for Luminex according to The Luminex Cookbook.27 All nine protein kits were divided into a 5-plex panel and two 2-plex panels with different dilution rates for each patients’ samples. All samples were randomly divided into different plates to perform the Luminex test. The random number allocation and grouping was done using STATA 12 software.
Multiplex assay procedure
Multiplex assay was performed on a COSTAR™ 96-well round bottom plate (Corning Incorporated, Corning, NY, USA). Standard curve samples and prediluted patient samples (50 μL) were dispensed into the wells. Capture antibody-beads mixtures (50 μL) were added into each well and incubated at room temperature for 2 hours. Next, magnetic beads were suspended in 50 μL of 1% bovine serum albumin (BSA) in phosphate-buffered saline (PBS), then 50 μL of detection antibodies with biotin were added to each well and the mixtures incubated at room temperature for 2 hours. Finally, 100 μL of streptavidin-phycoerythrin (4 μg/mL) were added and the mixtures incubated at room temperature for 30 minutes. Each step was followed by a double washing step using 1% BSA in PBS (Sigma-Aldrich Co., St Louis, MO, USA) on the magnetic plate (Alpaqua Engineering, LLC, Beverly, MA, USA). All incubations were done using the Digene Hybrid Capture System at 800 rpm.
Subsequent to the final washing step, samples were resuspended in 100 μL of 1% BSA in PBS and read using Luminex-200™ (Luminex Corp.). The standard curve was constructed using a seven-parametric-curve fitting, and the results were calculated using Xponent 3.1 (Luminex Inc.). Markers were grouped together according to the dilution factor after the cross-reactivity was checked across all analytes. During the experiment, intra-assay precision ranged from 2% to 16%, and interassay precision ranged from 6% to 19%. The acceptance criteria for each individual run followed the Westgard rule.28
Statistical analysis
The raw data of biomarkers from Luminex combined with the H. pylori IgG concentrations were analyzed by comparison between the gastric cancer patients group and the control group using χ2, the z-statistic, and the Student’s t-test. Further, the univariate and multivariate logistic regression analysis and correlations between biomarkers were analyzed. The analysis of correlations between biomarkers was performed as well. For the identification of algorithms distinguishing controls from patients with gastric carcinoma, three classification analysis methods – random forest (RF), support vector machine (SVM), and logistic regression – were performed with the R program package. The R project of statistical computing (Wirtschaftsuniversität, Wien, Austria) was used for classification analysis to develop the algorithms.
The RF ensemble learning method, proposed by Breiman, is a combination of tree predictors where each tree depends on the values of a random vector sampled independently and with the same distribution for all trees in the forest.29 The idea behind SVMs is to construct a separating hyperplane or set of hyperplanes in a high or infinite dimensional space for classification.30 After obtaining results with the training set, each classification algorithm with different groups of classifiers was cross-validated with the validation set. The prediction performances with accuracy (number of patients or controls identical to the result of the classification/examined total number), sensitivity, and specificity were analyzed. The receiver operating characteristic curves were constructed and the areas under the curves were calculated. A P-value of 0.05 was considered statistically significant.
Results
The results of nine Luminex test biomarkers and the ELISA result of IgG to H. pylori are listed in Table 4 for the gastric cancer group and the control group. With the exception of EGFR (P=0.1951) and ICAM (P=0.2627), there were significant statistical differences in the biomarkers’ levels (P<0.05). The levels of eight markers were higher in the gastric cancer group compared to the control group.
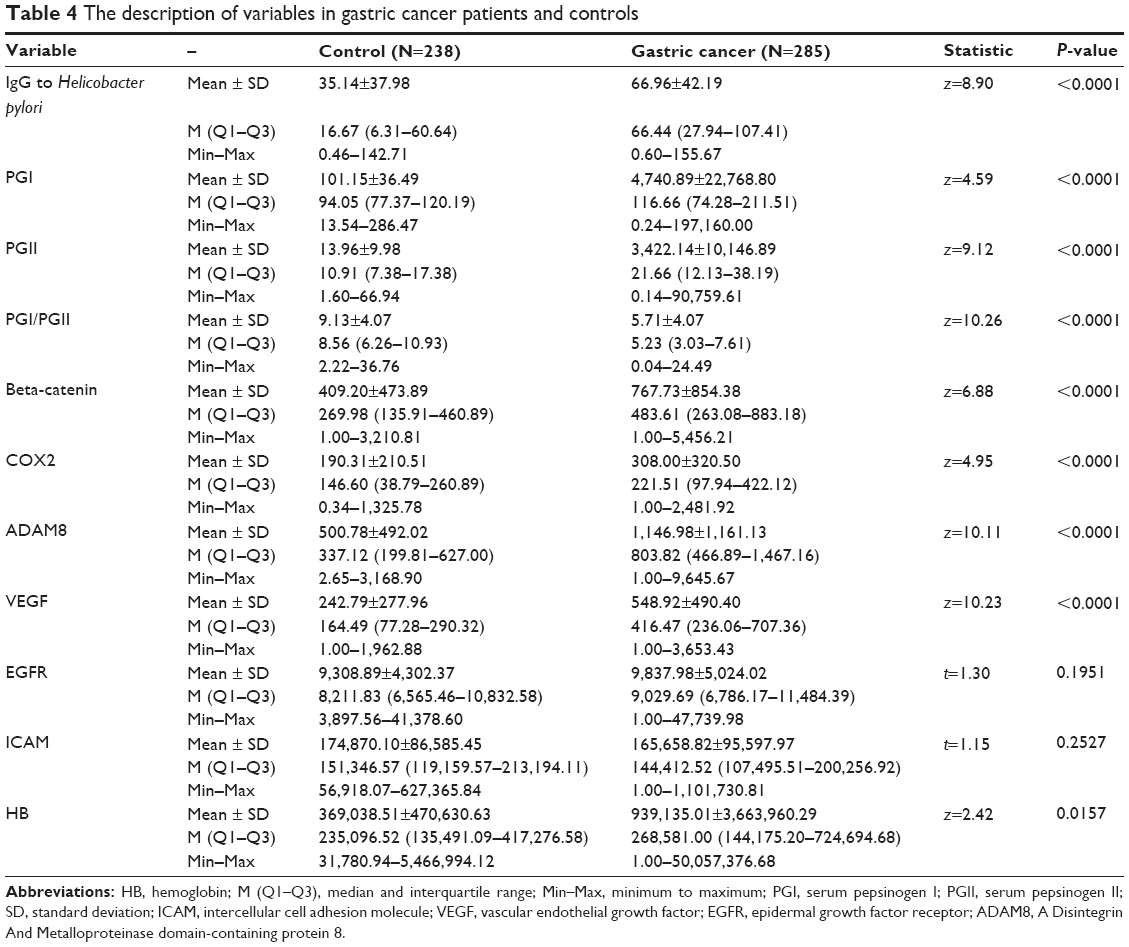 | Table 4 The description of variables in gastric cancer patients and controls |
The correlation analysis for ten biomarkers showed that there were significant correlations between beta-catenin, COX2, and VEGF (r>0.7 for all three pairs, Table 5).
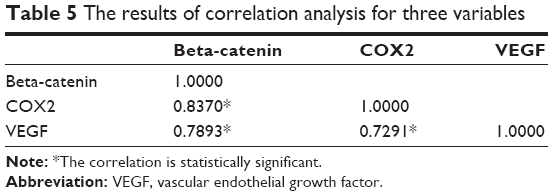 | Table 5 The results of correlation analysis for three variables |
Since ten proteins are too many to run a single algorithm, the feature selection process was performed using RF. This function shows the cross-validated prediction performance of models with sequentially reduced numbers of predictors (ranked by variable importance) via a nested cross-validation procedure (Figure 1). The figure shows that five proteins (IgG to H. pylori, ADAM8, PGI, PGII, VEGF) are the best for the prediction. Biomarker selection is shown in Table 6, and the important scores are plotted in Figure 2. The results for three classification analysis methods – RF, SVM, and logistic regression – are shown in Table 7. The receiver operating characteristics of RF, SVM, and logistic regression algorithm of the five biomarkers are shown in Figure 3. In the test group, the accuracy of the RF and SVM algorithms for this five-biomarker panel was 82.5% and 86.1%, respectively, which was higher than the accuracy of logistic regression (78.7%).
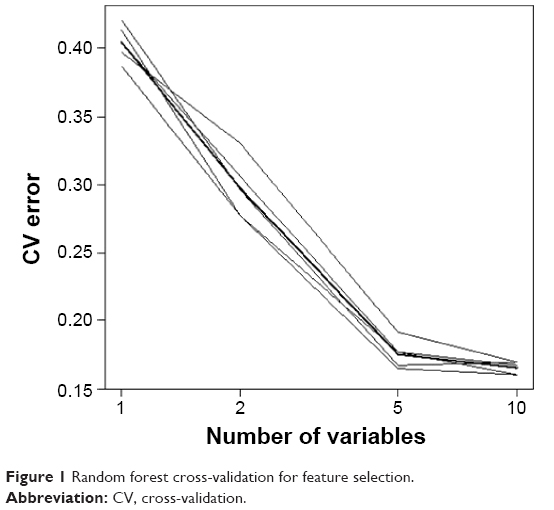 | Figure 1 Random forest cross-validation for feature selection. |
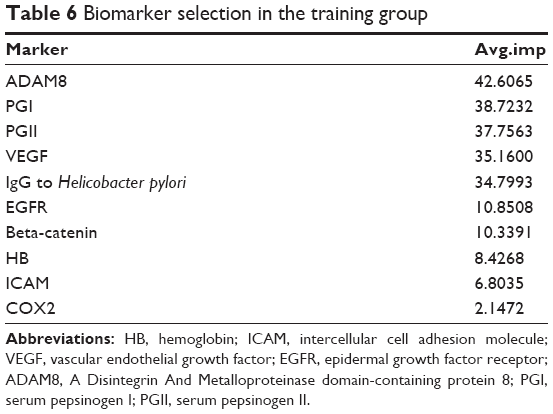 | Table 6 Biomarker selection in the training group |
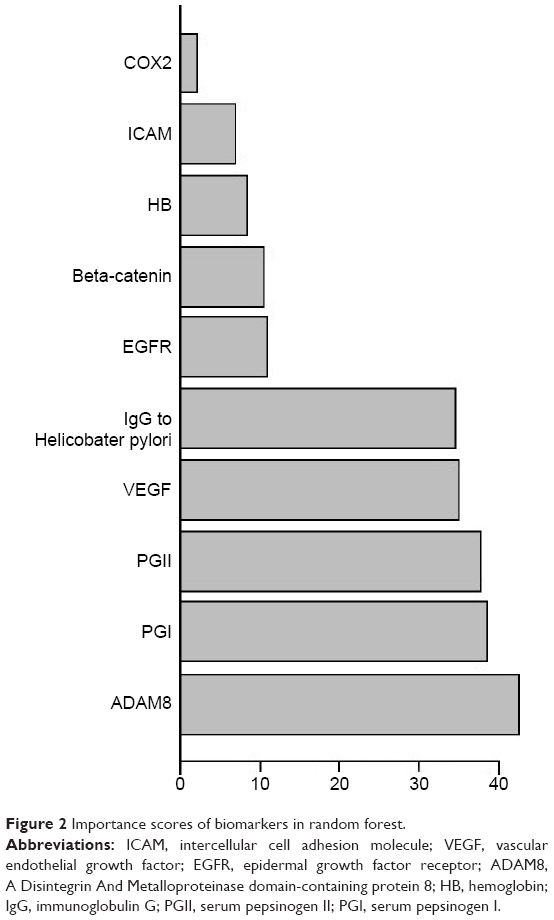 | Figure 2 Importance scores of biomarkers in random forest. |
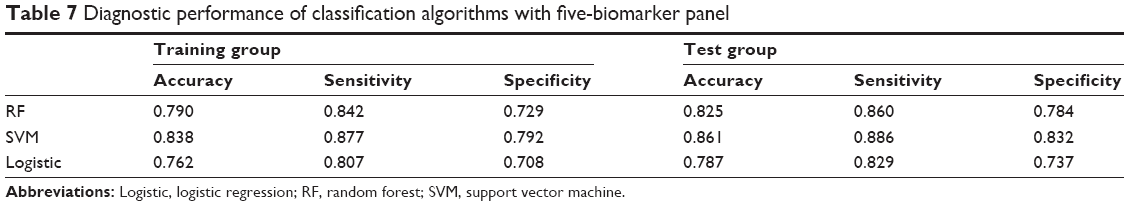 | Table 7 Diagnostic performance of classification algorithms with five-biomarker panel |
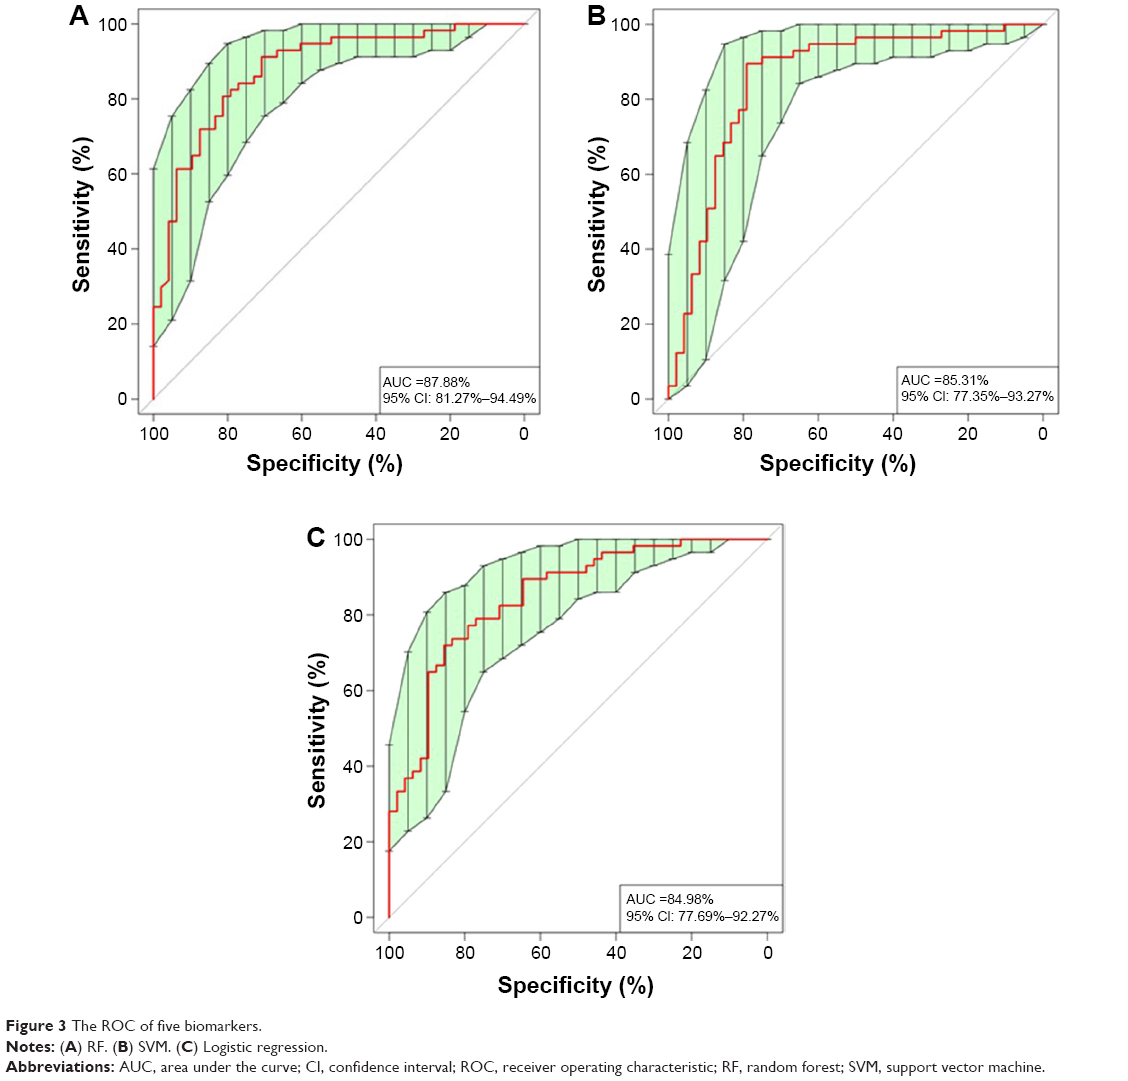 | Figure 3 The ROC of five biomarkers. |
The Cox model was used to model the relationship between the survival time, disease stage, and covariates, including the five proteins identified earlier. Conditional censoring distribution bootstrapping was used to construct the 95% confidence interval. The data show that proteins have no effect on survival time, while pathology N stage pN and pathology T stage pT had significant effect on survival (Table 8).
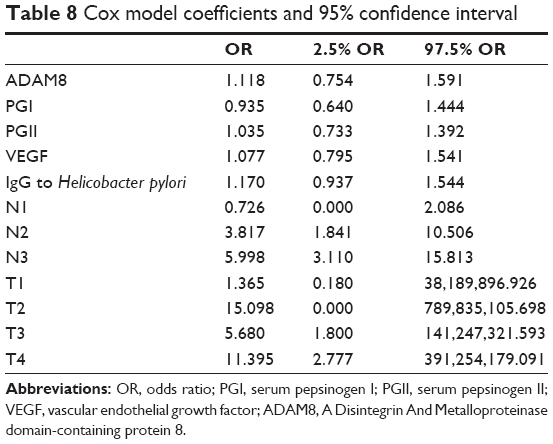 | Table 8 Cox model coefficients and 95% confidence interval |
Discussion
This study used Luminex and ELISA methods to identify ten serum biomarkers to distinguish between gastric cancer patients and healthy controls. Among the biomarkers included in the panel, eight biomarkers demonstrated statistically significant differences between the gastric cancer group and the healthy control group. Additionally, in this study we tested three proteins that we have earlier reported to have higher expression in the gastric cancer tissue compared to the normal gastric mucosa (beta-catenin), or higher expression in the gastric cancer tissue with metastases compared to the gastric cancer tissue without metastases (COX2, ADAM8).10,11 The levels of these three proteins were higher in the gastric cancer patients’ serum than in the healthy controls. The proteomics studies provide the basics for high-sensitivity tests like the Luminex. In this study, using the computing algorithm combined with high-throughput method, we identified five biomarkers for gastric cancer among the ten selected proteins.
A number of research studies have been aimed toward identifying the early diagnostic biomarkers for gastric cancers in blood serum, gastric juice, and even in the exhalants from the lungs.31–33 However, to date, there is no single known biomarker unique for diagnosis of gastric cancer. The traditional biomarkers such as carcinoembryonic antigen, CA 19-9, CA 12-5, and CA 7-24 are more sensitive in the diagnostics of other gastroenterological cancers rather than for gastric cancer.4–6 For this reason, they were excluded from this study. Instead, we tried to test other proteins that are known to be associated with tumorigenesis and development of gastric cancer. We used three algorithms to combine five biomarkers (IgG to H. pylori, ADAM8, PGI, PGII, and VEGF) in a panel cross-validated in a training group of 418 samples and a test group of 105 samples. SVM and RF resulted in higher accuracy and sensitivity compared to the logistic regression method. For SVM, the accuracy, sensitivity, and specificity in the test group were 86.1%, 88.6%, and 83.2%, respectively. Both PGI and PGII are being used in the gastric cancer screening in the countries with high incidence of this disease. H. pylori infection is known to be a major cause of peptic ulcer development and, eventually, gastric cancer development in Asian countries. The infection rate and the carrier rate are higher in Asian populations than elsewhere in the world. With the H. pylori infection, gastric mucosa cells can produce more COX2, and beta-catenin is known to be involved in this process. In turn, COX2 and beta-catenin direct the production of VEGF. We detected significant correlation between protein levels of beta-catenin, COX2, and VEGF in our analysis. Moreover, VEGF and ADAM8 were associated with tumor metastases. Thus, the five selected biomarkers have a significant role to play during gastric carcinogenesis.
In this study, SVM algorithm demonstrated the best performance. It had the highest accuracy, sensitivity, and specificity as compared to RF and logistic regression analysis. The five selected biomarkers were not associated with the prognosis of gastric cancer patients. In addition, the overall sensitivity was sustained regardless of TNM stage and tumor size. Although none of the individual markers showed sufficient diagnostic power independently, the biomarker panel identified in this study performed well. SVM algorithm demonstrated the best performance in this study. The concentrations of proteins that we identified in this study are much higher than the concentrations of other cytokines and low level biomarkers that are usually detected with mass spectroscopy in serum samples. Therefore, the panel of biomarkers may have clinical applications and can be particularly useful for the preliminary diagnostics in patients with reported symptoms.
Conclusion
Using three diagnostic algorithms – RF, SVM, and logistic regression – we created and validated a panel of biomarkers that might prove useful in the clinical diagnostics and/or screening of gastric cancer. The panel includes five biomarkers: IgG to H. pylori, ADAM8, PGI, PGII, and VEGF. Among the diagnostic algorithms, SVM out-performed the others regardless of TNM stage or tumor size. In future, the developed panel of biomarkers may supplement clinical gastroscopic evaluation of symptomatic patients and enhance diagnostic accuracy.
Disclosure
The authors report no conflicts of interest in this work.
References
GLOBOCAN 2012: Estimated Cancer Incidence, Mortality and Prevalence Worldwide in 2012 [webpage on the Internet]. Lyon: International Agency for Research on Cancer; 2013. Available from: http://globocan.iarc.fr. Accessed June 14, 2015. | ||
2012 Chinese Cancer Registry Report. The Military Publishing House, China; 2013. | ||
Cancer Stat Fact Sheets [webpage on the Internet]. Bethesda: National Cancer Institute. Available from: http://seer.cancer.gov/statfacts/. Accessed April 4, 2015. | ||
Shimada H, Noie T, Ohashi M, Oba K, Takahashi Y. Clinical significance of serum tumor markers for gastric cancer: a systematic review of literature by the Task Force of the Japanese Gastric Cancer Association. Gastric Cancer. 2014;17:26–33. | ||
Pectasides D, Mylonakis A, Kostopoulou M, et al. CEA, CA 19-9, and CA-50 in monitoring gastric carcinoma. Am J Clin Oncol. 1997;20:348–353. | ||
Fan B, Xiong B. Investigation of serum tumor markers in the diagnosis of gastric cancer. Hepatogastroenterology. 2011;58:239–245. | ||
Lin LL, Huang HC, Juan HF. Discovery of biomarkers for gastric cancer: a proteomics approach. J Proteomics. 2012;75:3081–3097. | ||
Wu HH, Lin WC, Tsai KW. Advances in molecular biomarkers for gastric cancer: miRNAs as emerging novel cancer markers. Expert Rev Mol Med. 2014;16:e1. | ||
Washington K. 7th edition of the AJCC cancer staging manual: stomach. Ann Surg Oncol. 2010;17:3077–3079. | ||
Li W, Ye F, Wang D, et al. Protein predictive signatures for lymph node metastasis of gastric cancer. Int J Cancer. 2013;132:1851–1859. | ||
Wang D, Ye F, Sun Y, et al. Protein signatures for classification and prognosis of gastric cancer a signaling pathway-based approach. Am J Pathol. 2011;179:1657–1666. | ||
Kudo T, Kakizaki S, Sohara N, et al. Analysis of ABC (D) stratification for screening patients with gastric cancer. World J Gastroenterol. 2011;17:4793–4798. | ||
Leung WK, Wu MS, Kakugawa Y, et al. Screening for gastric cancer in Asia: current evidence and practice. Lancet Oncol. 2008;9: 279–287. | ||
Cao XY, Jia ZF, Jin MS, et al. Serum pepsinogen II is a better diagnostic marker in gastric cancer. World J Gastroenterol. 2012;18:7357–7361. | ||
Barh D, Carpi A, Verma M, Gunduz M, editors. Cancer Biomarkers: Minimal and Noninvasive Early Diagnosis and Prognosis. CRC Press, Taylor & Francis Group; 2014. | ||
IARC. Schistosomes, liver flukes and Helicobacter pylori. IARC Working Group on the evaluation of carcinogenic risks to humans, Lyon, 7–14. IARC Monogr Eval Carcinog Risks Hum. 1994;61:1–241. | ||
Malfertheiner P, Sipponen P, Naumann M, et al. Helicobacter pylori eradication has the potential to prevent gastric cancer: a state-of-the-art critique. Am J Gastroenterol. 2005;100:2100–2115. | ||
Kim SS, Ruiz VE, Carroll JD, Moss SF. Helicobacter pylori in the pathogenesis of gastric cancer and gastric lymphoma. Cancer Lett. 2011;305:228–238. | ||
Lamb A, Chen LF. Role of the Helicobacter pylori-induced inflammatory response in the development of gastric cancer. J Cell Biochem. 2013;114:491–497. | ||
Jung WC, Jang YJ, Kim JH, et al. Expression of intercellular adhesion molecule-1 and e-selectin in gastric cancer and their clinical significance. J Gastric Cancer. 2012;12:140–148. | ||
Nakata B, Hori T, Sunami T, et al. Clinical significance of serum soluble intercellular adhesion molecule 1 in gastric cancer. Clin Cancer Res. 2000;6:1175–1179. | ||
Alexiou D, Karayiannakis AJ, Syrigos KN, et al. Clinical significance of serum levels of E-selectin, intercellular adhesion molecule-1, and vascular cell adhesion molecule-1 in gastric cancer patients. Am J Gastroenterol. 2003;98:478–485. | ||
Liu L, Ma XL, Xiao ZL, Li M, Cheng SH, Wei YQ. Prognostic value of vascular endothelial growth factor expression in resected gastric cancer. Asian Pac J Cancer Prev. 2012;13:3089–3097. | ||
Zhao R, Liu XG, Wu XP, et al. Vascular endothelial growth factor (VEGF) enhances gastric carcinoma invasiveness via integrin alpha(v)beta6. Cancer Lett. 2010;287:150–156. | ||
Jung DH, Lee HJ, Han DS, et al. Impact of perioperative hemoglobin levels on postoperative outcomes in gastric cancer surgery. Gastric Cancer. 2012;16:377–382. | ||
Terashima M, Kitada K, Ochiai A, et al. Impact of expression of human epidermal growth factor receptors EGFR and ERBB2 on survival in stage II/III gastric cancer. Clin Cancer Res. 2012;18:5992–6000. | ||
Luminex. The xMAP® Cookbook, 2nd Edition. Austin: Luminex. Available from: http://info2.luminexcorp.com/download-the-xmap-cookbook. Accessed April 4, 2015. | ||
Westgard JO, Barry PL, Hunt MR, Groth T. A multi-rule Shewhart chart for quality control in clinical chemistry. Clin Chem. 1981;27:493–501. | ||
Breiman L. Random Forests. Mach Learn. 2001;45:5–32. | ||
Furey TS, Cristianini N, Duffy N, Bednarski DW, Schummer M, Haussler D. Support vector machine classification and validation of cancer tissue samples using microarray expression data. Bioinformatics. 2000;16:906–914. | ||
Cui L, Zhang X, Ye G, et al. Gastric juice MicroRNAs as potential biomarkers for the screening of gastric cancer. Cancer. 2013;119:1618–1626. | ||
Liu HS, Xiao HS. MicroRNAs as potential biomarkers for gastric cancer. World J Gastroenterol. 2014;20:12007–12017. | ||
Xu ZQ, Broza YY, Ionsecu R, et al. A nanomaterial-based breath test for distinguishing gastric cancer from benign gastric conditions. Br J Cancer. 2013;108:941–950. |
 © 2016 The Author(s). This work is published and licensed by Dove Medical Press Limited. The full terms of this license are available at https://www.dovepress.com/terms.php and incorporate the Creative Commons Attribution - Non Commercial (unported, v3.0) License.
By accessing the work you hereby accept the Terms. Non-commercial uses of the work are permitted without any further permission from Dove Medical Press Limited, provided the work is properly attributed. For permission for commercial use of this work, please see paragraphs 4.2 and 5 of our Terms.
© 2016 The Author(s). This work is published and licensed by Dove Medical Press Limited. The full terms of this license are available at https://www.dovepress.com/terms.php and incorporate the Creative Commons Attribution - Non Commercial (unported, v3.0) License.
By accessing the work you hereby accept the Terms. Non-commercial uses of the work are permitted without any further permission from Dove Medical Press Limited, provided the work is properly attributed. For permission for commercial use of this work, please see paragraphs 4.2 and 5 of our Terms.