")
Back to Journals » Journal of Inflammation Research » Volume 16
Serum Amyloid a Predicts Prognosis and Chemotherapy Efficacy in Patients with Advanced Pancreatic Cancer
Authors Ding H, Yang Q, Mao Y, Qin D, Yao Z , Wang R, Qin T, Li S
Received 15 January 2023
Accepted for publication 10 March 2023
Published 24 March 2023 Volume 2023:16 Pages 1297—1310
DOI https://doi.org/10.2147/JIR.S404900
Checked for plagiarism Yes
Review by Single anonymous peer review
Peer reviewer comments 2
Editor who approved publication: Professor Ning Quan
Honglu Ding,1,* Qiuxia Yang,2,* Yize Mao,1,* Dailei Qin,1 Zehui Yao,1 Ruiqi Wang,1 Tao Qin,3 Shengping Li1
1Department of Pancreatobiliary Surgery, State Key Laboratory of Oncology in South China, Collaborative Innovation Center for Cancer Medicine, Sun Yat-sen University Cancer Center, Sun Yat-sen University, Guangzhou, People’s Republic of China; 2Department of Medical Imaging, State Key Laboratory of Oncology in South China, Collaborative Innovation Center for Cancer Medicine, Sun Yat-sen University Cancer Center, Sun Yat-sen University, Guangzhou, People’s Republic of China; 3Department of Medical Oncology, Sun Yat-sen Memorial Hospital, Sun Yat-sen University, Guangzhou, People’s Republic of China
*These authors contributed equally to this work
Correspondence: Shengping Li, Department of Pancreatobiliary Surgery, Sun Yat-sen University Cancer Center, 651 Dongfeng Road E, Guangzhou, Guangdong, 510060, People’s Republic of China, Tel +86- 020-87341843, Email [email protected]
Purpose: There is an urgent need to discover a predictive biomarker to help patients with advanced pancreatic cancer (APC) choose appropriate chemotherapy regimens. This study aimed to determine whether baseline serum amyloid A (SAA) levels were associated with overall survival (OS), progression-free survival (PFS), and treatment response in patients with APC received chemotherapy.
Patients and Methods: This retrospective study included 268 patients with APC who received first-line chemotherapy at the Sun Yat-Sen University Cancer Center between January 2017 and December 2021. We examined the effect of baseline SAA on OS, PFS and chemotherapy response. The X-Tile program was used to determine the critical value for optimizing the significance of segmentation between Kaplan-Meier survival curves. The Kaplan-Meier curves and Cox regression analyses were used to analyze OS and PFS.
Results: The best cut-off value of baseline SAA levels for OS stratification was 8.2 mg/L. Multivariate analyses showed that SAA was an independent predictor of OS (Hazard Ratio (HR) = 1.694, 95% Confidence Interval (CI) = 1.247– 2.301, p = 0.001) and PFS (HR = 1.555, 95% CI = 1.152– 2.098, p = 0.004). Low SAA was associated with longer OS (median, 15.7 months vs 10.0 months, p < 0.001) and PFS (median, 7.6 months vs 4.8 months, p < 0.001). The patients with a low SAA who received mFOLFIRINOX had longer OS (median, 28.5 months vs 15.1 months, p = 0.019) and PFS (median, 12.0 months vs 7.4 months, p = 0.035) than those who received nab-paclitaxel plus gemcitabine (AG) or SOXIRI, whereas there was no significant difference among the three chemotherapy regimens in patients with a high SAA.
Conclusion: Owing to the rapid and simple analysis of peripheral blood, baseline SAA might be a useful clinical biomarker, not only as a prognostic biomarker for patients with APC, but also as a guide for the selection of chemotherapy regimens.
Keywords: advanced pancreatic cancer, serum amyloid A, chemotherapy, prognosis, biomarker
Introduction
The mortality rate of pancreatic cancer is close to the incidence, ranking the sixth and seventh cause of cancer death in China and the worldwide, respectively.1 Approximately 80% of the patients have advanced pancreatic cancer (APC) at diagnosis and are not surgical candidates.2 Chemotherapy, such as FOLFIRINOX or gemcitabine therapy, is an important method for treating APC and prolonging the patient’s life.3 However, the median survival of patients with APC received chemotherapy remains between 6 and 11 months.4 Even though the FOLFIRINOX is the preferred choice for those patients with a good performance status, the high level of toxicity cannot be ignored.5 Thus, there is an urgent and critical need to discover a predictive biomarker to help patients with APC choose appropriate chemotherapy regimens.
Early prediction of the effect of chemotherapy in patients with APC can increase clinical benefit. To the best of our knowledge, there are few reports on predictive models for patients with APC undergoing systemic chemotherapy, although a large number of predictive models have been reported for pancreatic cancer patients undergoing surgery.6 Plasma carbohydrate antigen 19‑9 (CA19-9) is the most studied prognostic biomarker in patients with pancreatic cancer.7 However, CA19-9 may be elevated in other diseases that are not specific to pancreatic cancer, and approximately 5–7% of individuals have false-negatives.8 In addition, attempts have been made to make predictions by finding new genes,9 circulating DNA,10 and intratumoral microbes,11 among others, but these are yet to be approved for use in routine care.
Inflammation, especially chronic inflammation, plays a crucial role in the development and progression of cancer,12 and may also affect the efficacy of chemotherapy.13 Several inflammatory markers such as albumin (Alb),14 C-reactive protein (CRP),15 and serum amyloid A (SAA)16 are believed to predict the prognosis of solid tumors. Among these inflammatory biomarkers, SAA is a sensitive inflammatory biomarker synthesized and secreted by the liver, which is associated with persistent inflammatory responses.17 Studies have found that high expression of SAA1 in tumor tissues is associated with poor prognosis of pancreatic cancer.18 It has also been suggested that high SAA1expression levels in tumor tissues may be associated with resistance to common chemotherapy drugs including paclitaxel, platinum-based drugs, and 5-fluorodeoxyuridine.19 Given the important role of systemic inflammation in regulating the development and progression of pancreatic cancer, and the influence of SAA1 expression in tumor tissue on the efficacy of chemotherapy, it is important to investigate the prognostic value of circulating SAA in patients with APC received chemotherapy.
To the best of our knowledge, little is known about the relationship between SAA and clinical outcomes in patients with APC. Therefore, the purpose of this retrospective study was to explore whether baseline SAA levels were associated with overall survival (OS), progression-free survival (PFS) and treatment response in patients with APC received chemotherapy.
Materials and Methods
Patient Selection
We performed a retrospective analysis of 405 patients with APC who received first-line chemotherapy at the Sun Yat-sen University Cancer Center (SYSUCC) between January 1, 2017 and December 30, 2021. The exclusion criteria were as follows: (1) patients who had other primary tumors at the same time (n=2); (2) patients who had concurrent chemoradiotherapy (n=14); (3) patients without baseline or follow-up imaging data (n=110); (4) patients without baseline SAA values (n=3); and (5) patients without baseline CA19-9 values (n=8). Ultimately, 268 patients with APC were enrolled in the study. A flow chart of the patient selection process is shown in Figure 1.
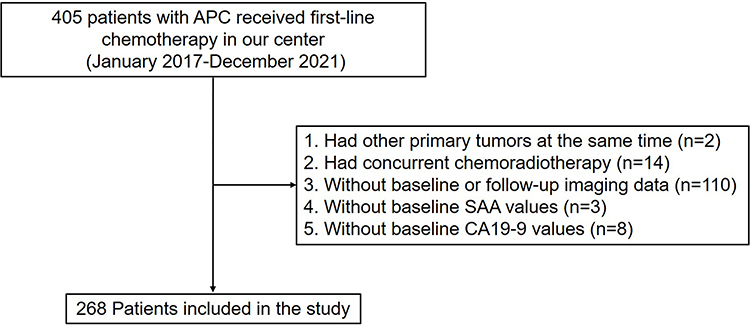 |
Figure 1 Flow chart of the patient selection process. |
Data Collection
Patient demographic data, including age, sex, body mass index (BMI), Eastern Cooperative Oncology Group (ECOG) performance status (PS), primary tumor location, primary tumor size, presence of distant metastasis, presence of metastases within multiple different organs, and the treatment process, were retrieved from electronic medical records. All biochemistry laboratory data including CA19-9, CRP, and SAA levels, were obtained from the clinical laboratory information system prior to the first chemotherapy treatment.
Evaluation of Treatment Response
The evaluation of treatment response to systemic chemotherapy was performed by an expert radiologist within 2–3 months after the start of chemotherapy, based on the new response evaluation criteria in solid tumors (RECIST 1.1).20
Endpoints and Follow‐up
OS (in months) was defined from the date of initiation of chemotherapy to the date of death or the date of last follow-up. PFS (in months) was defined from the date of initiation of chemotherapy to the date of first imaging assessment as disease progression or the date of death. Follow-up continued until September 30, 2022.
Statistical Analysis
Optimal cut-off values of SAA were determined using X-tile software, which is widely used to calculate the optimal cut-off value that shows the best predictive power for overall survival.21 For continuous variables, data were expressed as mean ± standard deviation (SD) and compared using the Student’s t-test. The chi-square test was used to compare differences between the two groups. Cox proportional hazards models were used for univariate and multivariate analyses. Clinical end points were calculated using the Kaplan-Meier method and compared using the Log rank test. All factors with p < 0.05 in univariate analysis were included in the multivariate analysis. Hazard ratios (HRs) and the corresponding 95% confidence intervals (CIs) were estimated using Cox regression analysis. All statistical assessments with p < 0.05 defined statistical significance.
Results
Patient and Tumor Characteristics
A total of 405 patients with APC were screened, and 268 patients were finally enrolled in this study. The patient characteristics are shown in Table 1. This study included 166 men (61.9%) and 102 women (38.1%). The median age of the patients was 59 years (range, 28–84 years). A total of 259 patients (96.6%) had an ECOG PS of 0 or 1. At baseline, the median (range) BMI, CA19-9, CRP, and SAA levels were 22.0 (14.2–37.3) kg/m2, 614 (1.0–20,000) U/mL, 5.2 (0.1–109.3) mg/L and 12.5 (0.0–1820.6) mg/L, respectively. Of these patients, 92 (34.3%) had tumors located in the head and neck of the pancreas and 176 (65.7%) in the body and tail. A total of 126 (47.0%) patients had a tumor size≥ 4 cm. At diagnosis, 77 (28.7%) patients were locally advanced and 191 (71.3%) patients had distant metastases. Regarding the use of chemotherapy regimens, 106 (3.2%) patients received nab-paclitaxel plus gemcitabine (AG), 66 (24.6%) patients received mFOLFIRINOX, 64 (23.9%) patients received SOXIRI, and 32 (11.9%) patients received other chemotherapy regimens including gemcitabine plus S1, AG plus cisplatin, and others.
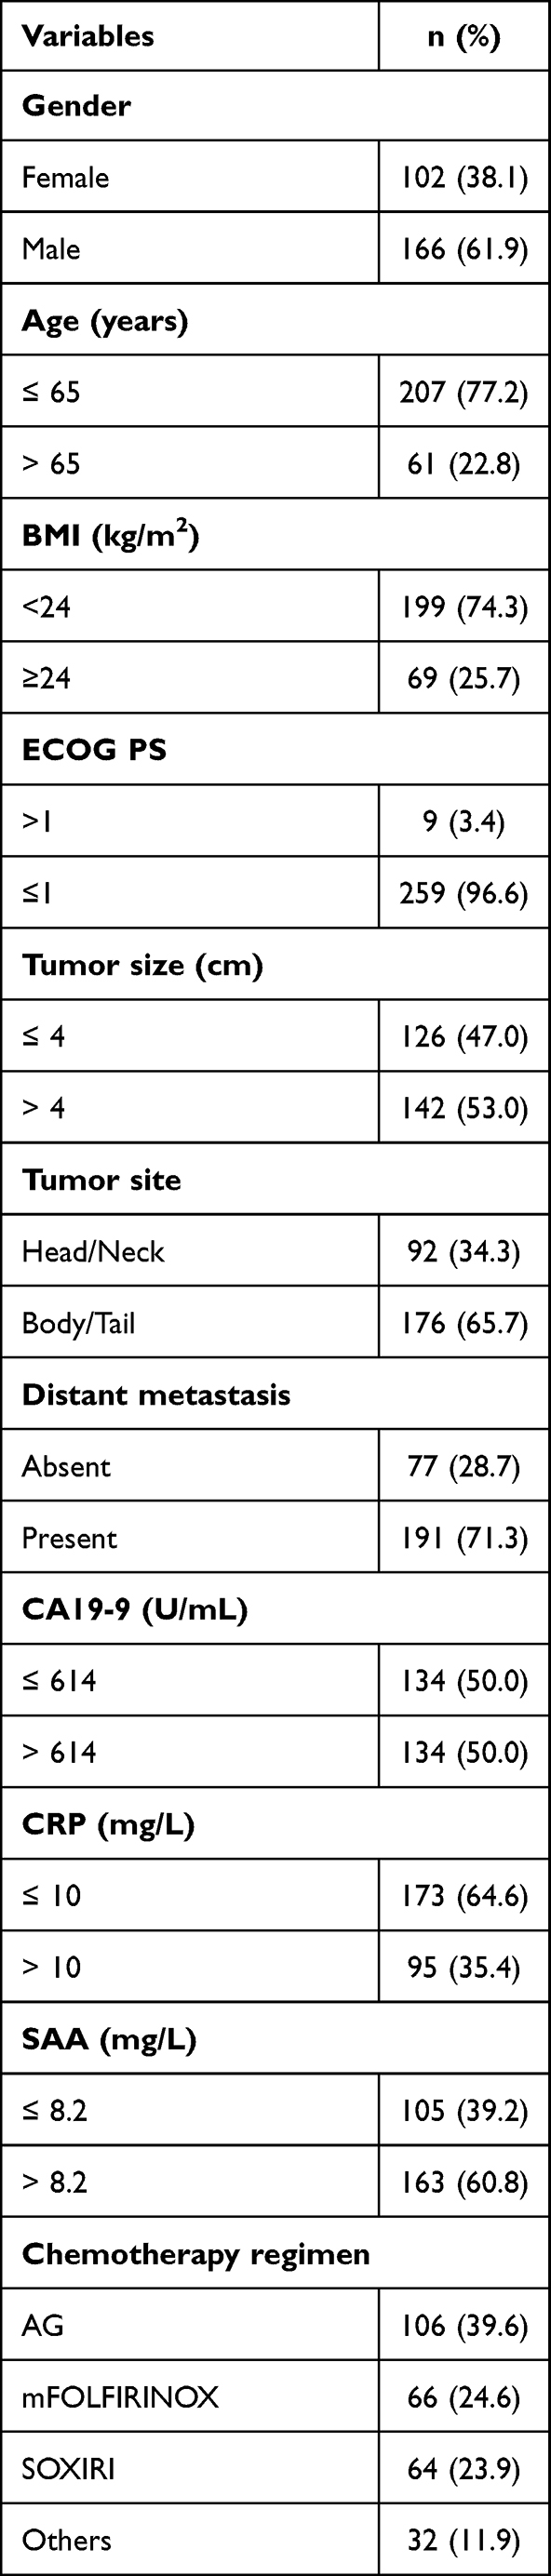 |
Table 1 Patient and Tumor Characteristics (n=268) |
The Cut-off Values Determined by X-Tile
In the present study, we used the X-tile program to derive the optimal cut-off values of SAA, which showed that the most significant predictive power for OS was 8.2 mg/L. Base on this cut-off value, the patients were divided into two subgroups: low SAA (≤ 8.2 mg/L) and high SAA (> 8.2 mg/L).
Association of Baseline SAA Levels with Overall Survival
First, we analyzed the impact of baseline SAA on OS across different subgroups, as shown in Figure 2. The impact of baseline SAA on OS was consistent (hazard ratio < 1.0) across subgroups including sex, BMI, tumor size and site, distant metastasis, and CA19-9 levels. The Kaplan–Meier analysis indicated that low SAA was associated with longer OS (p<0.001, Figure 3A); the median OS for patients with a low SAA and a high SAA was 15.7 months (95% CI, 11.2–20.3 months) and 10.0 months (95% CI, 9.2–10.8 months), respectively. In addition, based on the results of our univariate and multivariate analyses, baseline SAA was shown to be an independent prognostic factor for OS (HR = 1.694, 95% CI = 1.247–2.301, p = 0.001, Table 2). These analyses also showed that distant metastasis (p<0.001), CA19-9 levels (p=0.002), and CRP levels (p<0.001) were significantly associated with OS. Further multivariate analysis showed that distant metastasis could also independently predict OS (HR = 1.741, 95% CI = 1.222–2.480, p = 0.002, Table 2).
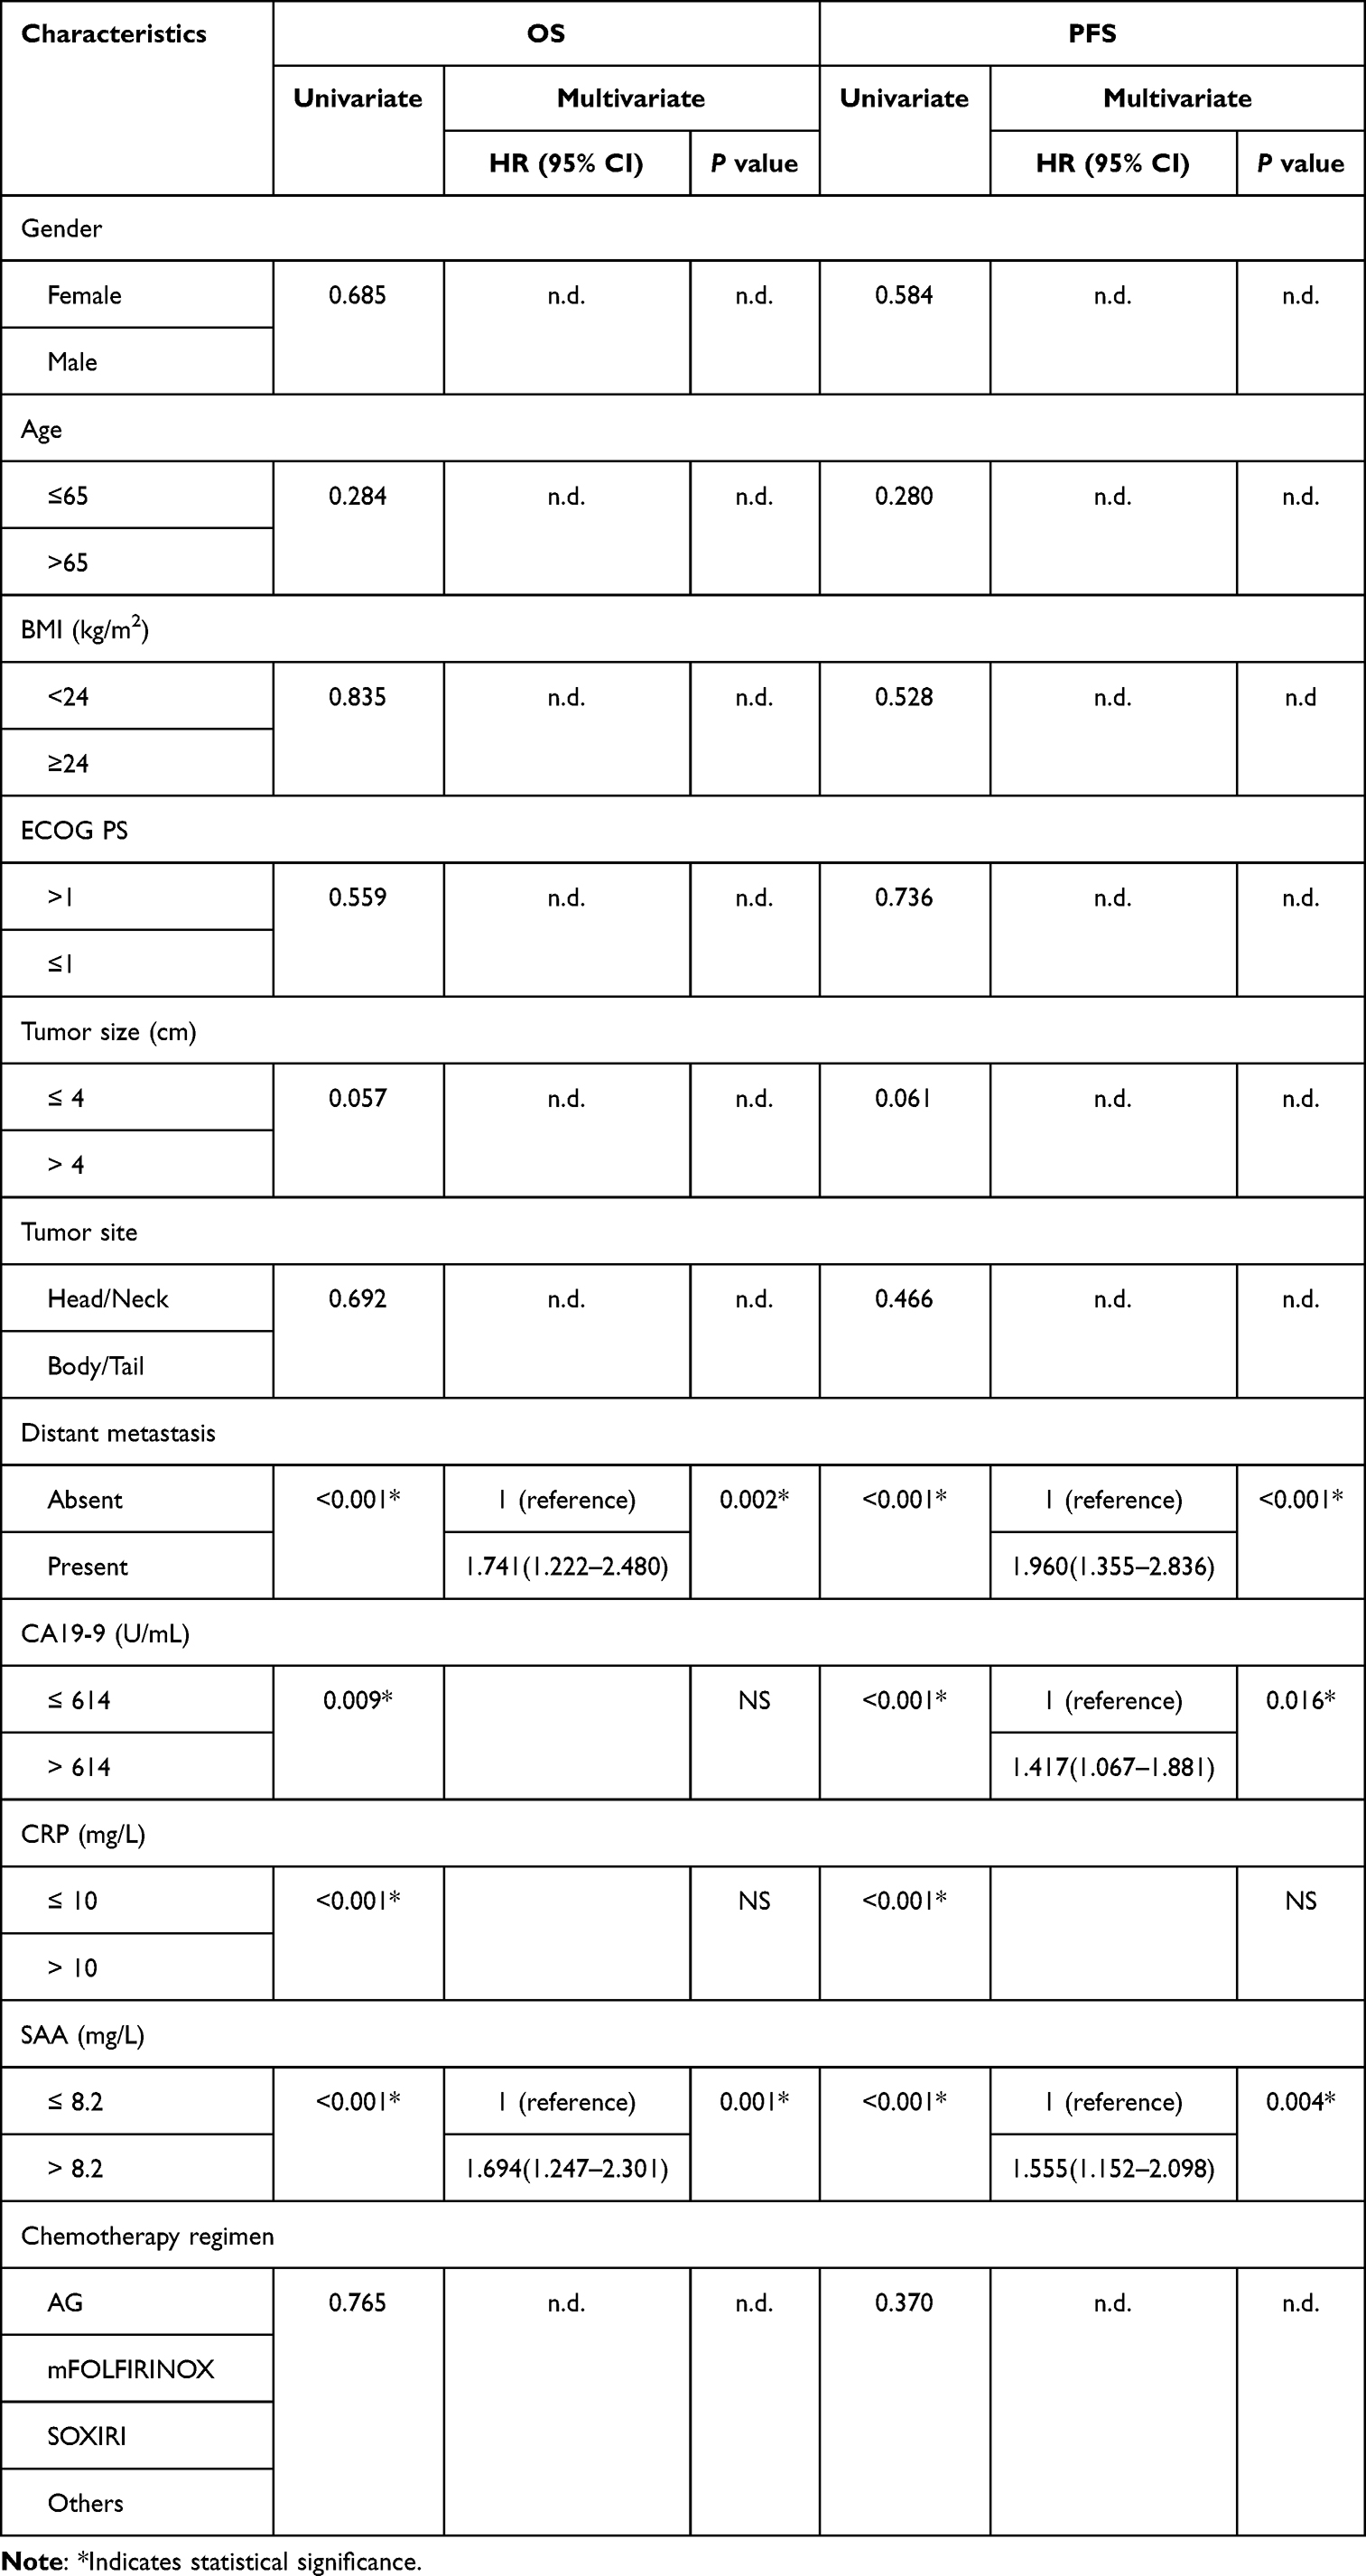 |
Table 2 Univariate and Multivariate Analyses of Prognostic Factors for Overall Survival and Progression-Free Survival |
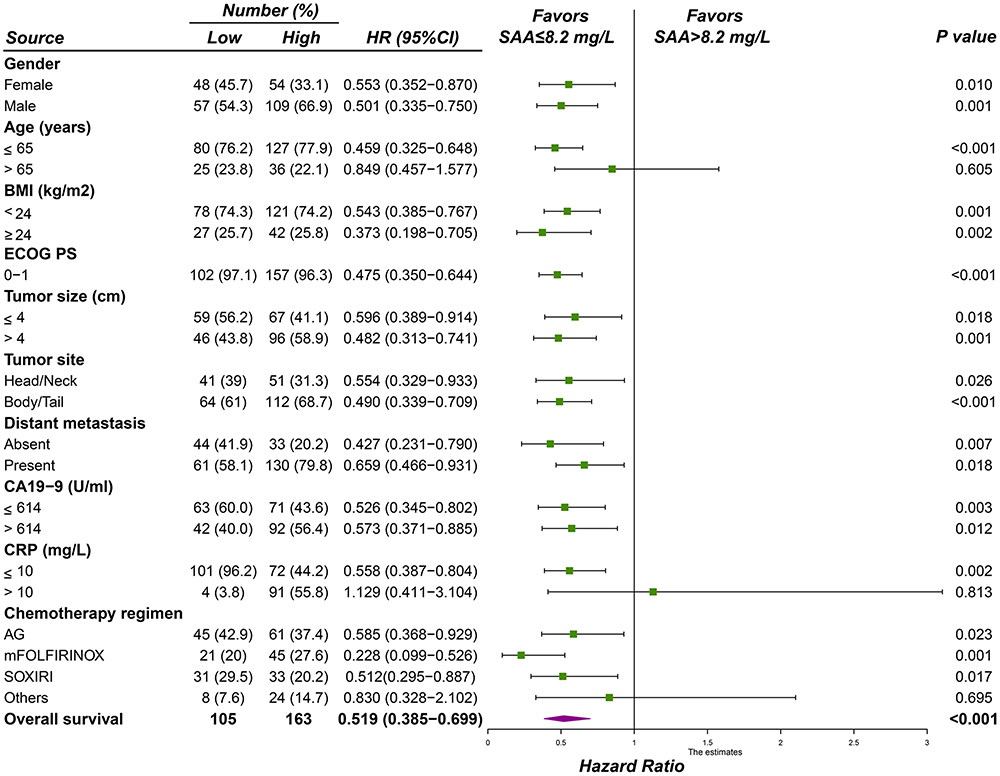 |
Figure 2 Overall survival across different subgroups. Findings were examined by Cox proportional hazards regression analysis. Hazard ratio < 1.0. |
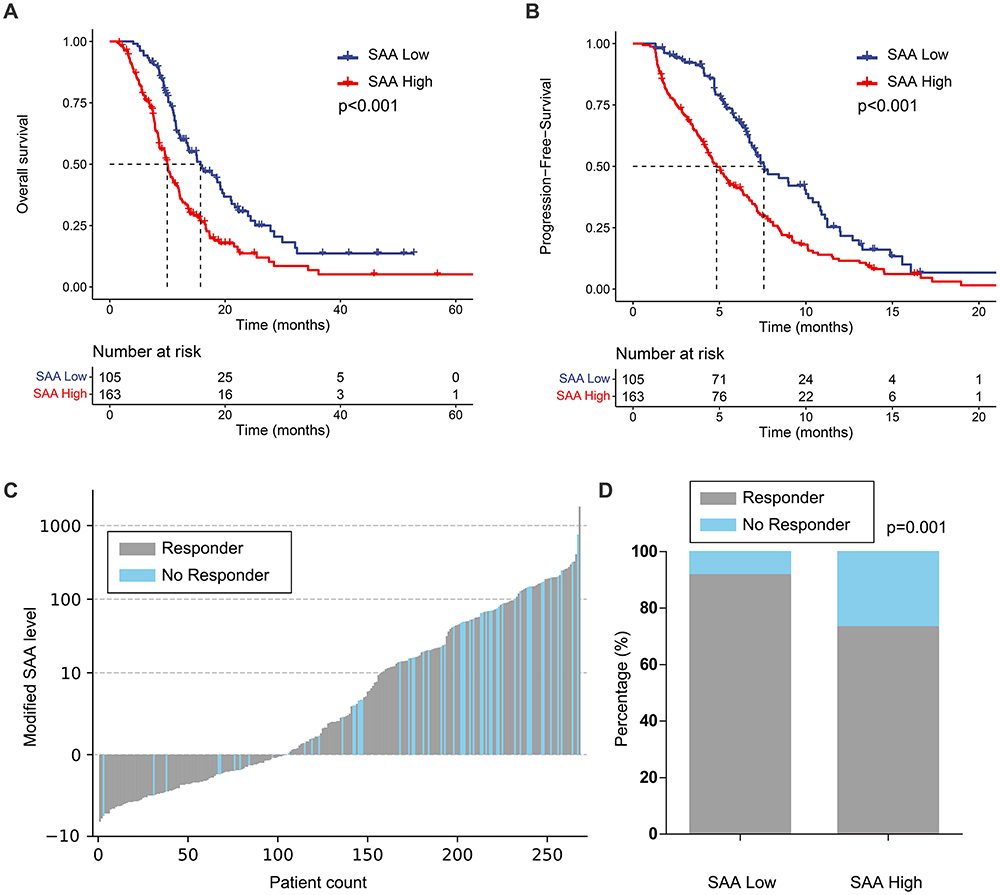 |
Figure 3 Survival analysis and chemotherapeutic response. (A) Patients with a low SAA had a significantly longer median OS than those with a high SAA (15.7 months vs 10.0 months, p < 0.001). (B) Patients with a low SAA had a significantly longer median PFS than those with a high SAA (7.6 months vs 4.8 months, p < 0.001). (C) Chemotherapeutic response waterfall plot analysis. Low SAA group (n = 105, Responder = 96, No Responder = 9), High SAA group (n = 163, Responder = 119, No Responder = 44). (D) The proportion of patients with a low SAA level responding to chemotherapy was significantly higher than that of patients with a high SAA level (91.4% vs 73.0%, p = 0.001). |
Association of Baseline SAA Levels with Progression-Free Survival
The relationship between baseline SAA and PFS was also analyzed and showed similar results to OS. The Kaplan–Meier analysis indicated that low SAA was associated with longer PFS (p<0.001, Figure 3B), the median PFS for patients with a low SAA and a high SAA was 7.6 months (95% CI, 5.8–9.3 months) and 4.8 months (95% CI, 4.0–5.6 months), respectively. As shown in Table 2, distant metastasis (p<0.001), CA19-9 (p<0.001), CRP (p<0.001) and SAA (p<0.001) levels were significantly associated with PFS in the univariate analysis. Further multivariate analysis showed that distant metastasis (HR = 1.960, 95% CI = 1.355–2.836, p <0.001), CA19-9 levels (HR = 1.417, 95% CI = 1.067–1.881, p = 0.016) and SAA levels (HR = 1.555, 95% CI = 1.152–2.098, p = 0.004) were independent predictors of PFS.
Association Between Baseline SAA Levels and Chemotherapy Response
According to the chemotherapeutic response waterfall plot analysis, the proportion of patients with a low SAA that responded to chemotherapy was significantly higher than that of patients with a high SAA (p=0.001, Figure 3C and D). We therefore focused on the response to the three most regularly used chemotherapy regimens in our center, including AG, mFOLFIRINOX, and SOXIRI. As shown in Figure 4, the Kaplan-Meier survival analysis showed that in all three regimens, OS and PFS in the low SAA group were longer than those in the high SAA group. To further clarify the relationship between baseline SAA levels and response to the three chemotherapy regimens, we conducted a unified comparative analysis. We found that patients received the three chemotherapy regimens had similar OS and PFS (Figure 5A and B). There was no significant difference in OS among the three chemotherapy regimens in the high SAA group (p=0.917, Figure 5C), while the low SAA group that received mFOLFIRINOX had longer OS (p=0.019) and PFS (p=0.035) than the other two (Figure 5D–F). In patients received mFOLFIRINOX, the proportions of PR, SD, and PFS >6 months in the low SAA group were significantly higher than those in the high SAA group (Figure 5G and H). Representative CT images are shown in Figure 6.
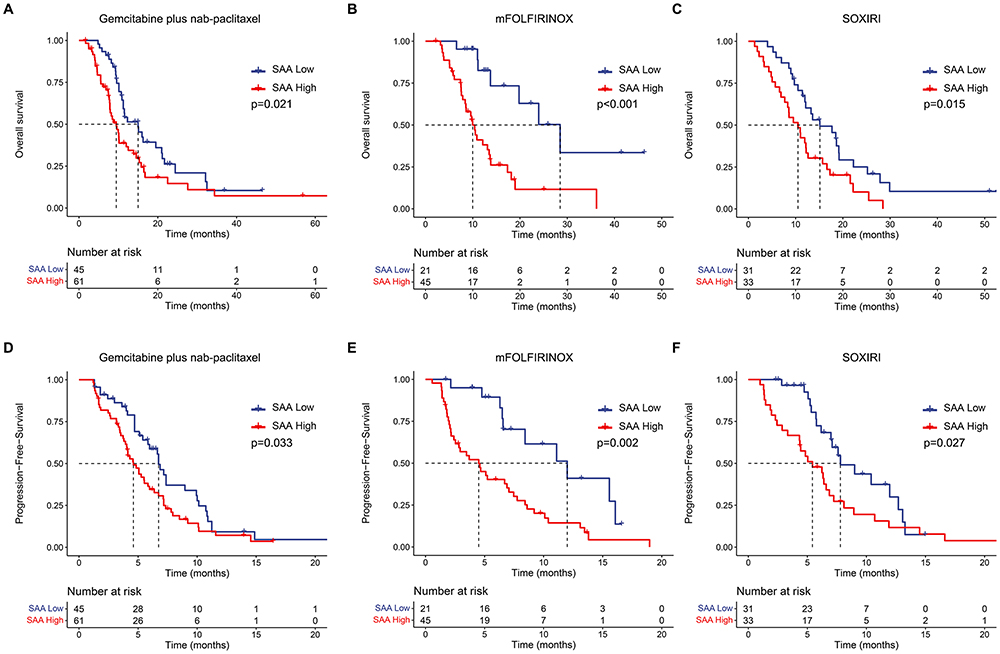 |
Figure 4 Kaplan-Meier curves for OS and PFS of 3 chemotherapy regimens. (A) Patients received AG with a low SAA had a significantly longer median OS than those with a high SAA (15.0 months vs 9.5 months, p = 0.021). (B) Patients received mFOLFIRINOX with a low SAA had a significantly longer median OS than those with a high SAA (28.5 months vs 10.0 months, p < 0.001). (C) Patients received SOXIRI with a low SAA had a significantly longer median OS than those with a high SAA (15.1 months vs 10.5 months, p = 0.015). (D) Patients received AG with a low SAA had a significantly longer median PFS than those with a high SAA (6.7 months vs 4.6 months, p = 0.033). (E) Patients received mFOLFIRINOX with a low SAA had a significantly longer median PFS than those with a high SAA (12.0 months vs 4.5 months, p = 0.002). (F) Patients received SOXIRI with a low SAA had a significantly longer median PFS than those with a high SAA (7.8 months vs 5.4 months, p = 0.027). |
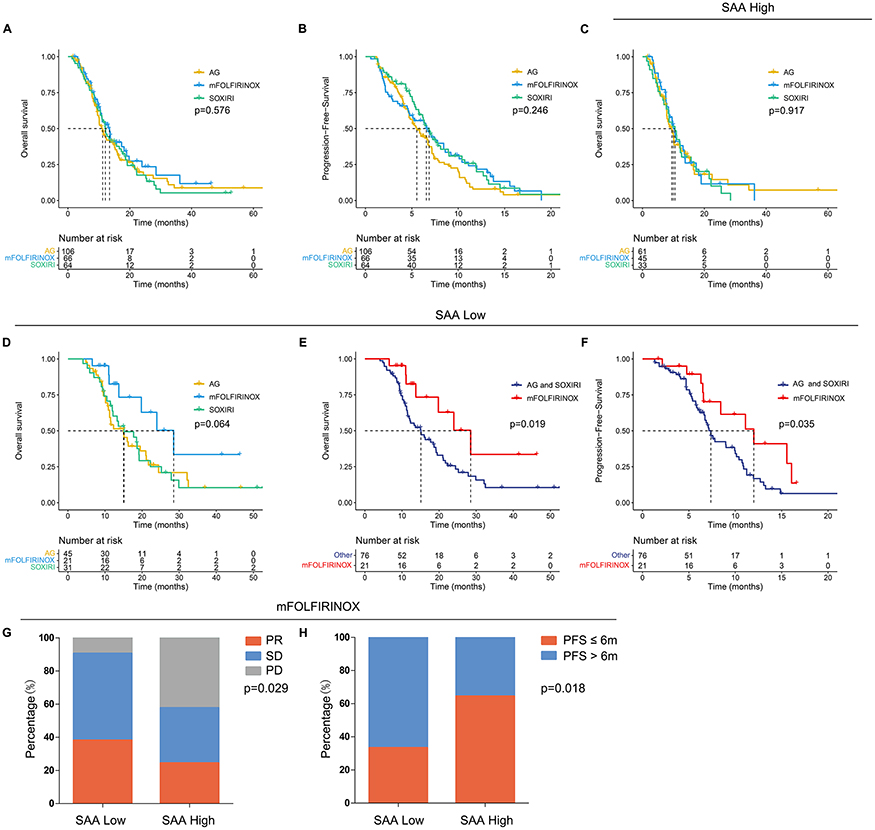 |
Figure 5 Association between baseline SAA and chemotherapy response. (A) No significant difference in OS among the three chemotherapy regimens (11.2 months vs 13.5 months vs 12.1 months, p = 0.576). (B) No significant difference in PFS among the three chemotherapy regimens (5.5 months vs 6.6 months vs 6.9 months, p = 0.246). (C) No significant difference in OS among the three chemotherapy regimens in patients with a high SAA (9.5 months vs 10.0 months vs 10.5 months, p = 0.917). (D) Patients received mFOLFIRINOX with a low SAA had a longer median OS than the other two, but there was no statistical significance (28.5 months vs 15.0 months vs 15.1 months, p = 0.064). (E) Comparison between two groups, patients received mFOLFIRINOX with a low SAA had a significantly longer median OS than those received AG or SOXIRI (28.5 months vs 15.1 months, p = 0.019). (F) Comparison between two groups, patients received mFOLFIRINOX with a low SAA had a significantly longer median PFS than those received AG or SOXIRI (12.0 months vs 7.4 months, p = 0.035). (G). In patients received mFOLFIRINOX, PD (9.5%), SD (52.4%) and PR (38.1%) in the low SAA group, and PD (42.2%), SD (33.3%) and PR (24.4%) in the high SAA group, (p=0.029). (H). In patients received mFOLFIRINOX, 66.7% patients with a low SAA had a PFS>6 months, 35.6% patients with a high SAA had a PFS>6 months, (p=0.018). |
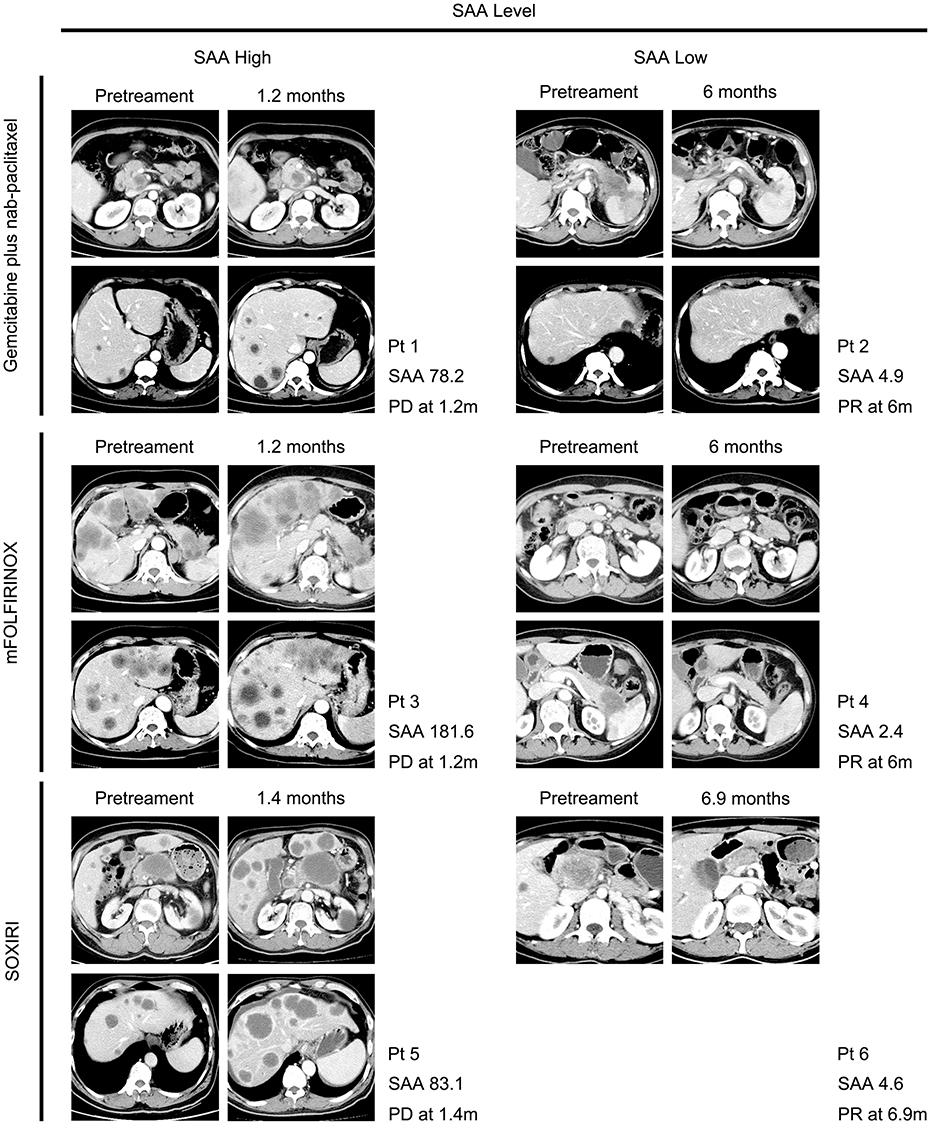 |
Figure 6 Representative CT images. (Patient 1 #) A patient with SAA of 78.2 mg/L received AG. CT examination before chemotherapy showed that the patient had primary tumor located in the head of the pancreas and multiple metastases in the liver. After 1.2 months of chemotherapy, the size of the pancreatic lesion enlarged, and intrahepatic metastases increased and enlarged. The efficacy was evaluated as PD. (Patient 2 #) A patient with SAA of 4.9 mg/L received AG. CT examination before chemotherapy showed that the patient had primary tumor located in the tail of the pancreas and multiple metastases in the liver. After 6 months of chemotherapy, the size of the pancreatic lesion and intrahepatic metastases were smaller. The efficacy was evaluated as PR. (Patient 3 #) A patient with SAA of 181.6 mg/L received mFOLFIRINOX. CT examination before chemotherapy showed that the patient had primary tumor located in the tail of the pancreas and multiple metastases in the liver. After 1.2 months of chemotherapy, the pancreatic lesions were stable in size, but intrahepatic metastases increased and enlarged. The efficacy was evaluated as PD. (Patient 4 #) A patient with SAA of 2.4 mg/L received mFOLFIRINOX. CT examination before chemotherapy showed that the patient had primary tumor located in the tail of the pancreas and peritoneal metastases. After 6 months of chemotherapy, the size of the pancreatic lesion was smaller and peritoneal metastases were smaller and partially disappeared. The efficacy was evaluated as PR. (Patient 5 #) A patient with SAA of 83.1 mg/L received SOXIRI. CT examination before chemotherapy showed that the patient had primary tumor located in the neck and body of the pancreas and multiple metastases in the liver. After 1.4 months of chemotherapy, the size of the pancreatic lesion enlarged, and intrahepatic metastases increased and enlarged. The efficacy was evaluated as PD. (Patient 6 #) A patient with SAA of 4.6 mg/L received SOXIRI. CT examination before chemotherapy showed that the patient had primary tumor located in the head of the pancreas and intrahepatic metastases. After 6.9 months of chemotherapy, intrahepatic metastases disappeared, the pancreatic lesion was treated with irreversible electroporation. |
Discussion
In this study, we found that baseline SAA levels could be an independent prognostic factor for OS and PFS in patients with APC received chemotherapy. To the best of our knowledge, this is the first study to use baseline SAA levels as a biomarker to predict the survival outcome of patients with APC. In addition, the current study expands the clinical application for patients with APC in survival prediction without considering their chemotherapy regimens.
Carcinogenesis is a result of multistage process, and there is increasing evidence that inflammation is a key component of tumor progression.22 Moreover, various studies have shown that inflammation can affect the efficacy of chemotherapy and can even lead to chemoresistance.23 Recently, an increasing number of studies have reported that SAA, an important biomarker of inflammation, is involved in carcinogenic and neoplastic diseases. SAA is a major acute-phase protein mainly produced by liver cells, and can also be synthesized in extrahepatic tissues, such as cancer cells and cancer metastases.24 Some studies have reported that high expression of SAA1 in tumor tissues can promote fibrosis, which plays an important role in chemotherapy resistance and poor prognosis of pancreatic cancer.25 However, the role of circulating SAA in prognosis and chemotherapy response in patients with APC remains unknown.
In this study, we showed that the baseline SAA levels with cut-off value of 8.2 mg/L was an independent prognostic factor for OS and PFS in patients with APC received chemotherapy. Therefore, baselines SAA can not only be used as an important biomarker to predict the prognosis of patients with gastric cancer,26 lung cancer,27 and kidney cancer28 but also has a good prognostic value in patients with APC received chemotherapy. In addition, further analysis of our study showed that baselines SAA could well predict OS and PFS regardless of chemotherapy regimens, which has shown promise for a wide range of applications in clinical practice. Therefore, clinicians should encourage patients with APC with a low SAA to receive chemotherapy to achieve the longest overall survival, while those with a high SAA may benefit from a more aggressive treatment approach.
AG and FOLFIRINOX, as first-line chemotherapy regimens, have been shown to relieve cancer-related symptoms and prolong life in patients with APC. However, there has been no clinical Phase III randomised trial comparing AG and FOLFIRINOX. A comprehensive systematic review and meta-analysis of nearly 7000 patients with APC treated with FOLFIRINOX or AG as first-line therapy was conducted. Compared with AG, the benefits of FOLFIRINOX for OS and PFS were slight but not statistically significant.29 In our survival analysis, we found that the efficacy of AG and mFOLFIRINOX was similar. The median OS of AG and mFOLFIRINOX was 12.3 months and 13.5 months respectively, consistent with other large retrospective studies such as Kim et al (12.1 months vs 13.8 months).30 Different chemotherapy regimens have different side effects, and in clinical practice, clinicians tend to use FOLFIRINOX in young and fitter patients.31 So, it is crucial to identifying those who would benefit most from a particular treatment. However, no available clinical prediction model has been developed to facilitate the selection of FOLFIRINOX or AG in patients with APC.32 Surprisingly, we found that patients with APC with a low SAA received mFOLFIRINOX had longer OS and PFS than those received AG or SOXIRI, while there was no significant difference in patients with a high SAA. This suggests that patients with APC with a low SAA may be preferentially treated with mFOLFIRINOX. Previous studies have found that the high expression of human Equilibrative Nucleoside Transporter 1 (hENT1) is related to longer OS in patients with APC received AG,33 while Hepatocyte Nuclear Factor-1A (HNF1A) positive patients might benefit from FOLFIRINOX.34 In contrast to these studies, SAA can be obtained from serum as a routine clinical biochemical test, which is more convenient, safer and economical. However, those results remain prospective clinical trial to confirm.
CA19-9 is a reliable serum biomarker for predicting pancreatic cancer prognosis. In our study, because CA19-9 was above the upper limit of the normal range in more than 80% of the patients, we chose a median of 614U/mL as the cut-off value for our study. Our results found that the CA19-9 levels showed independent prognostic significance in multivariate analyses for PFS but not OS. Aside from SAA, CRP has also been reported to be associated with prognosis in pancreatic cancer.35 In our study, a CRP level of 10 mg/L was considered the cut-off value.36 CRP levels was significantly associated with OS and PFS in the univariate analysis, but not in the multivariate analysis. So, SAA levels showed more prognostic power than CA19-9 and CRP levels. Considering the complex interactions among components of the tumor microenvironment, we should further investigate how to combine these serum biomarkers to improve their predictive power for the prognosis of patients with APC.
This study had several limitations. First, as this was a retrospective study conducted at a single institution, there could be selection and verification biases. Second, we screened patients from our single institution which had a small sample size, and may have limited statistical power. Further prospective or external validation studies with larger sample sizes are required. Third, whether the circulating SAA levels is correlated with the expression of SAA in tumor tissues and the underlying mechanism between SAA and cancer biology should be further investigated.
Conclusion
Our findings suggest that baseline SAA is associated with OS and PFS and could be an independent prognostic biomarker for patients with APC received chemotherapy. Owing to the rapid and simple analysis of peripheral blood, baseline SAA might be a useful clinical biomarker, not only as a prognostic biomarker for patients with APC, but also as a guide for the selection of chemotherapy regimens.
Abbreviations
APC, advanced pancreatic cancer; OS, overall survival; PFS, progression-free survival; HR, Hazard Ratio; CI, Confidence Interval; SD, standard deviation; SYSUCC, the Sun Yat-sen University Cancer Center; BMI, body mass index; ECOG PS, Eastern Cooperative Oncology Group performance status; CA19-9, carbohydrate antigen 19‑9; CRP, C-reactive protein; SAA, serum amyloid A; Alb, albumin; AG, nab-paclitaxel plus gemcitabine; hENT1, human Equilibrative Nucleoside Transporter 1; HNF1A, Hepatocyte Nuclear Factor-1 A.
Data Sharing Statement
This paper has uploaded key raw data onto the Research Data Deposit public platform (www.researchdata.org.cn) for authenticity verification. The approval RDD number is RDDA2022867239.
Ethics Approval and Informed Consent
This retrospective study was approved by the Institutional Review Board of SYSUCC (B2019-229-Y01). The Informed consent was waived due to this study’s retrospective nature and the anonymized processing of patient data. We strictly abided the principles of the Declaration of Helsinki.
Acknowledgments
The authors thank our patients at SYSUCC for providing clinical data for this study. In addition, we would like to thank Editage (www.editage.cn) for English language editing.
Author Contributions
All authors made a significant contribution to the work reported, whether that is in the conception, study design, execution, acquisition of data, analysis and interpretation, or in all these areas; took part in drafting, revising or critically reviewing the article; gave final approval of the version to be published; have agreed on the journal to which the article has been submitted; and agree to be accountable for all aspects of the work.
Funding
This study was supported by grants from the National Natural Science Funds (No.81972299) and the National Key Research and Development Plan (No. 2020YFC2002705).
Disclosure
The authors declare that they have no conflicts of interest for this work.
References
1. Prashanth R, Tagore S, Vinaya G. Epidemiology of pancreatic cancer: global trends, etiology and risk factors. World J Oncol. 2019;10:10–27. doi:10.14740/wjon1166
2. Ryan DP, Hong TS, Bardeesy N. Pancreatic adenocarcinoma. N Engl J Med. 2014;371:2140–2141. doi:10.1056/NEJMra1404198
3. Conroy T, Hammel P, Hebbar M, et al. FOLFIRINOX or gemcitabine as adjuvant therapy for pancreatic cancer. N Engl J Med. 2018;379(25):2395–2406. doi:10.1056/NEJMoa1809775
4. Zhan HX, Xu JW, Wu D, et al. Neoadjuvant therapy in pancreatic cancer: a systematic review and meta-analysis of prospective studies. Cancer Med. 2017;6:1201–1219. doi:10.1002/cam4.1071
5. Conroy T, Desseigne F, Ychou M, et al. FOLFIRINOX versus gemcitabine for metastatic pancreatic cancer. N Engl J Med. 2011;364:1817–1825. doi:10.1056/NEJMoa1011923
6. Ishii N, Nishikawa H, Iwata Y, et al. Proposal of predictive model on survival in unresectable pancreatic cancer receiving systemic chemotherapy. J Cancer. 2020;11:1223–1230. doi:10.7150/jca.38861
7. Tsai S, George B, Wittmann D, et al. Importance of normalization of CA19-9 levels following neoadjuvant therapy in patients with localized pancreatic cancer. Ann Surg. 2020;271:740–747. doi:10.1097/SLA.0000000000003049
8. Azizian A, Rühlmann F, Krause T. CA19-9 for detecting recurrence of pancreatic cancer. Sci Rep. 2020;10:1332. doi:10.1038/s41598-020-57930-x
9. Zhuang H, Zhang C, Hou B. FAM83H overexpression predicts worse prognosis and correlates with less CD8(+) T cells infiltration and Ras-PI3K-Akt-mTOR signaling pathway in pancreatic cancer. Clin Transl Oncol. 2020;22:2244–2252. doi:10.1007/s12094-020-02365-z
10. Lee JS, Park SS, Lee YK, et al. Liquid biopsy in pancreatic ductal adenocarcinoma: current status of circulating tumor cells and circulating tumor DNA. Mol Oncol. 2019;13:1623–1650. doi:10.1002/1878-0261.12537
11. Pushalkar S, Hundeyin M, Daley D, et al. The pancreatic cancer microbiome promotes oncogenesis by induction of innate and adaptive immune suppression. Cancer Discov. 2018;8:403–416. doi:10.1158/2159-8290.CD-17-1134
12. Diakos CI, Charles KA, McMillan DC, et al. Cancer-related inflammation and treatment effectiveness. Lancet Oncol. 2014;15:e493–503. doi:10.1016/S1470-2045(14)70263-3
13. Savant SS, Sriramkumar S, O’Hagan HM. The role of inflammation and inflammatory mediators in the development, progression, metastasis, and chemoresistance of epithelial ovarian cancer. Cancers. 2018;10:251. doi:10.3390/cancers10080251
14. Sun DW, An L, Lv GY. Albumin-fibrinogen ratio and fibrinogen-prealbumin ratio as promising prognostic markers for cancers: an updated meta-analysis. World J Surg Oncol. 2020;18:9. doi:10.1186/s12957-020-1786-2
15. Iivanainen S, Ahvonen J, Knuuttila A, et al. Elevated CRP levels indicate poor progression-free and overall survival on cancer patients treated with PD-1 inhibitors. Esmo Open. 2019;4:e000531. doi:10.1136/esmoopen-2019-000531
16. Fourie C, Shridas P, Davis T, et al. Serum amyloid A and inflammasome activation: a link to breast cancer progression? Cytokine Growth Factor Rev. 2021;59:62–70. doi:10.1016/j.cytogfr.2020.10.006
17. Webb NR. High-density lipoproteins and serum amyloid A (SAA). Curr Atheroscler Rep. 2021;23:7. doi:10.1007/s11883-020-00901-4
18. Takehara M, Sato Y, Kimura T, et al. Cancer-associated adipocytes promote pancreatic cancer progression through SAA1 expression. Cancer Sci. 2020;111:2883–2894. doi:10.1111/cas.14527
19. Yang W, Han B, Chen Y, et al. SAAL1, a novel oncogene, is associated with prognosis and immunotherapy in multiple types of cancer. Aging. 2022;14:6316–6337. doi:10.18632/aging.204224
20. Watanabe H, Okada M, Kaji Y, et al. [New response evaluation criteria in solid tumours-revised RECIST guideline (version 1.1)]. Gan To Kagaku Ryoho. 2009;36:2495–2501. Japanese.
21. Camp RL, Dolled-Filhart M, Rimm DL. X-tile: a new bio-informatics tool for biomarker assessment and outcome-based cut-point optimization. Clin Cancer Res. 2004;10:7252–7259. doi:10.1158/1078-0432.CCR-04-0713
22. Coussens LM, Werb Z. Inflammation and cancer. Nature. 2002;420:860–867. doi:10.1038/nature01322
23. Yu T, Guo F, Yu Y, et al. Fusobacterium nucleatum promotes chemoresistance to colorectal cancer by modulating autophagy. Cell. 2017;170:548–563.e16. doi:10.1016/j.cell.2017.07.008
24. Malle E, Sodin-Semrl S, Kovacevic A. Serum amyloid A: an acute-phase protein involved in tumour pathogenesis. Cell Mol Life Sci. 2009;66:9–26. doi:10.1007/s00018-008-8321-x
25. Djurec M, Graña O, Lee A, et al. Saa3 is a key mediator of the protumorigenic properties of cancer-associated fibroblasts in pancreatic tumors. Cancer Sci. 2018;115:E1147–e1156.
26. Chan DC, Chen CJ, Chu HC, et al. Evaluation of serum amyloid A as a biomarker for gastric cancer. Ann Surg Oncol. 2007;14:84–93. doi:10.1245/s10434-006-9091-z
27. He LN, Fu S, Zhang X, et al. Baseline and early changes in circulating Serum Amyloid A (SAA) predict survival outcomes in advanced non-small cell lung cancer patients treated with Anti-PD-1/PD-L1 monotherapy. Lung Cancer. 2021;158:1–8. doi:10.1016/j.lungcan.2021.05.030
28. Wood SL, Rogers M, Cairns DA, et al. Association of serum amyloid A protein and peptide fragments with prognosis in renal cancer. Br J Cancer. 2010;103:101–111. doi:10.1038/sj.bjc.6605720
29. Chiorean EG, Cheung WY, Giordano G, et al. Real-world comparative effectiveness of nab-paclitaxel plus gemcitabine versus FOLFIRINOX in advanced pancreatic cancer: a systematic review. Ther Adv Med Oncol. 2019;11:1758835919850367. doi:10.1177/1758835919850367
30. Kim S, Signorovitch JE, Yang H, et al. Comparative effectiveness of nab-paclitaxel plus gemcitabine vs FOLFIRINOX in metastatic pancreatic cancer: a retrospective nationwide chart review in the United States. Adv Ther. 2018;35:1564–1577. doi:10.1007/s12325-018-0784-z
31. Riedl JM, Posch F, Horvath L, et al. Gemcitabine/nab-Paclitaxel versus FOLFIRINOX for palliative first-line treatment of advanced pancreatic cancer: a propensity score analysis. Eur J Cancer. 2021;151:3–13. doi:10.1016/j.ejca.2021.03.040
32. Marschner N, Hegewisch-Becker S, Reiser M, et al. FOLFIRINOX or gemcitabine/nab-paclitaxel in advanced pancreatic adenocarcinoma: a novel validated prognostic score to facilitate treatment decision-making in real-world. Int J Cancer. 2022;152:458–469. doi:10.1002/ijc.34271
33. Perera S, Jang GH, Wang Y. hENT1 expression predicts response to gemcitabine and nab-paclitaxel in advanced pancreatic ductal adenocarcinoma (PDAC). Clin Cancer Res. 2022;28(23):5115–5120. doi:10.1158/1078-0432.CCR-22-2576
34. Muckenhuber A, Berger AK, Schlitter AM, et al. Pancreatic ductal adenocarcinoma subtyping using the biomarkers hepatocyte nuclear factor-1A and Cytokeratin-81 correlates with outcome and treatment response. Clin Cancer Res. 2018;24:351–359. doi:10.1158/1078-0432.CCR-17-2180
35. Stevens L, Pathak S, Nunes QM, et al. Prognostic significance of pre-operative C-reactive protein and the neutrophil-lymphocyte ratio in resectable pancreatic cancer: a systematic review. HPB (Oxford). 2015;17:285–291. doi:10.1111/hpb.12355
36. Jamieson NB, Glen P, McMillan DC, et al. Systemic inflammatory response predicts outcome in patients undergoing resection for ductal adenocarcinoma head of pancreas. Br J Cancer. 2005;92:21–23. doi:10.1038/sj.bjc.6602305
 © 2023 The Author(s). This work is published and licensed by Dove Medical Press Limited. The full terms of this license are available at https://www.dovepress.com/terms.php and incorporate the Creative Commons Attribution - Non Commercial (unported, v3.0) License.
By accessing the work you hereby accept the Terms. Non-commercial uses of the work are permitted without any further permission from Dove Medical Press Limited, provided the work is properly attributed. For permission for commercial use of this work, please see paragraphs 4.2 and 5 of our Terms.
© 2023 The Author(s). This work is published and licensed by Dove Medical Press Limited. The full terms of this license are available at https://www.dovepress.com/terms.php and incorporate the Creative Commons Attribution - Non Commercial (unported, v3.0) License.
By accessing the work you hereby accept the Terms. Non-commercial uses of the work are permitted without any further permission from Dove Medical Press Limited, provided the work is properly attributed. For permission for commercial use of this work, please see paragraphs 4.2 and 5 of our Terms.