")
Back to Journals » International Journal of Nanomedicine » Volume 10 » Issue 1
SERS-based quantitative detection of ovarian cancer prognostic factor haptoglobin
Authors Perumal J , Balasundaram G , Mahyuddin A, Choolani M, Olivo M
Received 8 October 2014
Accepted for publication 7 December 2014
Published 6 March 2015 Volume 2015:10(1) Pages 1831—1840
DOI https://doi.org/10.2147/IJN.S75552
Checked for plagiarism Yes
Review by Single anonymous peer review
Peer reviewer comments 4
Editor who approved publication: Dr Thomas Webster
Jayakumar Perumal,1 Ghayathri Balasundaram,1 Aniza P Mahyuddin,2 Mahesh Choolani,2 Malini Olivo1,3
1Bio-Optical Imaging Group, Singapore Bioimaging Consortium, Agency for Science Technology and Research (A*STAR), Helios, Singapore; 2Departments of Obstetrics and Gynecology and Surgery, Yong Loo Lin School of Medicine, National University of Singapore, Singapore; 3School of Physics, National University Ireland, Galway, Ireland
Abstract: Surface-enhanced Raman spectroscopy (SERS) is increasingly being used for biosensing because of its high sensitivity and low detection limit, which are made possible by the unique Raman ‘fingerprint’ spectra from the biomolecules. Here we propose a novel SERS method for the fast, sensitive, and reliable quantitative analysis of haptoglobin (Hp), an acute phase plasma glycoprotein that is widely gaining application as a prognostic ovarian cancer biomarker. We exploited the peroxidase activity of the hemoglobin–haptoglobin (Hb–Hp) complex formed by the selective and specific binding of Hp to free Hb to catalyze the reaction of 3,3',5,5'-tetramethylbenzidine (TMB) substrate and hydrogen peroxide to result in the final product of strongly SERS-active TMB2+. We observed a linear increase in the SERS signal of TMB2+ with increasing concentrations of Hb–Hp complex from 50 nM to 34 µM. Based on this concentration-dependent SERS spectrum, we quantified Hp in clinical samples. We observed that our inference about the prognosis of the disease coincided with the histology data and that our method was much more sensitive than the enzyme-linked immunosorbent assay method.
Keywords: SERS-based biosensing, hemoglobin–haptoglobin complex, ovarian cancer, biomarker detection, 3,3',5,5'-tetramethylbenzidine, peroxidase active substrates
Introduction
Haptoglobin (Hp) belongs to a family of acute phase serum glycoproteins. It is majorly generated by hepatocytes in the liver and in little amounts by the skin, kidneys, and lung. Under normal conditions, it is either absent or present at very low levels. However, Hp can increase significantly in response to acute infection, inflammation, or trauma. Recent studies have shown that Hp has been elevated in the sera and ascetic fluid of preoperative ovarian cancer patients, and a decrease was observed in patients undergoing chemotherapy.1 Conventional methods involving enzyme-catalyzed assays, like enzyme-linked immunosorbent assay (ELISA),2 are commonly followed for the detection and quantification of Hp in clinical laboratories. In ELISA, the activity of the enzyme attached to anti-Hp antibody can consequently be measured by means of its reaction with a chromogenic substrate to generate a measurable signal, which can be correlated to the amount of Hp present in a sample. Other than ELISA, electrochemical impedance spectroscopy,3 time-resolved immune fluorometry,4 labor-intensive electrophoresis, chromogen staining,5 or chemiluminescent imaging6 have also been reported for Hp quantification. All these methods are very much time consuming and labor intensive for clinical applications. This necessitates the development of a simple, robust, and antibody-free analytical method that can help clinicians in detecting and quantifying Hp protein in a short time. When colorimetry kits are commercially available to quantify Hp, exploiting the peroxidase activity of the hemoglobin–haptoglobin (Hb–Hp) complex,7 the sensitivity may not be sufficient to help in exact quantification of the Hp protein, which results in uncertainty in categorically predicting whether the patient is borderline or in the acute phase. This calls for an ultrasensitive and easily quantifiable method to detect Hp.
Surface-enhanced Raman spectroscopy (SERS), a powerful emerging vibrational spectroscopy technique, has been realized as an ultrasensitive bioassay platform in recent years because of its advantages, such as enhanced Raman signals by ten to 14 orders of magnitude when Raman active molecule is in close proximity to nanoroughened metal surface and ultrahigh sensitivity and specificity, which are made possible by molecular fingerprint information.8–12 Over the last few decades, SERS has been successfully used for the detection and quantification of many protein biomarkers by tagging the antibodies to highly Raman-active molecules like malachite green isothiocyanate; crystal violet; rhodamine-6G; cyanine derivatives such as Cy3, Cy5, and DTTC;12–16 4-mercaptobenzoic acid; p-aminothiophenol; and many more.17,18 Recently, SERS has been introduced into enzyme-catalyzed reactions following the fact that many of the substrates break down into products that are Raman active. Some of the substrates whose enzyme-catalyzed products possess high Raman scattering cross-sections are O-phenylenediamine,19 biphenyl-4,4′-dithiol,20 and 5-bromo-4-chloro-3-indolyl phosphate.21 In our study, after testing various peroxidase substrates and their corresponding products for SERS activity, we found the substrate 3,3′,5,5′-tetramethylbenzidine (TMB) to give a strongly SERS-active end product, TMB2+. In addition, it is also less toxic compared with many other substrates tested.22 Therefore, herein, for the first time, we used SERS to detect and quantify Hp based on the peroxidase activity of Hb–Hp complex to catalyze the reaction of TMB and H2O2. The working principle behind this reaction is that free Hb exhibits peroxidase activity, which is inhibited at a low pH. Hp present in the specimen combines with Hb and at a low pH preserves the peroxidase activity of the bound Hb. Preservation of the peroxidase activity of Hb is directly proportional to the amount of Hp present in the specimen. Hence, the peroxidase-active Hb–Hp complex oxidizes the SERS-inactive chromogenic reactant TMB liquid into a SERS-active product, TMB2+. We observed a linear increase in the SERS signal of TMB2+ with increasing concentrations of Hb–Hp complex from 50 nM to 34 μM. Based on this concentration-dependent SERS spectrum, we quantified Hp in clinical ovarian cyst fluid samples. We observed that our inference about the prognosis of the disease coincided with that from the histology data, and that our method was much more sensitive than the ELISA method.
Experimental procedure
Materials and methods
Chemicals were obtained from Aldrich and used as received. Hb, TMB, citric acid, bovine serum albumin (BSA), and phosphate-buffered saline were purchased from Sigma-Aldrich. Hp antigens of human origin were purchased from Abcam. Au colloid (60 nm) was obtained from BBI Solutions.
Preparation of Hb–Hp complex
Hp can bind to Hb approximately in the ratio of 1:0.9, based on the information provided in previous work.23–25 Hence, to prepare a 3.3 mg/mL Hb–Hp complex, 3.3 mg of Hp and 2.97 mg of Hb was dissolved in 1 mL of 50% fetal BSA solution. Using this as stock solution, further dilutions were prepared up to 0.01 mg/mL by diluting with 50% fetal BSA solution and allowed to react for 30 minutes. The resultant Hb–Hp complex was stored at −20°C until required. In the case of unknown clinical samples, the highest Hb concentration of 2.97 mg was dissolved into each of the clinical samples and allowed to react for 30 minutes. The resultant Hb–Hp complex was stored at −20°C until required. Both Hb and Hp of human origin were obtained from Sigma-Aldrich and Abcam, respectively, as dry powder. The pH of TMB substrate was originally around 5.5–6.5. Since for our study we needed acidic conditions, we dissolved 0.1 M citric acid to lower the pH to around 2.6–2.8.
Peroxidase reaction using Hb–Hp complex
To perform reactions with different concentrations of Hb–Hp complex and for the cyst fluid samples, first, 7.5 μL of TMB, which was predissolved with H2O2 (from Sigma-Aldrich), with a pH of 2.6–2.8, was taken in an Eppendorf tube. To this solution, 1.5 μL of Hb–Hp complex/spiked serum was added, and the reaction was allowed to proceed for 2 minutes at room temperature after mixing. At the end of 2 minutes, 7.5 μL of 0.5 M H2SO4 was added as a stop solution and vortexed well to stop the peroxidase reaction. Before taking SERS measurements, 45 μL of 60 nm Au colloid (from BBI Solutions) was added to the reaction mixture. SERS measurements were taken by dropping 10 μL of the solution mixture on to the glass slide, which was protected with a coverslip.
Clinical sample study
In this experiment, cyst fluid samples were used for the study from clinical specimens stored at −20°C. Specimens were used in accordance with procedures with approval of the National Healthcare Group Domain Specific Review Board, National University Hospital, Singapore (Domain Specific Review Board reference: D/00/856) committee, with the protocol reference number D2007/240. Informed consent was obtained from each subject.
Raman microscope
SERS measurements were performed in reflection mode with a Raman microscope (Renishaw inVia) using a 633 nm excitation laser with 5% laser power, a 1,800 line/mm grating, and a cooled charge coupled device (−70°C). A 20× objective lens (NA 0.4) delivered the laser beam and collected the back-scattered light. Rayleigh scattering was blocked with a notch filter. The laser spot size was ~3 μm with a power of 0.28 mW. Measurements were performed with a 10-second integration time. Measurements were taken at multiple positions across each SERS region, and data were averaged. Background corrections and curve fittings were carried out using WiRE 3.2 (Renishaw software). Spectra were background subtracted by a six-order polynomial fit before the curve-fitting procedure. The instrument was calibrated with signal from a silicon standard at 520 cm−1.
Ultraviolet-visible absorbance measurement
The wavelength-dependent absorption spectrum was measured using a DU 730 Beckman Coulter spectrophotometer system scanning between 250 nm and 800 nm.
Results and discussion
Colorimetric detection of Hp
Hp has been detected in clinics by traditional enzyme-catalyzed reactions that involve the formation of a chromogen as a result of the reaction between the substrate and the enzyme. The chromogen is quantified by spectrophotometry based on the intensity of the light transmitted. Several chromogenic reactants that undergo instant oxidation by H2O2 in the presence of peroxidase enzymes are commercially available. Of them, TMB is one of the most widely used substrates because of its lower toxicity and higher sensitivity than alternative reactants such as O-phenylenediamine and 2,2′-azino-bis(3-ethylbenzthiazoline-6-sulfonic acid).22 Therefore, we used TMB as a peroxidase substrate for quantifying Hp via the peroxidase activity of the Hb–Hp complex in the presence of H2O2.
The Hb–Hp complex-catalyzed oxidation of TMB by H2O2 proceeds via the two-step two-electron reaction, as shown in Figure 1A. The first step (one-electron oxidation) yields a radical cation, which exists in rapid equilibrium with a blue charge transfer complex. Addition of a strong inorganic acid such as H2SO4 can terminate the reaction, yielding the yellow TMB2+. At this low pH, the formation of the two-electron product is favorable. Both charge transfer complex and TMB2+ can be quantified by spectrophotometer, thus providing a convenient means of detection. Figure 1B represents the photographic image of the oxidized product TMB2+ at different concentrations of Hb–Hp complex. The intensity of the yellow color decreases with decreasing concentration of the Hb–Hp complex, with almost no color at a concentration of 5 μM or less. Figure 1C represents the corresponding ultraviolet-visible spectra of the TMB2+ at the wavelength of 450 nm, which also follows the same trend as the color. The lowest detection limit by this method was observed to be 5 μM, after which the absorbance was almost the same as the blank. This demonstrates that lower concentrations of Hp cannot be detected by the colorimetric method, thus requiring a highly sensitive method to quantify Hp.
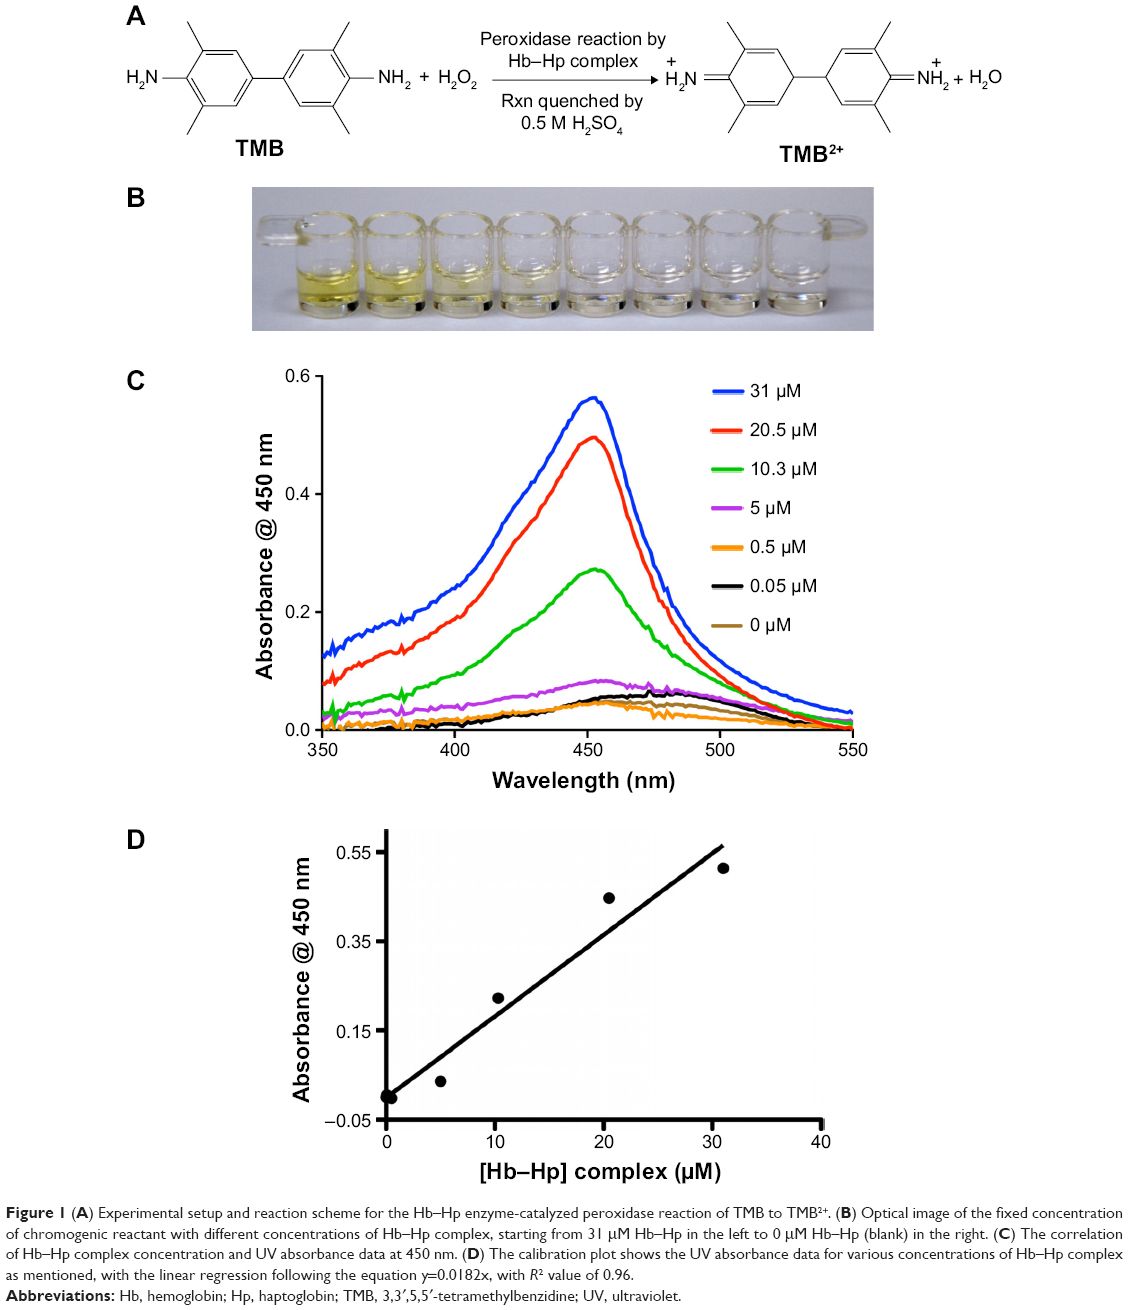 | Figure 1(A) Experimental setup and reaction scheme for the Hb–Hp enzyme-catalyzed peroxidase reaction of TMB to TMB2+. (B) Optical image of the fixed concentration of chromogenic reactant with different concentrations of Hb–Hp complex, starting from 31 μM Hb–Hp in the left to 0 μM Hb–Hp (blank) in the right. (C) The correlation of Hb–Hp complex concentration and UV absorbance data at 450 nm. (D) The calibration plot shows the UV absorbance data for various concentrations of Hb–Hp complex as mentioned, with the linear regression following the equation y=0.0182x, with R² value of 0.96. |
SERS detection of Hp
As the concentration of Hp in ovarian cyst fluid is used as a marker for different types of cancer – in particular, ovarian cancer – and is an essential factor for delineating cancerous ovaries from normal, there is a necessity for a highly sensitive detection and quantification method for determining the prognosis of the disease.1,26,27 Since TMB is known to possess a strong Raman-scattering property, we used Ag nano-island substrate developed by our group28 (see Figure S1 in supplementary material for more details). We were not able to monitor stable SERS spectra upon peroxidase reaction by different concentrations of Hb–Hp complex. This was later confirmed to be an auto-oxidation effect due to continuous oxidation by Ag metal in the presence of H2O2, even in the absence of Hb–Hp complex. Upon repeating the experiments to collect multiple spectra, the signal intensity decreased drastically. This phenomenon of auto-oxidation of gold and silver was previously established by different research groups.29,30 Hence, we chose to use the aqueous gold colloid with an average particle size of 60 nm with the oxidized product TMB2+ to enhance the Raman signal, and used the ultrasensitive SERS modality to quantify the peroxidase activity of Hb–Hp complex and thus the concentration of Hp. Figure 2A represents the SERS spectra of the substrate TMB and its oxidized version TMB2+. Peaks at 1,191, 1,337, and 1,605 cm−1 were identified as the characteristic SERS bands of TMB2+, as shown in Figure 2B. The peak at 1,191 cm−1 represents the characteristic −CH3 bending mode, whereas peaks at 1,337 and 1,605 cm−1 correspond to inter-ring stretching and a combination of ring stretching and CH bending vibrations, respectively.30 With increasing concentrations of Hb–Hp complex, the SERS signal intensity from TMB2+ also increased, and there was a linear correlation between the SERS signal intensity and Hp concentration from 50 nM to 30 μM (see Figure 2C). We observed the lowest detection limit to be 50 nM, which is 100 times better than that observed with a colorimetric method. This confirms the sensitivity of SERS over ultraviolet absorbance/colorimetric methods. In order to determine whether the pH environment has any effect on the signal intensity of TMB2+, we measured SERS activity of the TMB2+ with the same concentration of Hb–Hp complex at different pH conditions. Based on our experiment, we found that only in acidic conditions (pH=2.6) is TMB2+ SERS signal stronger, followed by neutral pH (pH=7), and, finally, at high pH conditions (pH>10), no SERS activity was found, due to the absence of TMB2+ charge transfer complex (see Figure S2). This confirms that only at low pH conditions is stable TMB2+ product formed. Please refer to Figures S3 and S4 to further ascertain that Hb–Hp complex alone does not show SERS signal, and in the absence of Hb no peroxidase reaction can take place, and hence no TMB2+ formation.
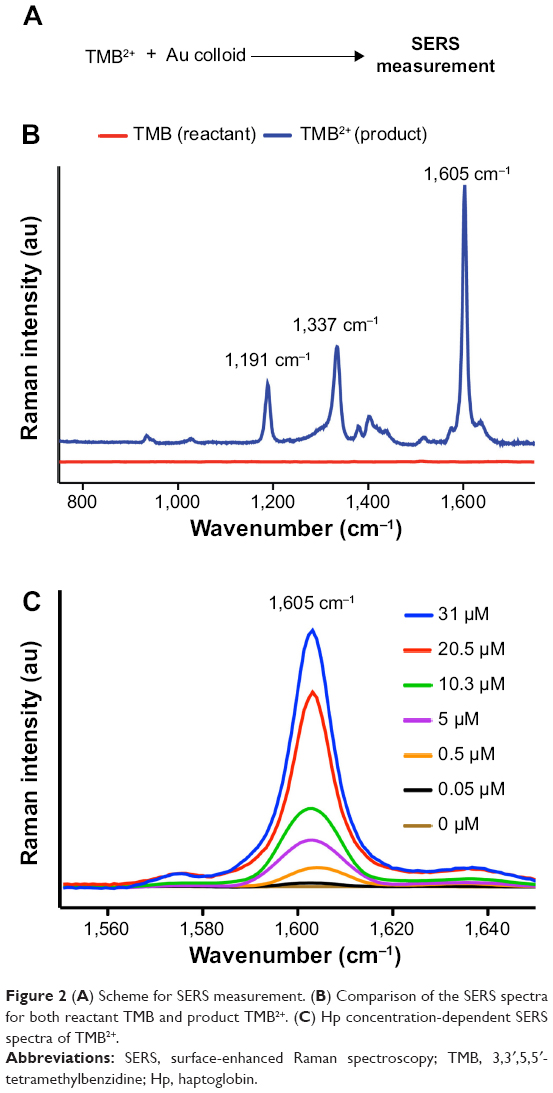 | Figure 2(A) Scheme for SERS measurement. (B) Comparison of the SERS spectra for both reactant TMB and product TMB2+. (C) Hp concentration-dependent SERS spectra of TMB2+. |
Quantification of Hp in clinical ovarian cyst fluid samples
As the product of the enzymatic reaction resulted in a concentration-dependent increase in SERS signal intensity, of the three peaks that were used to identify TMB2+, we chose the SERS intensity at the steadily increasing prominent peak 1,605 cm−1 to plot a standard calibration plot22 (see Figure S5). The calibration plot shows linear regression with an R2 value of 0.98. Four unknown clinical ovarian cyst fluid samples were tested for concentration of Hp using the aforementioned method. The SERS intensity data of the unknown samples containing different concentrations of Hp are interpolated into the calibration plot as shown in Figure 3. The resultant Hp concentrations were calculated as shown in Table 1, on the basis of the previously described linear calibration curve (Y=2,159X+1,613).
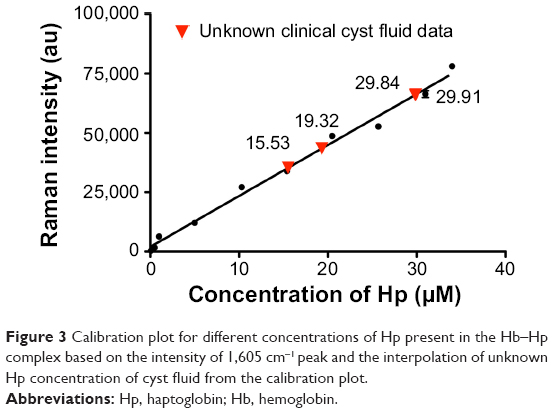 | Figure 3 Calibration plot for different concentrations of Hp present in the Hb–Hp complex based on the intensity of 1,605 cm−1 peak and the interpolation of unknown Hp concentration of cyst fluid from the calibration plot. |
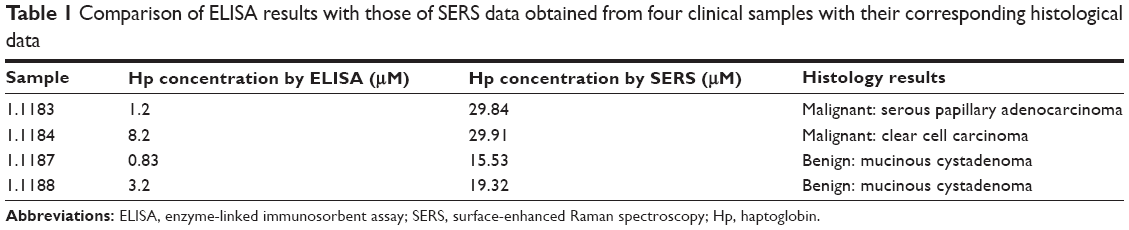 | Table 1 Comparison of ELISA results with those of SERS data obtained from four clinical samples with their corresponding histological data |
Table 1 shows the comparison of ELISA results (refer to Figure S6 for ELISA calibration plot) with those of SERS data obtained from the four clinical samples with their corresponding histological data. Results of Hp concentration in the clinical samples are tabulated in Table 1 together with the inference from the histology data. From the table, it is clear that an SERS-based antibody-free method could quantify overall Hp present in the clinical sample irrespective of its phenotype – ie, Hp(1–1), Hp(2–1), and Hp(2–2)1 – whereas a commercial ELISA kit is capable of quantifying just one specific phenotype, due to the use of corresponding monoclonal antibody. We assume that this could be the reason behind the difference in Hp values between ELISA and SERS methods. Extensive analysis by SERS for a vast amount of clinical samples is needed to ascertain the actual cutoff Hp concentration above which it is considered malignant and below it is benign. Currently, based on our results, we purely speculate that the cutoff Hp concentration may be in the range of 23–28 μM.1 We arrived at this range based on the very few clinical samples we have tested in which the benign samples had an Hp concentration in the range of 15–20 μM, whereas for the malignant samples, the Hp concentration was 29 μM and above. In order to obtain irrefutable data, we need to study a large clinical sample size to arrive at the actual cutoff value. Currently, this work is ongoing. The highlights of this method include short measurement times of less than 10 minutes and the ability to be measured on a portable compact Raman system. This type of bioassay can be extremely useful in operation theaters where the surgeons performing ovarian cystectomy can verify their intraoperative suspicion of malignancy. Ovarian malignancy is unexpectedly encountered in 1%–14% of patients undergoing laparoscopic cystectomy.31 For patients who are still young and want to maintain their fertility, this method will be highly useful for deciding upon suitable surgical procedures. With a benchtop portable Raman system (Figure S7), the prospect of translatability of this method to clinics is very high.
Conclusion
Here we demonstrated a method for enhancing the sensitivity and reliability of quantitative analysis of acute phase protein and ovarian cancer biomarker Hp protein. This method incorporates SERS methodology into the conventional enzyme-catalyzed colorimetric bioassay to develop a more robust and efficient analytical protocol. This method utilizes the peroxidase activity of Hb–Hp complex to catalyze the reaction of the substrate TMB in the presence of H2O2, resulting in the final product TMB2+, which exhibits very good SERS activity. We observed a linear increase in the SERS signal of TMB2+ with increasing concentrations of Hb–Hp complex from 50 nM to 34 μM. Based on this concentration-dependent SERS spectrum, we quantified Hp in clinical samples. We observed that our inference about the prognosis of the disease coincided with the inference from histology data. In summary, we were able to successfully convert the existing colorimetric assay into an SERS-based quantitative analysis of Hp protein within a short reaction time, which has the potential to be used for clinical prognosis of ovarian cancers.
Acknowledgments
This work was funded by Exploit Technologies Pte Ltd under commercialization of technology (Project No. EPTL/12-R15GAP-0027), Agency for Science, Technology, and Research, Singapore. Author contributions: JP and GB contributed equally. AM and MC provided clinical cyst fluid samples and shared the histology results for the same. MO oversaw and managed the research project. All authors have reviewed the manuscript.
Disclosure
The authors have no conflicts of interest in this work.
References
Zhao C1, Annamalai L, Guo C, et al. Circulating haptoglobin is an independent prognostic factor in the sera of patients with epithelial ovarian cancer. Neoplasia. 2007;9(1):1–7. | ||
Porstmann T, Kiessig ST. Enzyme immunoassay techniques. An overview. J Immunol Methods. 1992;150(1–2):5–21. | ||
Liu YC, Rieben N, Iversen L, et al. Specific and reversible immobilization of histidine-tagged proteins on functionalized silicon nanowires. Nanotechnology. 2010;21(24):245105. | ||
Gutierrez M, Ceron JJ, Marsilla BA, Parra MD, Martinez-Subiela S. Dual-label time-resolved fluoroimmunoassay for simultaneous quantification of haptoglobin and C-reactive protein in meat juice from pigs. Can J Vet Res. 2012;76(2):136–142. | ||
Cheng TM, Pan JP, Lai ST, Kao LP, Lin HH, Mao SJ. Immunochemical property of human haptoglobin phenotypes: determination of plasma haptoglobin using type-matched standards. Clin Biochem. 2007;40(13–14):1045–1056. | ||
Huang GM, Ouyang J, Delanghe JR, Baeyens WRG, Dai ZX. Chemiluminescent image detection of haptoglobin phenotyping after polyacrylamide gel electrophoresis. Anal Chem. 2004;76(11):2997–3004. | ||
“PHASE” TM Haptoglobin Assay Cat. No. TP-801. Tridelta Development Limitied. Available from: http://www.nordiclabsupply.se/modules/pdf2/Haptoglobin%20Assay.pdf. Accessed January 28, 2014. | ||
Aroca R. Surface-Enhanced Vibrational Spectroscopy. Chichester, UK: John Wiley & Sons; 2006. | ||
Moskovits M. Surface-enhanced Raman spectroscopy: a brief retrospective. J Raman Spectrosc. 2005;36(6–7):485–496. | ||
Anker JN, Hall WP, Lyandres O, Shah NC, Zhao J, Van Duyne RP. Biosensing with plasmonic nanosensors. Nat Mater. 2008;7:442–453. | ||
Camden JP, Dieringer JA, Wang Y, et al. Probing the structure of single-molecule surface-enhanced Raman scattering hot spots. J Am Chem Soc. 2008;130(38):12616–12617. | ||
Qian X, Peng XH, Ansari DO, et al. In vivo tumor targeting and spectroscopic detection with surface-enhanced Raman nanoparticle tags. Nat Biotechnol. 2008;26:83–90. | ||
Maiti KK, Dinish US, Samanta A, et al. Multiplex targeted in vivo cancer detection using sensitive near-infrared SERS nanotags. Nano Today. 2012;7(2):85–93. | ||
Dinish US, Balasundaram G, Chang YT, Olivo M. Sensitive multiplex detection of serological liver cancer biomarkers using SERS-active photonic crystal fiber probe. J Biophotonics. 2014;7(11–12):956–965. | ||
Huang PJ, Chau LK, Yang TS, Tay LL, Lin TT. Nanoaggregate-embedded beads as novel Raman labels for biodetection. Adv Funct Mater. 2009;19(2):242–248. | ||
Mahajan S, Richardson J, Brown T, Bartlett NP. SERS-melting: a new method for discriminating mutations in DNA sequences. J Am Chem Soc. 2008;130(46):15589–15601. | ||
Xu S, Ji X, Xu W, et al. Immunoassay using probe-labelling immunogold nanoparticles with silver staining enhancement via surface-enhanced Raman scattering. Analyst. 2004;129(1):63–68. | ||
Kho KW, Dinish US, Kumar A, Olivo M. Frequency shifts in SERS for biosensing. ACS Nano. 2012;6(6):4892–4902. | ||
Wu ZS, Zhou GZ, Jiang JH, Shen GL, Yu RQ. Gold colloid-bienzyme conjugates for glucose detection utilizing surface-enhanced Raman scattering. Talanta. 2006;70(3):533–539. | ||
Guarrotxena N, Liu B, Fabris L, Bazan GC. Antitags: nanostructured tools for developing SERS-based ELISA analogs. Adv Mater. 2010;22(44):4954–4958. | ||
Ruan C, Wang W, Gu B. Detection of alkaline phosphatase using surface-enhanced Raman spectroscopy. Anal Chem. 2006;78(10):3379–3384. | ||
Laing S, Hernandez-Santana A, Sassmannshausen J, et al. Quantitative detection of human tumor necrosis factor α by a resonance Raman enzyme-linked immunosorbent assay. Anal Chem. 2011;83(1):297–302. | ||
Langlois MR, Delanghe JR. Biological and clinical significance of haptoglobin polymorphism in humans. Clin Chem. 1996;42:1589–1600. | ||
Melamed-Frank M, Lache O, Enav BI, et al. Structure-function analysis of the antioxidant properties of haptoglobin. Blood. 2001;98:3693–3698. | ||
Sigma. Haptoglobin, Phenotype 1. Product Information. Available from: https://www.sigmaaldrich.com/content/dam/sigma-aldrich/docs/Sigma/Datasheet/2/h0138dat.pdf. Accessed January 22, 2015. | ||
Umaira T, Obula R, Geetashree M. Elevated serum haptoglobin is associated with clinical outcome in triple-negative breast cancer patients. Asian Pac J Cancer Prev. 2012;13(9):4541–4544. | ||
Matsumoto H, Shinzaki S, Narisada M, et al. Clinical application of a lectin-antibody ELISA to measure fucosylated haptoglobin in sera of patients with pancreatic cancer. Clin Chem Lab Med. 2010;48(4):505–512. | ||
Perumal J, Kong KV, Dinish US, Bakker RM, Olivo M. Design and fabrication of random silver films as substrate for SERS based nano-stress sensing of proteins. RSC Adv. 2014;4(25):12995–13000. | ||
Wang S, Chen W, Liu A-L, Hong L, Deng H-H, Lin X-H. Comparison of the peroxidase-like activity of unmodified, amino-modified, and citrate-capped gold nanoparticles. Chemphyschem. 2012;13(5):1199–1204. | ||
McKeating KS, Sloan-Dennison S, Graham D, Faulds K. An investigation into the simultaneous enzymatic and SERRS properties of silver nanoparticles. Analyst. 2013;138(21):6347–6353. | ||
Marana R, Muzii L, Ferrari S, Catalano GF, Zannoni G, Marana E. Management of adnexal cystic masses with unexpected intracystic vegetations detected during laparoscopy. J Minim Invasive Gynecol. 2005;12:502–507. |
Supplementary materials
For surface-enhanced Raman spectroscopy (SERS) measurements, two methods were employed: one is substrate based and the second is metal colloid based. For SERS substrate, we used our previously established Ag nano-island on Si wafer, with the average particle size in the range of 25–50 nm.1 For the metal colloids, we used commercially available 60 nm Au colloids. Figure S1 shows the scanning electron microscope (SEM) image of both substrate and metal colloids.
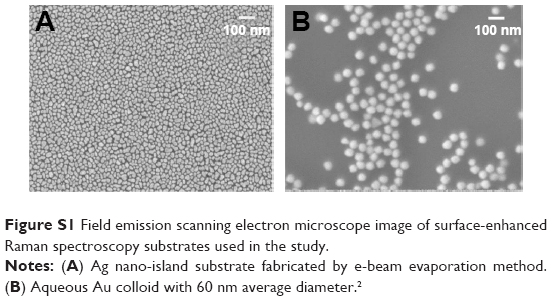 | Figure S1 Field emission scanning electron microscope image of surface-enhanced Raman spectroscopy substrates used in the study. |
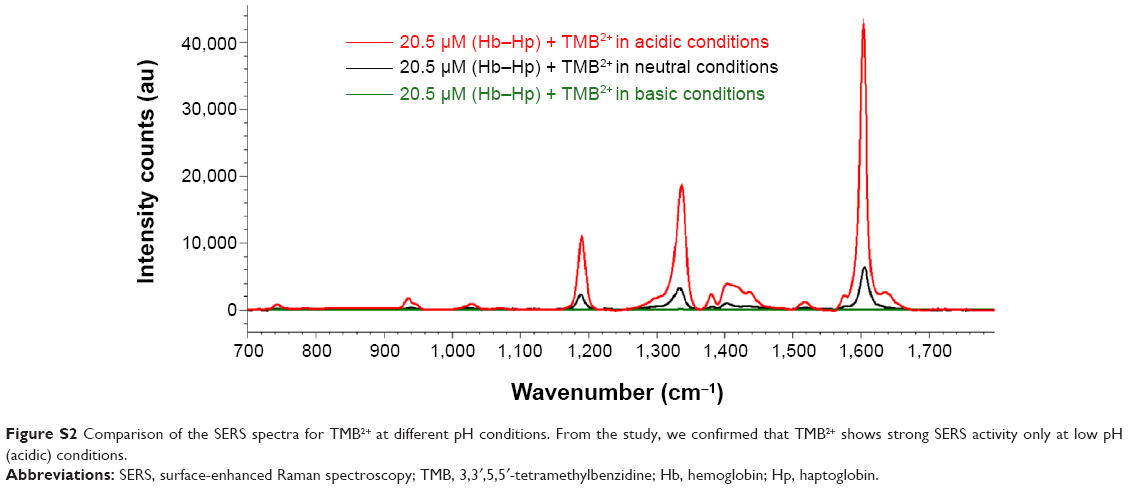 | Figure S2 Comparison of the SERS spectra for TMB2+ at different pH conditions. From the study, we confirmed that TMB2+ shows strong SERS activity only at low pH (acidic) conditions. |
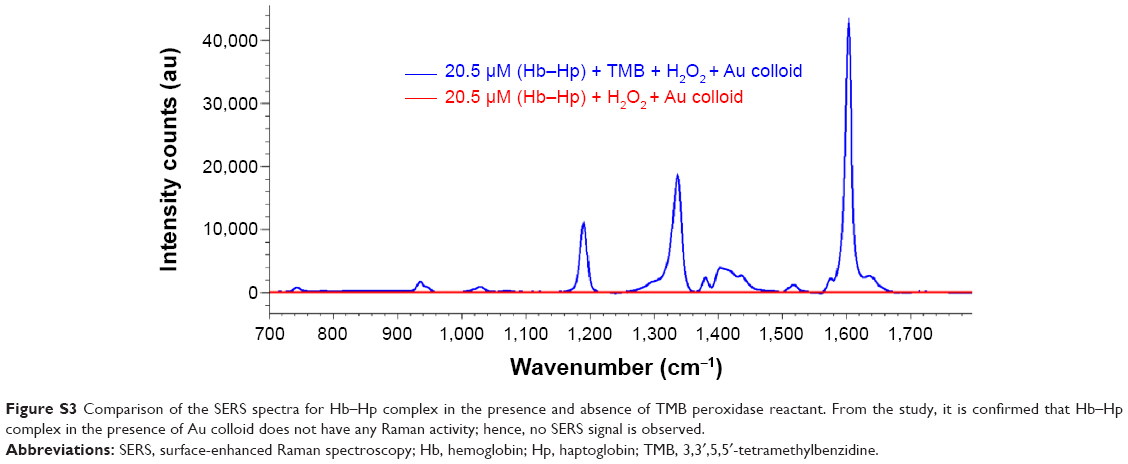 | Figure S3 Comparison of the SERS spectra for Hb–Hp complex in the presence and absence of TMB peroxidase reactant. From the study, it is confirmed that Hb–Hp complex in the presence of Au colloid does not have any Raman activity; hence, no SERS signal is observed. |
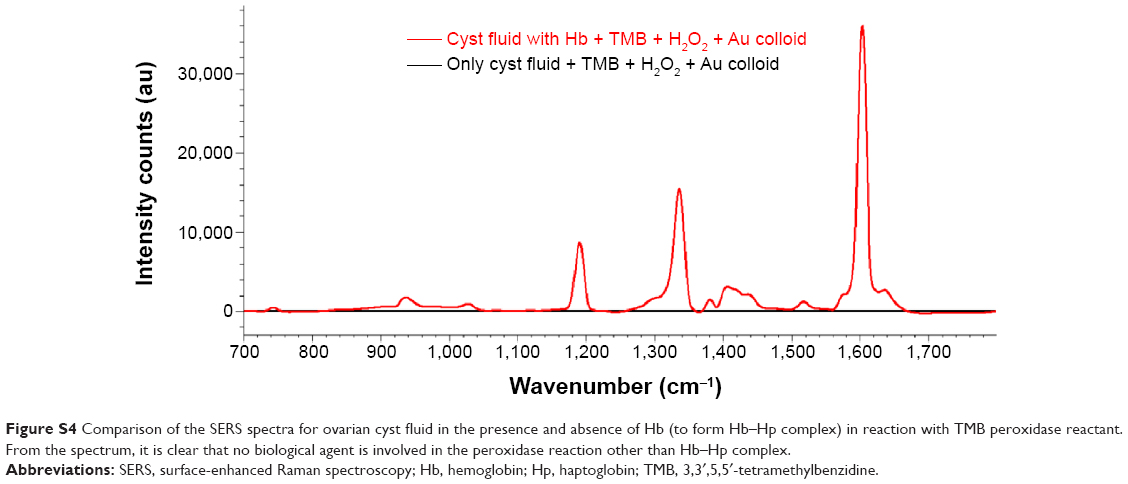 | Figure S4 Comparison of the SERS spectra for ovarian cyst fluid in the presence and absence of Hb (to form Hb–Hp complex) in reaction with TMB peroxidase reactant. From the spectrum, it is clear that no biological agent is involved in the peroxidase reaction other than Hb–Hp complex. |
Experiments were done to know whether the pH environment has any effect on the signal intensity of 3,3′,5,5′-tetramethylbenzidine (TMB2+). We measured SERS activity of TMB2+ with the same concentration of Hb–Hp complex at different pH conditions. Based on our experiment, we found that only in acidic conditions (pH=2.6) is TMB2+ SERS signal stronger, followed by neutral pH (pH=7), and, finally, at high pH conditions (pH>10), no SERS activity was found, due to the absence of TMB2+ charge transfer complex (see Figure S5). This confirms that only at low pH conditions is stable TMB2+ product formed.
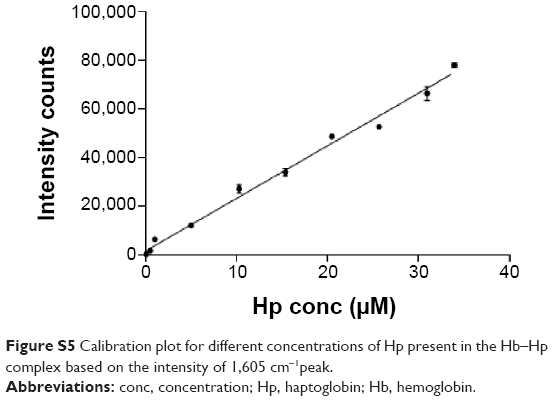 | Figure S5 Calibration plot for different concentrations of Hp present in the Hb–Hp complex based on the intensity of 1,605 cm−1peak. |
Further, to ascertain whether Hb–Hp complex provides any interference with SERS signal that adds up to TMB2+ signal, we tested two samples – one with TMB peroxidase reactant and the second without TMB – and allowed the enzymatic reaction to take place. Finally, both samples were measured for SERS activity in the presence of Au colloids. As shown in Figure S6, Hb–Hp complex does not show any Raman activity; hence, no SERS signal is observed, whereas the sample with TMB showed strong SERS activity due to the formation of TMB2+. Similarly, we have experimentally confirmed that there is no competing peroxidase reaction possible in the absence of Hp through any other biological agent present in the cyst fluid (see Figure S7). Here, we tested the reaction mixture with cyst fluid and peroxidase-reactant TMB with H2O2 in the presence and absence of Hb to form Hb–Hp complex. Our results showed that only the sample with Hb in it could undergo peroxidase reaction to form Raman-active TMB2+ due to the formation of Hb–Hp complex. The second sample without Hb did not undergo a peroxidase reaction.
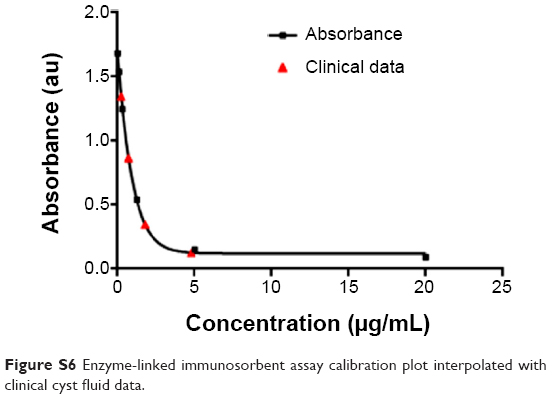 | Figure S6 Enzyme-linked immunosorbent assay calibration plot interpolated with clinical cyst fluid data. |
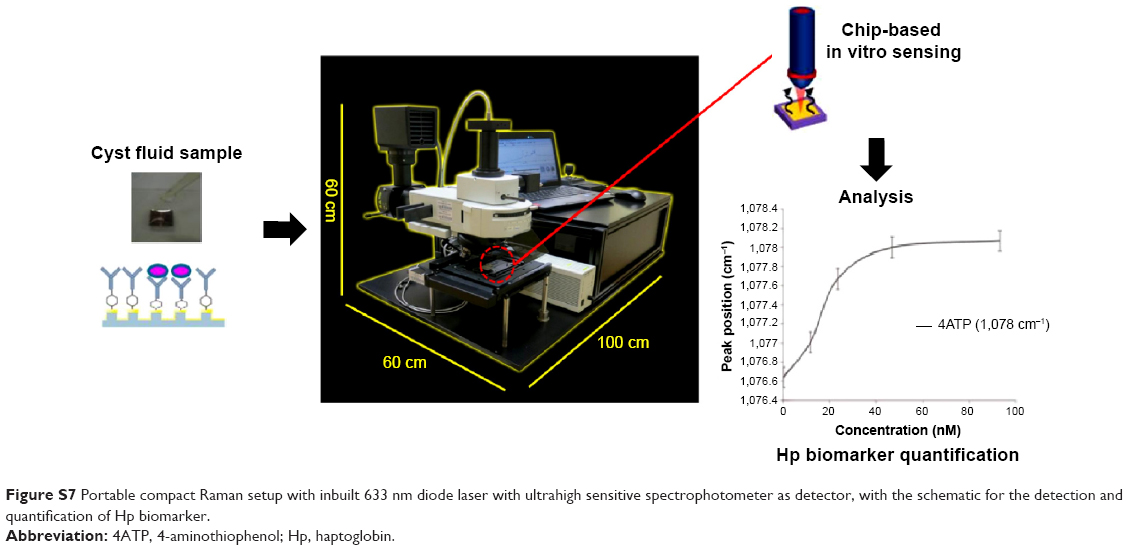 | Figure S7 Portable compact Raman setup with inbuilt 633 nm diode laser with ultrahigh sensitive spectrophotometer as detector, with the schematic for the detection and quantification of Hp biomarker. |
We derived the calibration plot using different concentrations of hemoglobin–haptoglobin (Hb–Hp) complex with a fixed concentration of peroxidase substrate and H2O2 and recording the corresponding SERS intensity of the product peak at 1,605 cm−1 obtained by the peroxidase reaction in the presence of Hb–Hp complex. As shown in Figure S5, we have a calibration plot with linear regression with an R2 value of 0.98.
A commercial enzyme-linked immunosorbent assay (ELISA) kit was purchased from Abcam for Hp quantification. Following the standard protocol given in the ELISA kit, a calibration plot was prepared based on the ultraviolet absorbance data, please refer to Figure S6. Finally, clinical cyst fluid samples were run in the same way, and the data were interpolated into the ELISA calibration plot to derive the concentration of Hp present in the various cyst fluid samples. In order to use it at the bedside, a portable Raman microscope system was developed by our group for fast and reliable SERS-based detection and quantification of Hp in ovarian cyst fluid so that our method could be translated to clinical application. As an initial step, we have designed and assembled our in-house portable compact Raman system, as shown in Figure S7.
References
Perumal J, Kong KV, Dinish US, Bakker RM, Olivo M. Design and fabrication of random silver films as substrate for SERS based nano-stress sensing of proteins. RSC Adv. 2014;4(25):12995–13000. | ||
Anionic Gold Nanoparticles. BBI Solutions; BBI Group. Available from: http://www.bbisolutions.com/support/featured-products/anionic-gold-nanoparticles/. Accessed January 28, 2014. |
 © 2015 The Author(s). This work is published and licensed by Dove Medical Press Limited. The full terms of this license are available at https://www.dovepress.com/terms.php and incorporate the Creative Commons Attribution - Non Commercial (unported, v3.0) License.
By accessing the work you hereby accept the Terms. Non-commercial uses of the work are permitted without any further permission from Dove Medical Press Limited, provided the work is properly attributed. For permission for commercial use of this work, please see paragraphs 4.2 and 5 of our Terms.
© 2015 The Author(s). This work is published and licensed by Dove Medical Press Limited. The full terms of this license are available at https://www.dovepress.com/terms.php and incorporate the Creative Commons Attribution - Non Commercial (unported, v3.0) License.
By accessing the work you hereby accept the Terms. Non-commercial uses of the work are permitted without any further permission from Dove Medical Press Limited, provided the work is properly attributed. For permission for commercial use of this work, please see paragraphs 4.2 and 5 of our Terms.