")
Back to Journals » Journal of Multidisciplinary Healthcare » Volume 7
Sensory impairments in community health care: a descriptive study of hearing and vision among elderly Norwegians living at home
Authors Haanes GG, Kirkevold M, Horgen G, Hofoss D, Eilertsen G
Received 29 November 2013
Accepted for publication 20 February 2014
Published 28 May 2014 Volume 2014:7 Pages 217—225
DOI https://doi.org/10.2147/JMDH.S58461
Checked for plagiarism Yes
Review by Single anonymous peer review
Peer reviewer comments 3
Gro Gade Haanes,1 Marit Kirkevold,2 Gunnar Horgen,1 Dag Hofoss,2 Grethe Eilertsen1
1Buskerud and Vestfold University College, Kongsberg, Norway; 2University of Oslo, Oslo, Norway
Background: Hearing and vision impairments increase with age and are common risk factors for functional decline reduced social participation and withdrawal.
Objective: Describe the hearing and vision of home care patients older than 80 years.
Methods: Ninety-three older adults (80+ years) receiving home care were screened for hearing and vision in their homes. Data were collected using a HEINE Mini 3000® Otoscope to examine the eardrum and presence of earwax, an Entomed SA201-IV portable pure-tone audiometer to measure the pure-tone average (PTAV), a logarithm of the minimum angle of resolution chart to measure visual acuity (VA), and the Combined Serious Sensory Impairment interview guide.
Results: Slight and moderate hearing impairments were found in 41% and 47% of the population, respectively (mean PTAV =40.4 dB for the better ear), and 40% and 56% had impaired and slightly impaired vision, respectively (mean VA =0.45 for the better eye). The participants' self-assessments of hearing and vision were only weakly correlated with PTAV and VA values. The visual function was significantly worse in men than in women (P=0.033). Difficulty in performing instrumental activities of daily living because of hearing and vision impairments was experienced by 17% of the participants, whereas 76% experienced no difficulties. When many people were present, 72% of the participants found it difficult to understand speech. Nearly 30% found it tiring to read, and 41% could not read very small print.
Conclusion: The patients’ self-assessments of their hearing and vision did not correlate strongly with their VA and PTAV scores. Asking the elderly about their overall hearing and vision ability is not sufficient for detecting sensory impairment, and asking more specific questions about what they could not hear and see was not an adequate indicator of the patients’ hearing and vision problems. To detect hearing and vision impairments among elderly home care patients, standardized measurements of their hearing and vision are necessary.
Keywords: dual sensory impairment, home care, vision, hearing, elderly
Introduction
It is well known that hearing and vision deficits are common in older populations and that these impairments increase with age. Those older than 80 years (designated as “80+”) often have serious health issues and sensory impairments that may significantly adversely affect their independence and daily life functioning. This makes it necessary to have accurate information about sensory functioning in this population. In a Norwegian study,1 the researchers initially used a checklist method to ask the participants about their hearing and vision. On the basis of the obtained results, further tests and follow-up were applied to those who described their hearing and/or vision as impaired. A major problem with the study is that it did not determine whether the subjects who did not rate their hearing and/or vision as impaired actually had normal sensory functioning.
There is limited knowledge about the relationship between self-assessment and standardized tests, such as the pure-tone audiometry and visual acuity (VA) tests, in the 80+ cohort. Studies have shown that home care nurses appear to pay limited attention to sensory losses,2,3 so that the problems and difficulties related to age-related sensory loss may be overlooked and underestimated. In addition, there seems to be little knowledge about whether the 80+ have sufficient information to even seek help in the first place and whether they do receive the help that is available to compensate for their impairments.
Impairments in hearing and vision are well-known risk factors for social withdrawal and depression.4,5 It has also been emphasized that impairments in hearing and vision can have a serious effect on a person’s quality of life.2,5–8 One new study showed that many elderly living at home feel lonely.9 If they also suffer from hearing and vision impairment, they may be even more vulnerable. Several studies10–13 have demonstrated that hearing and vision impairments significantly influence the activities of daily living (ADL), which refers to daily self-care activities such as dressing, eating, and personal hygiene, and the instrumental activities of daily living (IADL), which refers to activities such as using the telephone, managing money, doing housework, and shopping. Both types of impairment increase the risk of falls,14,15 and fear of falling can lead to general uncertainty, dependency, feeling unsafe, reduced social participation, and difficulties carrying out daily activities.13,16
The nursing procedures used in home care for identifying sensory impairment among the 80+ appear to be deficient or, at best, variable. Several studies claim that age-related hearing and vision loss offer challenges for gerontological nursing practice.2,3 The aim of this study was therefore to describe the hearing and vision of a population of 80+ who receive home care. The relationship between results from standardized tests (the pure-tone average [PTAV] and VA values) and an individual’s self-assessment of hearing and vision was also examined, as was how sensory impairments influence verbal communication and reading ability in daily life. The following three research questions were posed: what characterizes hearing and vision among the 80+ receiving home care? Do the results from the standardized tests match the patients’ self-assessment of the two sensory functions? How do sensory impairments affect verbal communication and reading in daily life?
Design
This study formed part of a larger controlled, randomized experimental study of sensory impairments and the lighting conditions in homes of the elderly (80+) who receive home care. This article presents a baseline description of the data on hearing and vision impairment.
Materials and methods
Sample
A total of 100 patients were drawn randomly from a home care patient list in five municipalities in the southeast of Norway. Two nurses in each municipality identified patients who filled the inclusion criteria (ie, were aged 80+ years, were receiving home care, and spoke Norwegian). The exclusion criteria were the presence of cognitive impairment, dementia, or palliative patients. Data were collected during October and November 2011.
Instruments
The instruments and measured variables are shown below in Table 1.
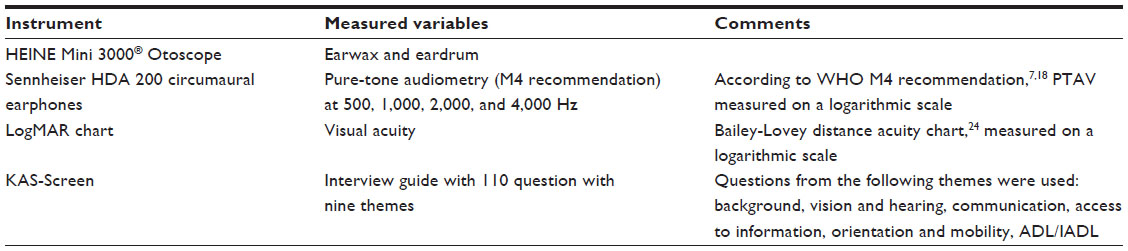 | Table 1 Instruments and measured variables |
HEINE Mini 3000® Otoscope
The ear was inspected for earwax, and a HEINE Mini 3000® Otoscope (HEINE Optotechnik, Herrsching, Germany) was used to examine the eardrum.
Pure-tone audiometry
Pure-tone audiometry was conducted in accordance with the modified Hughson-Westlake ascending technique, as specified in EN ISO 8253-1:2010, using an Entomed SA201-IV (Entomed Norge AS, Lillestrøm, Norway) portable manual audiometer equipped with Sennheiser HDA 200 circumaural earphones (Sennheiser Electronic Corporation, Wennebostel, Germany). Audiometric thresholds were established separately for the left and right ear, using the M4 recommendation of the World Health Organization (WHO), which requires the establishment of sensitivity at frequencies of 500, 1,000, 2,000, and 4,000 Hz, to estimate mean hearing loss.17 The PTAV is the average value at these frequencies. The severity of hearing impairment was thus categorized using the PTAV score.
Calculations were based on hearing scores of the participants’ better ear. The subjects did not wear hearing aids during this test. There is a discussion within the scientific community about whether the M4 recommendation alone is appropriate for capturing presbyacusis, with it being argued that 6,000 and 8,000 Hz should be included in the evaluation.18 There have been different practices:19,20 there are at least two studies that have included the frequencies 6,000 and 8,000 Hz,21,22 but the M4 recommendation with 500, 1,000, 2,000, and 4,000 Hz is the most used.
Logarithm of the minimum angle of resolution chart
The mapping tool included screening of VA with a Bailey-Lovey LogMAR (logarithm of the minimum angle of resolution) distance acuity chart, which measures the minimum angle of resolution on a logarithmic scale.23 The LogMAR chart was originally developed for use in children but has been shown to give equivalent measurements to the Snellen chart in adults;24 it has also been used in other surveys in older people.25 The LogMAR chart was chosen because it provides the most valid results, is easy to learn, easy to use, and easy for nurses to transport on home visits. VA (LogMAR) values ranging from 0.0 to 1.0 (equivalent to Snellen 20/20 to 20/200) were measured at a distance of 6 or 4 m, depending on the room. When using a distance of 4 m, the results were recalculated to express the same values.
This study formed part of a larger randomized controlled experimental study of sensory impairments and the lighting conditions in homes of the elderly (80+) who receive home care. This article presents a baseline description of the data on hearing and vision impairment. This means that the result from the vision testing represents the maximum VA in the lighting condition that existed in the elder’s home at the time of the test. It is therefore possible that the optimal VA is better. The VA test was performed with the patient wearing his/her spectacles (best correction), and the calculations were based on the results obtained by the patient’s best eye.
Combined Serious Sensory Impairment interview guide (Kombinert Alvorlig Sansesvikt [KAS]-Screen)
The KAS (Kombinert Alvorlig Sansesvikt; Combined Serious Sensory Impariment)-Screen1 was used for screening and data collection. This instrument consists of 110 open and standardized questions designed to reveal the subject’s assessment of their sensory impairments. The KAS-Screen provides information about the following nine subscales: background; vision and hearing; verbal communication and social life; access to information; orientation and mobility; ADL/IADL; health issues and the need for help; social network; and where the patient lives, financial situation, and special circumstances. The questions used in this study were taken from the following subscales: background; vision and hearing; verbal communication and social life; access to information and mobility and ADL/IADL. Questions such as whether they used a white stick or a “hand alphabet” were not included in the study because none of the participants used those. A previous evaluation and validation found the KAS-Screen to be adequate as a checklist detecting for hearing and vision impairments in the elderly.1,7
Data collection
The participants, who signed a consent form before inclusion, were visited at home by eleven nurses and two experienced and specially trained nursing assistants. Because of the comprehensive nature of the data collection procedure, which could take 1–2 hours, and because some of the participants found it tiring, in some cases the nurses had to visit a participant more than once to complete the task. The study was approved by the Norwegian Social Science Data Service and assessed by the Regional Ethics Committee.
Statistical analysis
Statistical analyses were performed with the Statistical Package for Social Sciences for Windows (SPSS version 21.0; IMB, Armonk, NY, USA). Descriptive statistics were used to examine demographic data, hearing ability at different frequencies, visual function, and functions in daily life. For quantifying hearing function, PTAV scores for the better ear of ≤25 dB, 25–40 dB, 40–60 dB, 61–80 dB and ≥80 dB were categorized as normal hearing or slight impairment, light, moderate, severe, and profound hearing losses, respectively. A hearing loss of more than 40 dB is considered a disabling hearing impairment.17 For quantifying visual function, VA decimalized values for the better eye of ≥0.8, 0.4–0.8, and ≤0.4 were characterized as normal, slightly visually impaired, and visually impaired, respectively.26,27
Referring to the questions in the KAS-screen the distribution of the answers from the KAS-Screen indicated it would be appropriate to recode the four response alternatives into two to both increase the number of samples in each group and ensure appropriate group sizes for further analyses.28 This was done after the data were collected. The original response alternatives of “yes, that’s fine” and “it is sometimes difficult” were recoded into “yes, usually” and “it is very difficult”, and “no, I cannot do it” was recoded into “no, not usually”.
Linear regression analysis was used to examine the relationship between the sensory impairments, sex, and age. One-way analysis of variance was used to examine the relationship between the results of standardized tests and the self-assessments. Bivariate correlations, χ2-tested crosstabs, and Spearman’s ρ were used to determine whether impaired hearing and vision rendered it more difficult to communicate, read, and perform daily activities, including ADL/IADL. Dual sensory impairment was defined as impairments in both hearing and vision.7 Odds ratio (OR) was calculated for dual sensory impairment.
Results
Among the 100 recruited participants, four died and three were admitted to hospital during the data collection period. The final sample thus included 93 participants (72 women and 21 men) with a mean age of 88 years (median, 89 years [88 years for women and 90 years for men]), of whom 79% lived alone (87% of women and 57% of men). The highest level of education was 7 years of primary school for 68% (n=63) of the participants, continuation school (or lower secondary school) for 10% (n=9), secondary school for 11% (n=10), and high school or university for 12% (n=11). Their occupations included outdoor work and industrial work, such as engineer, carpenter, sailor, farm worker, and factory worker. All of the participants had serious health challenges and needed help or assistance to manage their daily life. They rarely went outside, and 62% never left home alone. Seventy-three percent could not use public transport because of health issues, and 26% needed an escort or help to take a taxi.
Characteristics of the hearing function
When the participants were asked to assess their own hearing, 50% (n=46) of the total of 91 participants said their “hearing was good”, including 50% (n=35) of the 70 women and 57% (n=12) of the 21 men. “Not so good hearing” was reported by 29% (n=27), including 33% (n=23) of the women and 19% (n=4) of the men. “Poor hearing” was reported by 16% (n=15), including 14% (n=10) of the women and 24% (n=5) of the men.
Two of the 93 participants, both women, had ticked two out of four response alternatives and are therefore not accounted for in terms of self-assessment for hearing. The relationship of what they said with PTAV results is shown in Figure 1.
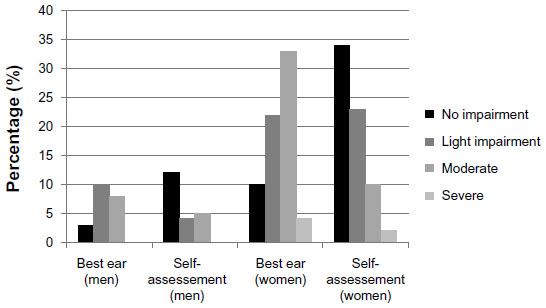 | Figure 1 Measured pure-tone average and self-assessment of the hearing function, measured in percentage. |
Linear regression analysis revealed that age was a significant factor for hearing impairment (P=0.025), but sex was not.
When asked about the causes of their hearing problems, 18 of the participants said they did not know, 19 thought it to be age-related, and eight reported it to be noise-induced damages from previous work, illness, hereditary, ear infections (otitis), and tinnitus.
Examination with the HEINE Mini 3000® Otoscope revealed that nine of the participants had so much earwax that it was considered to affect their hearing; another participant had a damaged eardrum.
Two of the participants were not able to complete the pure-tone audiometry test; the nurses reported that this was either because they did not hear sufficiently to perform the test or they failed to adhere to the implementation of the test.
The prevalence rates of differing degrees of hearing loss in the present cohort categorized according to WHO reference values17 are given in Table 2.
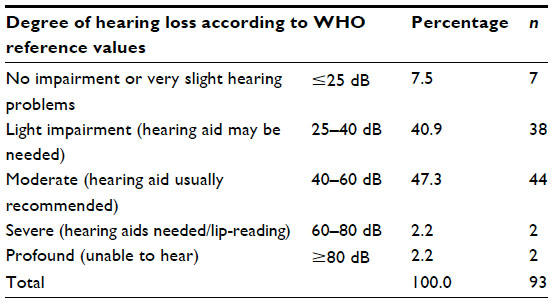 | Table 2 Distribution of the measured pure-tone average |
The mean PTAV for the better ear was 40.4 dB (median =41.25 dB). Slight hearing loss was found in 41% and moderate hearing loss in 47% of the entire cohort (Table 2).
Of the 11% (n=21) of the participants who had hearing aids, only 14 used them daily; four had hearing aids for both ears but only used one. Two used them only for social gatherings.
Characteristics of the vision function
When the participants were asked to assess their own vision, 54% (n=50) said their “vision was good”, including 51% (n=37) of the 72 women and 62% (n=13) of the 21 men; 26% (n=24) said “not so good”, including 28% (n=20) of the women and 19% (n=4) of the men; and 12% (n=11) said their “vision was poor”, including 14% (n=10) of the women and 0.5% (n=1) of the men. Two women and one man said “very poor/blind”. The distribution of what they said versus VA results is shown in Figure 2.
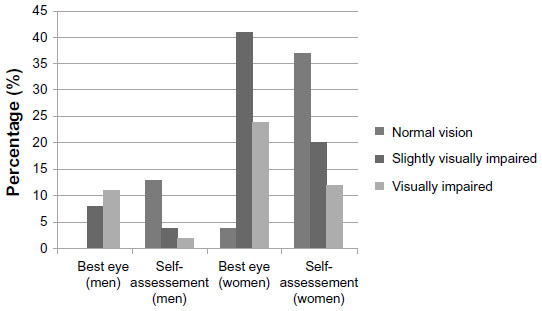 | Figure 2 Measured visual acuity and the self-assessment of the visual function, measured in percentage. |
When asked about earlier diagnoses related to the eyes, 32.2% (n=30) stated they had been diagnosed with cataract, 6.5% (n=6) with age-related macular degeneration, 8.6% (n=8) with glaucoma, and 10.8% (n=10) with other eye-related, undiagnosed illnesses or eye problems, such as watery eyes, astigmatism, disappearance of sharp vision, far-sightedness, and posterior capsular opacification (after cataract).
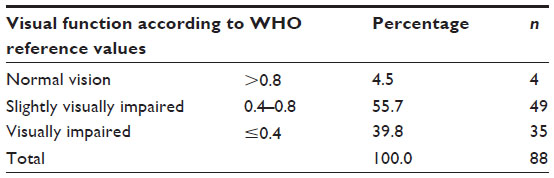
Five of the 93 participants could not see any of the letters at all on the LogMAR chart at a range of either 6 m or 4 m. Of the remaining 88 participants, five were blind in their right and three in their left eye. The VA distribution of the best eye of the participants was identified and is shown in Table 3 and Figure 2. Mean VA was 0.45 (median, 0.42), which, according to the WHO classification,27 indicates slight visual impairment (Table 3). Among the participants, 15 used spectacles daily, whereas 19 used them occasionally. The age of the spectacles was not questioned. Independent-sample t-tests revealed that the visual function was significantly worse in men than in women (P=0.033; mean VA difference =0.11). The mean age differed by nearly 3 years between the men and women.
 | Table 3 Distribution of measured visual acuity |
Of the 93 participants, vision impairment, obtained by combining “visually impaired” and “slightly visually impaired,” was detected in more than 90% (Table 3).
Dual sensory impairment
The sample size was not sufficient to detect an OR for dual sensory impairment with 95% significance, but the data do provide a possible indication. Dual sensory impairment was observed in 28% of the entire cohort (27.9% and 36.8% of women and men, respectively). The odds for having dual sensory impairment were 0.582 for men and 0.368 for women. ORmale/female for having dual impairment was 1.582.
Thus, although there is no evidence that it is more common for men than for women to have dual sensory impairment, more than one-third of the men (37%) and one-quarter of the women (27%) in this study had dual sensory impairment (χ2=0.215).
Correlations between the standardized tests of hearing and vision and the self-assessment
Analysis of the relationship between the participant’s self-assessment and measured VA showed that several of those who reported that their “vision was good” had impairments; this was also the case for hearing function. Among those who assessed their hearing impairment as severe, the standardized test showed that one woman had moderate hearing impairment and that among those who assessed their hearing as moderate, three men had light impairment.
The participants’ self-assessments of their hearing function correlated only weakly with the measured PTAV scores (Spearman’s ρ=0.478; P<0.01), and their self-assessments of their visual function were also only weakly correlated with the measured VA scores (Spearman’s ρ=0.24; P=0.02).
The effect of sensory impairments on verbal communication and reading in daily life
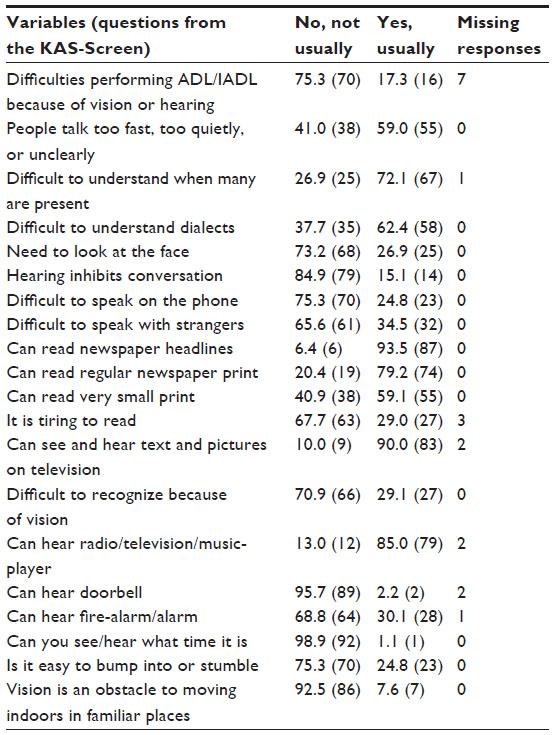
Communication, access to information, and reading are considered to be especially important for the 80+, as most of the participants in the present study remained at home most of the time and had limited contact with others. The results of the KAS-Screen interviews concerning verbal communication and access to information, where reading is included, are presented in Table 4.
 | Table 4 Self-assessed ability to communicate and read from the KAS-Screen, % (n) |
Most of the participants, 75% (n=70), had no difficulties performing ADL/IADL because of vision or hearing; however, 17% (n=16) did experience difficulties. In terms of hearing and verbal communication, 27% (n=25) needed to look at the face of the person they were talking with, 62% (n=58) found it difficult to understand dialects, and 59% (n=55) experienced difficulties understanding when people talked too rapidly, too quietly, or unclearly. When many people were present, 72% (n=67) found it difficult to understand speech. Most of them (94%; n=87) could read newsprint headlines, and 79% (n=74) could read regular-size newsprint. However, 41% could not read very small print, and nearly one-third (29%; n=27) of the participants found it tiring to read.
The correlations between PTAV for the better ear and the more detailed questions concerning hearing and verbal communication listed in Table 4 were all significant, with coefficients that ranged from 0.267 between PTAV and “difficult to hear and speak on the phone” to 0.511 between PTAV for the better ear and “difficult to understand when many were present”.
The correlations between VA for the better eye and the more detailed questions related to vision and reading were also significant, with coefficients ranging from −0.233 between VA and “it was tiring to read” to −0.406 between VA and “able to read regular-size newsprint”.
When the participants were asked about their last hearing or vision check, 17% reported they had their hearing and 57% had their vision checked within the last 2 years. Forty-eight percent reported they never had their hearing checked, and 4% had never checked their vision.
Discussion
The results of this study show that the majority of the elderly (80+) have severe sensory impairments. In the present cohort, 47% had moderate and 41% had light hearing loss (categorized according to the WHO definitions), and 40% were visually impaired and 55.7% were slightly visually impaired. Simultaneously, 50% and 53% of the cohort claimed that their hearing and visual functions, respectively, were good. One interpretation of this inconsistency may be that these individuals have adapted to the situation and do not find it worth mentioning as being difficult in relation to their daily life.29,30 Alternatively, they may simply be resigned to and have accepted their impairments as part of the aging process, or they may think, because of a lack of appropriate information, that it is not possible to correct their hearing and vision.31–33 However, it is possible that simple measures such as putting on more lights, maintaining hearing aids, and adapting hearing aids could help people with hearing and vision impairments. It is also possible that their quality of life would be improved if they simply had their ears rinsed or used their hearing aids more often.
The acceptance of an impairment situation and the willingness to report a hearing or vision loss are associated with greater knowledge, education, and income.29 However, it is also possible that the elderly adjust to their sensory impairments so that they do not notice them in their daily life. Facts and information about sensory loss in old age and where to get help, treatment, and rehabilitation may not be common knowledge,34 and it is vital that healthcare providers offer this information and help, particularly when the elderly person is already receiving home care. Such information may encourage the elderly to take actions to improve the situation. It has been documented that practical and emotional support can help the elderly in dealing with sensory impairments.34 From both a preventive and a health-promoting perspective, home care nurses in particular can play an important role by incorporating simple vision and hearing tests in their regular procedures.2,3
Another finding of this study was that older men are more likely than older women to have severe vision impairment or combined vision and hearing impairments. VA scores were better among the women than among the men (P=0.03). This could be because women of this age group have performed more indoor work, and hence were less exposed to blue light-hazard, or to the fact that men traditionally have had more industrial or outdoor careers that may lead to higher frequencies of incipient cataracts, early undiagnosed macular degeneration, and so on.35 Although Laitinen et al36 found no differences in sex in VAs for distance vision, they did report that a decrease in near vision was more common for men than for women. The mechanism underlying this difference in sex has yet to be elucidated, and further research is required.
The correlation between the VA scores and the participants’ self-assessments was surprisingly weak. It seems that the subjective standards of “good vision” might differ from the WHO definitions. The same was found for hearing, with some of those reporting that they have good hearing exhibiting PTAV scores that were in accordance with their self-assessments, whereas others had PTAV scores reflecting a severe hearing loss. Unlike the literature reviews of Guelich,37 Lyng and Svingen,1 and Torre et al,38 the present study found that simply asking the 80+ about their own hearing and vision impairments is not enough to hearing and visual impairment.
Difficulties pertaining to ADL as a result of vision and hearing impairments were reported by 17% of the participants. More than 20% reported they could not read regular-size newsprint, and nearly 68% reported finding it tiring to read. In many cases, this could be improved by changes such as better lighting, the use of spectacles with correct prescriptions, removal of earwax, or the use of appropriate hearing aids.37,39 Accurate information regarding what is possible and what is available with regard to help and physical aids34 is also important to provide. The situation becomes even more complicated when dual sensory impairment is present.40–42
When the 80+ have impairments, the mental reserves may be limited, particularly when they must repeat, remember, and concentrate in social situations.7,16 It is therefore crucial to optimize the hearing and visual functions among the elderly.
Limitations
Data from a larger randomized controlled trial study were used in this study, and the sample size was calculated to detect the effect of the changes in the lighting conditions at home. It could be claimed that strength also should have been calculated in relation to detect other contexts, such as the ORmale/female for dual sensory impairment.
The final number of participants was 93, not 100 as planned. Participant withdrawal was expected to be low because they were visited at home, which usually promotes participation. However, four of the sample died and three were admitted to hospital during the data collection period. The inclusion criterion for age was older than 80 years, and the mean age turned out to be 89 years, which is a plausible reason for the higher-than-expected dropout rate.
Although the eleven nurses and two nursing assistants who collected the data had been trained, the use of a relatively large number of data collectors may have adversely affected the consistency of the data. However, the analysis did not reveal any differences in the data within the total group or for the data collected by the nurses and the nursing assistants.
Conclusion
Many elderly home care patients were living with serious visual and hearing impairments. On average, men had significantly poorer vision than women, and dual sensory impairments were more common among men than women.
The patients’ self-assessments of their hearing and vision did not correlate strongly with their VA and PTAV scores. Asking the elderly about their overall hearing and visual function is not sufficient in detecting sensory impairment. Neither were more specific questions about what they could not hear and see adequate indicators of the patients’ hearing and vision problems. To detect hearing and vision impairments among elderly home care patients, standardized measurements of their hearing and vision are necessary.
Acknowledgment
We thank associate professor Tor Martin Kvikstad for valuable input into the manuscript.
Disclosure
The authors report no conflicts of interest in this work.
References
Lyng K, Svingen EM. Kartlegging av alvorlig, kombinert sansetap hos eldre [Screening of serious, combined impairment in elderly]. Nova Report 9 Evaluering av en sjekklistebasert screeningmetodikk. Norsk Institutt for forskning om oppvekst, velferd og aldring (NOVA). Oslo; 2001. Available from: http://norlag.nova.no/asset/4363/1/4363_1.pdf. Accessed: September 1, 2014. Norwegian. | |
Wallhagen MI, Pettengill E. Hearing impairment: significant but underassessed in primary care settings. J Gerontol Nurs. 2008;34(2):36–42. | |
Houde SC, Huff MH. Age-related vision loss in older adults. A challenge for gerontological nurses. J Gerontol Nurs. 2003;29(4):25–33. | |
Burmedi D, Becker S, Heyl V, Wahl H, Himmelsbach I. Emotional and social consequences of age-related low vision. Vis Impair Res. 2002;4(1):47–71. | |
Brody BL, Gamst AC, Williams RA, et al. Depression, visual acuity, comorbidity, and disability associated with age-related macular degeneration. Ophthalmology. 2001;108(10):1893–1900. | |
Chia EM, Mitchell P, Rochtchina E, Foran S, Golding M, Wang JJ. Association between vision and hearing impairments and their combined effects on quality of life. Arch Ophthalmol. 2006;124(10):1465–1470. | |
Grue EV. Vision and hearing impairment in old age [thesis]. Oslo: University of Oslo; 2010. | |
Young LJ, George J. Do guidelines improve the process and outcomes of care in delirium? Age Ageing. 2003;32(5):525–528. | |
Kvaal K, Halding AG, Kvigne K. Social provision and loneliness among older people suffering from chronic physical illness. A mixed-methods approach. Scand J Caring Sci. 2014;28(1):104–111. | |
Campbell VA, Crews JE, Moriarty DG, Zack MM, Blackman DK. Surveillance for sensory impairment, activity limitation, and health-related quality of life among older adults – United States, 1993–1997. MMWR CDC Surveill Summ. 1999;48(8):131–156. | |
Fagerström C, Persson H, Holst G, Hallberg IR. Determinants of feeling hindered by health problems in daily living at 60 years and above. Scand J Caring Sci. 2008;22(3):410–421. | |
Hietanen A, Era P, Henrichsen J, Rosenhall U, Sorri M, Heikkinen E. Hearing among 75-year-old people in three Nordic localities: a comparative study. Int J Audiol. 2005;44(9):500–508. | |
Raina P, Wong M, Massfeller H. The relationship between sensory impairment and functional independence among elderly. BMC Geriatr. 2004;4:3. | |
Black A, Wood J. Vision and falls. Clin Exp Optom. 2005;88(4):212–222. | |
Kulmala J, Viljanen A, Sipilä S, et al. Poor vision accompanied with other sensory impairments as a predictor of falls in older women. Age Ageing. 2009;38(2):162–167. | |
Heine C, Browning CJ. Communication and psychosocial consequences of sensory loss in older adults: overview and rehabilitation directions. Disabil Rehabil. 2002;24(15):763–773. | |
Mathers C, Smith A, Concha M. Global Burden of Hearing Loss in the Year 2000. Global Burden of Disease. Geneva: World Health Organization; 2000. Available from: http://www.who.int/healthinfo/statistics/bod_hearingloss.pdf. Accessed: February 11, 2014. | |
Solheim J. Hearing loss in the elderly: consequences of hearing loss and considerations for audiological rehabilitation [thesis]. Oslo: University of Oslo; 2011. | |
Biering-Sørensen M, Christensen B, Sørensen MS, Parving A. The Valby Project: a survey of hearing in the elderly > or = 80 years of age not provided with hearing aids. Scand Audiol. 1992;6(1):33–41. | |
Brooks DN, Hallam RS. Attitudes to hearing difficulty and hearing aids and the outcome of audiological rehabilitation. Br J Audiol. 1998;32(4):217–226. | |
Erler SF, Garstecki DC. Hearing loss- and hearing aid-related stigma: perceptions of women with age-normal hearing. Am J Audiol. Dec 2002;11(2):83–91. | |
Meister H, Walger M, Brehmer D, von Wedel UC, von Wedel H. The relationship between pre-fitting expectations and willingness to use hearing aids. Int J Audiol. 2008;47(4):153–159. | |
McGraw PV, Winn B. Glasgow Acuity Cards: a new test for the measurement of letter acuity in children. Ophthalmic Physiol Opt. 1993;13(4):400–404. | |
McGraw PV, Winn B, Gray LS, Elliott DB. Improving the reliability of visual acuity measures in young children. Ophthalmic Physiol Opt. 2000;20(3):173–184. | |
van der Pols JC, Bates CJ, McGraw PV, et al. Visual acuity measurements in a national sample of British elderly people. Br J Ophthalmol. 2000;84(2):165–170. | |
Bergman B, Rosenhall U. Vision and hearing in old age. Scand Audiol. 2001;30(4):255–263. | |
World Health Organization. International Classification of Impairments, Disabilities, and Handicaps: A Manual of Classification Relating to the Consequences Of Disease. Geneva: World Health Organization; 1994. Available from: https://extranet.who.int/iris/restricted/bitstream/10665/41003/1/9241541261_eng.pdf. Accessed February 12, 2014. | |
Polit DF, Beck CT. Nursing Research: Generating and Assessing Evidence for Nursing Practice. Philadelphia, PA: Wolters Kluwer Health; 2012. | |
Brennan M, Bally SJ. Psychosocial adaptations to dual sensory loss in middle and late adulthood. Trends Amplif. 2007;11(4):281–300. | |
McWilliam CL, Ward-Griffin C, Sweetland D, Sutherland C, O’Halloran L. The experience of empowerment in in-home services delivery. Home Health Care Serv Q. 20020(4):49–71. | |
Tambs K. Moderate effects of hearing loss on mental health and subjective well-being: results from the Nord-Trøndelag Hearing Loss Study. Psychosom Med. 2004;66(5):776–782. | |
Gussekloo J, de Bont LE, von Faber M, et al. Auditory rehabilitation of older people from the general population – the Leiden 85-plus study. Br J Gen Pract. 2003;53(492):536–540. | |
Hickson L, Worrall L, Scarinci N. Measuring outcomes of a communication program for older people with hearing impairment using the International Outcome Inventory. Int J Audiol. 2006;45(4):238–246. | |
Tannenbaum C, Mayo N, Ducharme F. Older women’s health priorities and perceptions of care delivery: results of the WOW health survey. CMAJ. 2005;173(2):153–159. | |
Algvere PV, Marshall J, Seregard S. Age-related maculopathy and the impact of blue light hazard. Acta Ophthalmol Scand. 2006;84(1):4–15. | |
Laitinen A, Koskinen S, Härkänen T, Reunanen A, Laatikainen L, Aromaa A. A nationwide population-based survey on visual acuity, near vision, and self-reported visual function in the adult population in Finland. Ophthalmology. 2005;112(12):2227–2237. | |
Guelich MM. Prevention of falls in the elderly: a literature review. Topics Geriatr Rehabil. 1999;75(1):15–25. | |
Torre P, Moyer CJ, Haro NR. The accuracy of self-reported hearing loss in older Latino-American adults. Int J Audiol. 2006;45(10):559–562. | |
Erkal S. Home Safety, Safe Behaviors of Elderly People, and Fall Accidents at Home. Educ Gerontol. 2010;36(12):1051–1064. | |
Tolson D, Swan I, Knussen C. Hearing disability: a source of distress for older people and carers. Br J Nurs. 2002;11(15):1021–1025. | |
Smith SL, Bennett LW, Wilson RH. Prevalence and characteristics of dual sensory impairment (hearing and vision) in a veteran population. J Rehabil Res Dev. 2002;45(4):597–609. | |
Saunders GH, Echt KV. An overview of dual sensory impairment in older adults: perspectives for rehabilitation. Trends Amplif. 2007;11(4):243–258. |
 © 2014 The Author(s). This work is published and licensed by Dove Medical Press Limited. The full terms of this license are available at https://www.dovepress.com/terms.php and incorporate the Creative Commons Attribution - Non Commercial (unported, v3.0) License.
By accessing the work you hereby accept the Terms. Non-commercial uses of the work are permitted without any further permission from Dove Medical Press Limited, provided the work is properly attributed. For permission for commercial use of this work, please see paragraphs 4.2 and 5 of our Terms.
© 2014 The Author(s). This work is published and licensed by Dove Medical Press Limited. The full terms of this license are available at https://www.dovepress.com/terms.php and incorporate the Creative Commons Attribution - Non Commercial (unported, v3.0) License.
By accessing the work you hereby accept the Terms. Non-commercial uses of the work are permitted without any further permission from Dove Medical Press Limited, provided the work is properly attributed. For permission for commercial use of this work, please see paragraphs 4.2 and 5 of our Terms.