")
Back to Journals » International Journal of Nanomedicine » Volume 13
Sensitive determination of dopamine levels via surface-enhanced Raman scattering of Ag nanoparticle dimers
Authors Yu X, He X, Yang T, Zhao L, Chen Q, Zhang S , Chen J, Xu J
Received 13 November 2017
Accepted for publication 15 February 2018
Published 17 April 2018 Volume 2018:13 Pages 2337—2347
DOI https://doi.org/10.2147/IJN.S156932
Checked for plagiarism Yes
Review by Single anonymous peer review
Peer reviewer comments 2
Editor who approved publication: Professor Lei Yang
Xiantong Yu,1 XiaoXiao He,1 Taiqun Yang,1 Litao Zhao,1 Qichen Chen,1 Sanjun Zhang,1,2 Jinquan Chen,1 Jianhua Xu1,2
1State Key Laboratory of Precision Spectroscopy, East China Normal University, Shanghai, China; 2Collaborative Innovation Center of Extreme Optics, Shanxi University, Taiyuan, Shanxi, China
Background: Dopamine (DA) is an important neurotransmitter in the hypothalamus and pituitary gland, which can produce a direct influence on mammals’ emotions in midbrain. Additionally, the level of DA is highly related with some important neurologic diseases such as schizophrenia, Parkinson, and Huntington’s diseases, etc. In light of the important roles that DA plays in the disease modulation, it is of considerable significance to develop a sensitive and reproducible approach for monitoring DA.
Purpose: The objective of this study was to develop an efficient approach to quantitatively monitor the level of DA using Ag nanoparticle (NP) dimers and enhanced Raman spectroscopy.
Methods: Ag NP dimers were synthesized for the sensitive detection of DA via surface-enhanced Raman scattering (SERS). Citrate was used as both the capping agent of NPs and sensing agent to DA, which is self-assembled on the surface of Ag NP dimers by reacting with the surface carboxyl group to form a stable amide bond. To improve accuracy and precision, the multiplicative effects model for surface-enhanced Raman spectroscopy was utilized to analyze the SERS assays.
Results: A low limits of detection (LOD) of 20 pM and a wide linear response range from 30 pM to 300 nM were obtained for DA quantitative detection. The SERS enhancement factor was theoretically valued at approximately 107 by discrete dipole approximation. DA was self-assembled on the citrate capped surface of Ag NPs dimers through the amide bond. The adsorption energy was estimated to be 256 KJ/mol using the Langmuir isotherm model. The density functional theory was used to simulate the spectral characteristics of SERS during the adsorption of DA on the surface of the Ag dimers. Furthermore, to improve the accuracy and precision of quantitative analysis of SERS assays with a multiplicative effects model for surface-enhanced Raman spectroscopy.
Conclusion: A LOD of 20 pM DA-level was obtained, and the linear response ranged from 30 pM to 300 nM for quantitative DA detection. The absolute relative percentage error was 4.22% between the real and predicted DA concentrations. This detection scheme is expected to have good applications in the prevention and diagnosis of certain diseases caused by disorders in the DA level.
Keywords: surface-enhanced Raman scattering, SERS, multiplicative effects model for surface-enhanced Raman spectroscopy, MEMSERS, dopamine detection, Ag NP dimers
Introduction
Dopamine (DA) is an important neurotransmitter due to its function in the hypothalamus and pituitary gland, directly affecting a person’s emotions in the midbrain.1 Abnormal DA transmission is associated with neurologic disorders such as schizophrenia, Parkinson’s, and Huntington’s disease.2 Meanwhile, normal DA concentration in the extracellular fluid of the central nervous system is very low (0.01–1 μM). Therefore, the sensitive and quantitative determination of DA concentration is necessary for the molecular diagnostics of diseases, the design of therapeutics, and the evaluation of drug efficacy. Various methods have been developed for the detection of DA, including electrochemistry,3–5 chromatography,6,7 fluorescence,8–10 and surface-enhanced Raman scattering (SERS).11–13 However, electrochemical technology has some limitations related to the specificity and stability induced by the interference of analogs, such as ascorbic acid and phenethylamine (PEA).6,7 Furthermore, conventional chromatographic and fluorescence methods require a long preparation time and complicated procedures.8–10 In contrast, the SERS approach has a potential of providing both low limits of detection (LOD) and high selectivity.14–16
One of the key issues in SERS is to determine how to obtain a high SERS enhancement factor (EF). It has been generally accepted that SERS enhancement may come from both physical enhancement (electric field) and chemical enhancement.17 Physical enhancement is mainly achieved through fabricating typical nanostructures, in order to obtain higher local electric field enhancements. Chemical enhancement is achieved through the interactions between adsorbed molecules and the metal surface. The recent development of nanotechnology has made it possible to fabricate metal nanostructures with a highly controlled morphology.18 By introducing abundant nanogaps, nanobridges, sharp protrusions, or crevices into the nanostructures, SERS signals with high EFs of 107–1014, as well as improved uniformity and reproducibility, have been obtained.17,19 In recent years, various nanostructures have been used for SERS detection in DA molecules.20 An LOD of 1.05 pM DA level has been obtained by using an Ag/MIL-101 nanostructure,11 an LOD of 0.1 mM by using flower-like gold nanostructures electrodeposited on indium tin oxide glass,13,20 an LOD of 1 nM with graphene–Au nanopyramid heterostructure,13 and an LOD of 0.006 pM has been achieved with Au@Ag nanorod dimers.18 Meanwhile, efforts have been made for the quantitative analysis of DA. For example, Ag–Fe3O4 nanocomposites possessing an internal reference were fabricated and used to quantitatively detect DA, and the LOD reached 10 μM.19 Kasera et al quantitatively analyzed DA using the partial least squares regression method, achieving an LOD of 1 nM.21 Although significant progress has been made for DA detection, the accurate quantification analysis of DA levels has not yet obtained the desired detection interval. Therefore, the high accuracy and sensitive quantitative analysis of DA are still in urgent need. For this purpose, we used Ag nanoparticles (NPs) to fabricate Ag NP dimers as SERS biotags for the sensitive quantification detection of DA. In this paper, an LOD of 20 pM and a wide linear response range from 30 pM to 300 nM were obtained for DA quantitative detection. The SERS EF was theoretically estimated to be ~107 by discrete dipole approximation (DDA). DA was self-assembled on the citrate-capped surface of Ag NP dimers through the amide bond. The adsorption energy was estimated to be 256 kJ/mol using the Langmuir isotherm model. The density functional theory (DFT) was used to simulate the spectral characteristics of SERS during the adsorption of DA on the surface of the Ag NP dimers. Furthermore, this study attempted to improve the accuracy and precision of the quantitative analysis of SERS assays with a multiplicative effects model for surface-enhanced Raman spectroscopy (MEMSERS).22,23 We expect this research to provide new insights into the sensitive and fast quantitative analysis of DA.
Materials and methods
Reagents
The reagents were used as received without further purification. Nile blue A perchlorate (95%), sodium citrate tribasic dihydrate (≥99.0%), dopamine (DA) hydrochloride, PEA (≥99%), tryptophan (Trp; ≥99%), tyrosine (Tyr; ≥99%), levodopa (L-dopa; ≥98%), bovine serum albumin (BSA; ≥98%) polyvinylpyrrolidone (PVP; average molecular weight=40,000), and silver nitrate (AgNO3; 99.5+%) were obtained from Sigma. Hexamethylenediamine (HMD, 99.5+%) was obtained from Acros Organics (Geel, Belgium). The molecular structures of the main reagents required for the experiment are shown in Figure 1. Ultrapure deionized water with a resistivity of 18.20 MΩ·cm was used throughout the experiment.
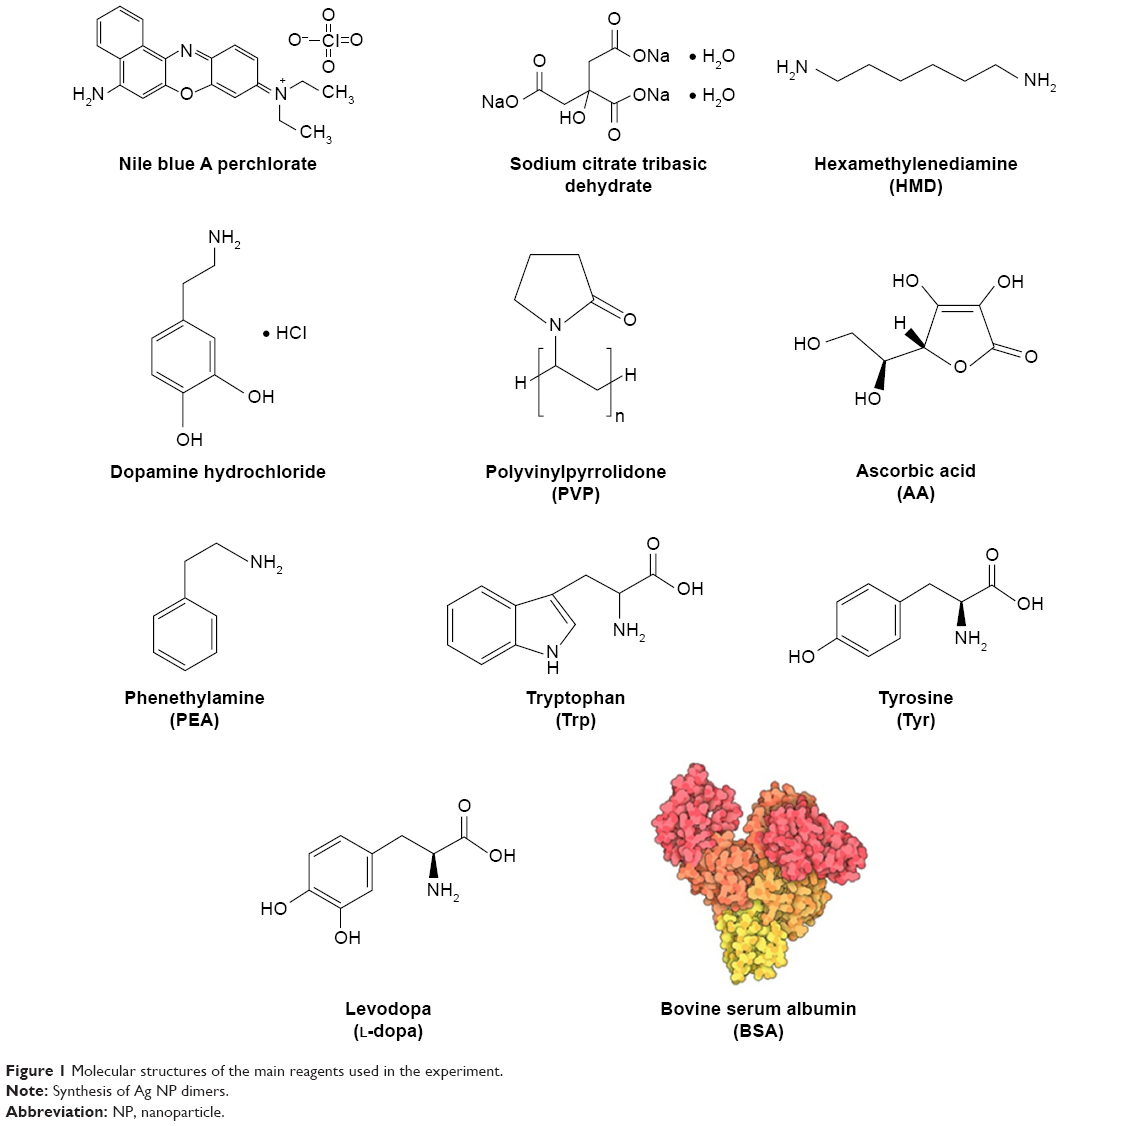 | Figure 1 Molecular structures of the main reagents used in the experiment. |
The silver colloid was synthesized according to the protocol process of Lee and Meise.24 Briefly, 36 mg of AgNO3 was dissolved with 200 mL of ultrapure deionized water in a 250 mL one-neck round bottle flask under vigorous stirring and was brought to boil. Then, 4 mL of 1% sodium citrate was quickly added. The mixture was kept at the boiling temperature for ~90 minutes until the color turned dark green/gray. The Ag NPs synthesized by this method have carboxyl groups on the surface, which play an important role in our experiment. The stability of Ag NPs prepared by this method is not very superior; however, we used the freshly prepared samples each time in the experiment. The Ag NP dimers were synthesized according to the protocol in a reference.29 Aliquots of the colloid were taken and centrifuged at 1,800×g to remove the small particles. The yellow supernatant was discarded, and the pellet was resuspended in ultrapure deionized water and diluted until the absorbance at 416 nm was 0.4 for the 0.1 mm path length. The DA-infused SERS samples were prepared by adding 30 μL phosphate buffer (10 mM, pH 6.5) to 1 mL resuspended Ag NPs in every sample and then adding 60 μL HMD (0.4 mg/mL in deionized water, pH 4.0) with 2 minutes to wait. Furthermore, 40 μL 1% (m/v) PVP was added in ultrapure deionized water, followed by the addition of 1 mL ultrapure deionized water with 5 minutes to wait. The use of PVP significantly improved the stability of the Ag NP dimers. In our experiments, the ultraviolet (UV)–vis absorption spectra of Ag NP dimers did not change within 1 week, showing a good stability. DA was allowed to infuse into the SERS biotags for a minimum of 4 hours prior to the SERS measurement. As shown in Figure 2, the Ag NPs were first modified by citric acid (Figure 2A), and Ag NP dimers could be generated by the addition of HMD (Figure 2B). As the DA molecules were adsorbed on Ag NPs surface by chemical adsorption (Figure 2C), the detection level of DA could be monitored by measuring the SERS signal induced by Ag NP dimers (Figure 2D).
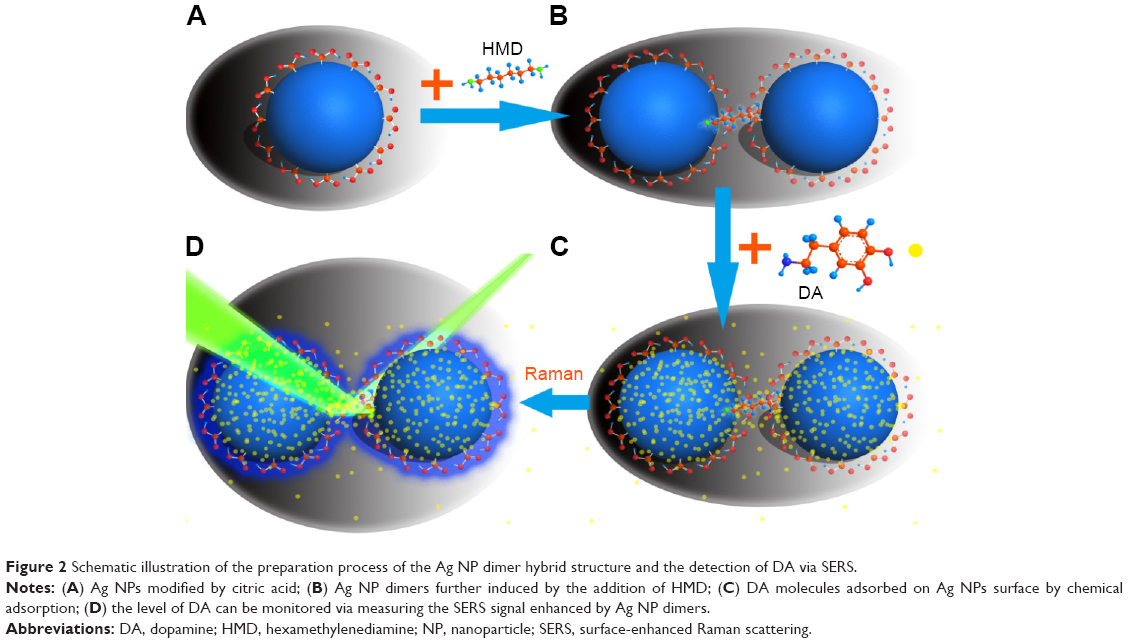 | Figure 2 Schematic illustration of the preparation process of the Ag NP dimer hybrid structure and the detection of DA via SERS. |
Apparatus
The absorption spectra were obtained with a two-beam UV-Vis spectrometer (TU-1901; Persee, Beijing, China). The transmission electron microscopy images of the SERS substrate were taken by an HT 7700 system (Hitachi Ltd., Tokyo, Japan) at 100 kV. The Fourier Transform Infrared (FT-IR) spectra were acquired by a NEXUS-670 system (Nocilet, Madison, WI, USA). The SERS spectra were obtained through a confocal Raman microscopy system (Jobin Yvon T64000; Horiba, Paris, France) equipped with a highly sensitive liquid N2-cooled charge-coupled detector. A 600 g/mm holographic grating blazed at 500 nm was used with a spectral resolution of 2 cm−1. The excitation wavelength was 532 nm, and was supplied with a single longitudinal solid laser (MSL-III-532 nm, line width <10−5 nm; CNI laser, Changchun, China). To avoid damage to the samples, an output power of 30 mW was used for all samples. A band-pass interference filter (LL01-532-25; Semrock, Rochester, NY, USA) was applied to prevent background emission from the laser source, and a long-pass Raman edge filter (Semrock, LP03-532RE-25) was also applied to eliminate the laser line. A water immersion microscope objective (100×, numerical aperture =0.95; Olympus) was used for collection of the scattering signals. The Raman microscopy system was calibrated using the silicon line with a Raman band centered at 520.7 cm−1. The original Raman spectra were preprocessed by LabSpec software.
Measurement
Five hundred microliters of Ag NP dimer was fist mixed with 1 mL phosphate buffer (10 mM, pH 6.5). After gentle shaking for several minutes, 1 mL DA at various concentrations was added to the solutions respectively, resulting in the final concentrations from 10 pM to 1.5 μM. The solutions were then incubated for 4 hours at room temperature. Five interfering chemicals (PEA, Trp, Tyr,L-dopa, and BSA) were tested under the same conditions for the selective experiment. The concentration of these substances was 1 μM. All the samples were evenly stirred before the experiments and were stored in the well plate for SERS testing.
Simulation methods and theory
DFT was used to calculate the molecular Raman frequencies of DA molecules. This was performed in Gaussian 09 using a combination of the B3LYP hybrid exchange correlation function along with the LanL2DZ basis set.25,26 The molecular geometry was optimized prior to the theoretical calculation.27 The SERS spectra were also calculated with the Gaussian 09 package using the combination of the B3LYP hybrid exchange correlation function with the LanL2DZ basis set.28 A scaling factor of 0.981 for vibrational frequencies was used throughout the experiment.
In order to estimate the SERS EF from the electromagnetic enhancement, the local electromagnetic field distribution of the individual Ag NP and Ag NP dimer was calculated by DDA.29 The refractive index of silver at an excitation wavelength of 532 nm was obtained from the handbook.30 We chose an array of closely spaced dipoles to replace a continuum target under the influence of the electric field of excitation light. The excitation light was a plane wave along the z-axis, and the electric field was polarized along the x-axis. While calculating the electric field of the dimer, arraying along the x-axis was assumed, such that the longitudinal modes were excited. The field enhancement was obtained by calculating the ratio of the enhanced field to the incident field. The computation was performed using the widely used DDA code, DDSCAT 7.3.29
A Langmuir isotherm model was used to describe the relationship between the fractional surface coverage (θ) and the concentration(CS) of analyte molecules in the solution:14
|
|

The fraction of surface sites occupied by analyte molecules, θ, is calculated from the SERS intensity by the following expression:
|
|

where ICs is the SERS peak area of an analyte-specific Raman line at an analyte molar concentration of CS and Imax is the SERS peak area of the same Raman line when a complete adsorption is formed. Equations 1 and 2 were combined.
|
|
Equation 3 was used to fit the Raman peak area vs analyte concentration data with Imax and the equilibrium constant, K, as the fitting parameters. The equilibrium constant is related to the Gibbs free energy of adsorption (ΔG) as follows:14
| (4) |

where R is the ideal gas constant and T is the temperature.
MEMSERS was used for the subsequent quantitative analysis:22,23
| (5) |
where  is the SERS spectrum of the Kth sample; CK,j is the concentration of the jth chemical component in the Kth calibration sample;
  represents the molecular scattering properties of the jth chemical component; the multiplicative parameter qK explicitly accounts for the multiplicative confounding effects on SERS intensities caused by changes in variables other than the concentrations of analytes in the Kth calibration samples, such as the physical properties of enhancing substrates, and the intensity and alignment/focusing of the laser excitation source;
  is a composite term that represents background interference(s) and the non-multiplicative effects caused by variations in the physical properties of the enhancing substrates on the Kth sample. The multiplicative parameters qK (K=1, 2, …, K) for K calibration samples in the above MEMSERS model can be estimated from their SERS spectra by the modified optical path length estimation and correction method.19 In this study, it was assumed that the first chemical component in Equation 5 was the analyte of interest. Hence, the following two calibration models can then be built by multivariate linear calibration methods such as partial least squares regression.
| (6) |
Here,  , and diag
  denotes a diagonal matrix with the diagonal elements of
  ; and
; and  is a column vector with its elements equal to unity. After the estimation of the model parameters α1, α2,
 , and
, and  , the concentration ctest, j of the target analyte in any test sample can be determined from its measured SERS spectrum
  . The confounding multiplicative effects of the physical properties of enhancing substrates and the intensity and alignment/focusing of the laser excitation source on the quantitative results have been readily corrected:
|
|
Results and discussion
Ag NP dimers were fabricated by the aggregation of citrate-capped Ag NPs upon HMD linkers (Figure 2). The degree of aggregation was adjusted by the dosage of HMD, and the aggregation was halted by the addition of PVP, which improved the stability of the Ag NP dimers. Moreover, the porous structure permitted DA molecules to penetrate the PVP and adsorb on the surface of Ag NPs. As shown in Figure 3A inset and Figure 3B and C, the obtained Ag NPs induced by HMD are dimers and small clusters. Although the shape of the Ag particles is not very regular, it does not affect our experiments with SERS. Figure 3A shows that the extinction spectra of Ag NPs and Ag NP dimers have a peak of ~416 nm, and the peak of the Ag dimer is slightly blue shifted. Compared with Ag NPs, the extinction spectrum of dimers presents a larger full width at half maximum and reduced absorption intensity.
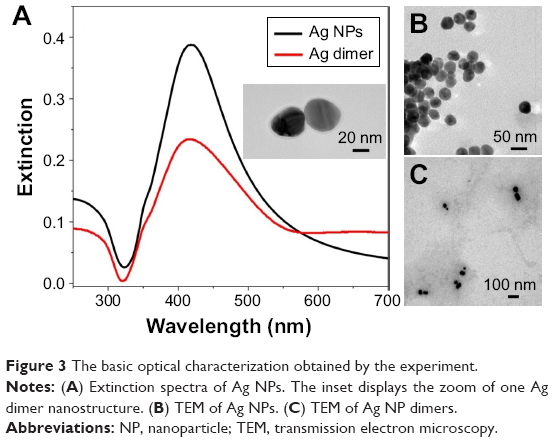 | Figure 3 The basic optical characterization obtained by the experiment. |
In order to investigate the SERS enhancement mechanism, DDA was employed to study the near-field enhancement and extinction spectrum of the dimers (Figure 4). According to the simulation, when Ag NPs form a dimer, the extinction peak is slightly blue shifted by ~4 nm, which is from 421 to 417 nm, and the intensity of absorption is decreased (Figure 4B), which was consistent with the experimental results (Figure 3A). The electrical field EF (EF=E/E0) increased from 8.2 to 380 for the horizontal polarization (Figure 4A), which corresponds to a SERS intensity enhancement of approximately seven orders of magnitude. The local field distribution was uneven around the Ag NP dimer. The most intense area of the local electric field is known as “hot spots”. This difference can be resolved by assuming that the Ag NP dimer substrate possesses two distinct regions with different SERS EFs for the DA molecules (Figure 4B inset): a high SERS active region a located at the gap of the Ag NP dimer and a normal SERS active region b in the vicinity of Ag NPs.31 As DA molecules are adsorbed on the surface, only the molecules in region a produced high SERS. The SERS intensity produced at region b is comparable to that from individual Ag NPs, which are orders of magnitude lower than those produced at region a.
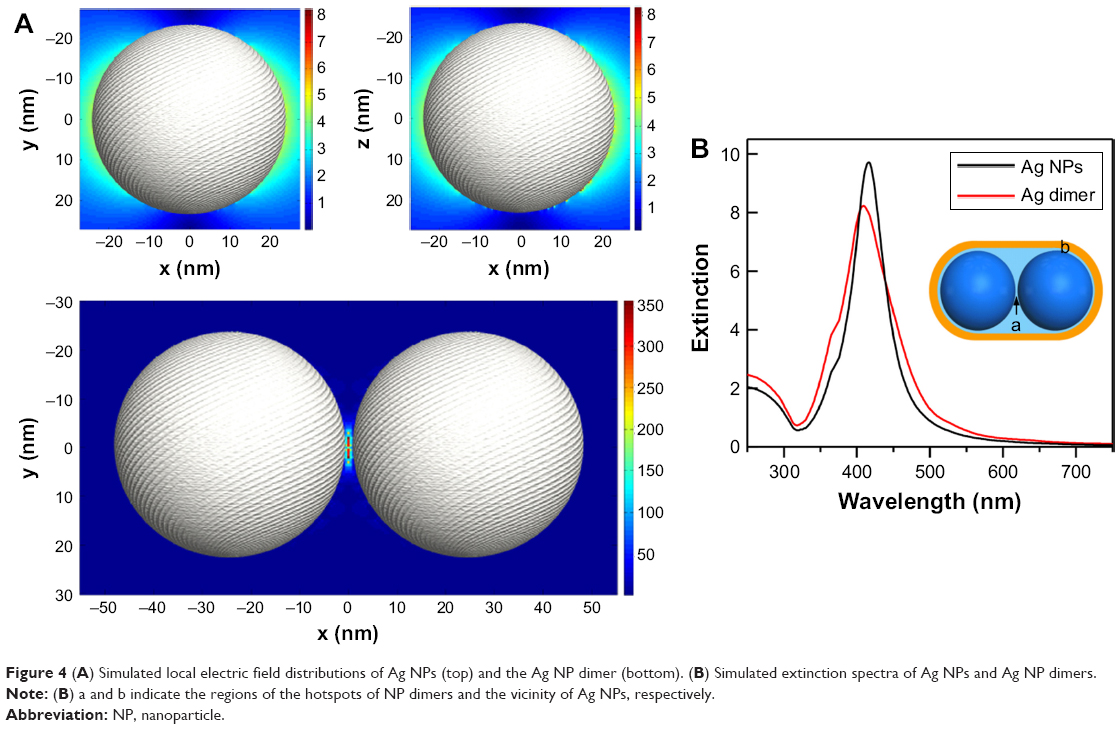 | Figure 4 (A) Simulated local electric field distributions of Ag NPs (top) and the Ag NP dimer (bottom). (B) Simulated extinction spectra of Ag NPs and Ag NP dimers. |
DA was infused into the Ag NP dimers in aqueous solutions with various DA concentrations (ranging from 20 pM to 1.5 μM) for ~4 hours at room temperature. In order to avoid DA aggregation, DA solutions were freshly prepared prior to each experiment. These DA molecules infiltrate these regions either in the vicinity of Ag NPs (region b) or (most importantly) the hotspots of NP dimers (region a), whose electromagnetic field is dominantly responsible for the SERS signal. The number of DA molecules adsorbed on the Ag NP surface at equilibrium situations depends both on citric on the NP surface and their equilibrium concentration in the solution. Figure 5A shows the SERS spectrum of DA with several characteristic peaks (605, 767, 1,115, 1,183, 1,293, 1,349, 1,493, 1,558, and 1,628 cm−1). It is worth noting that, no remarkable Raman background was observed for citrate-templated Ag NPs, as shown in Figure 5B.
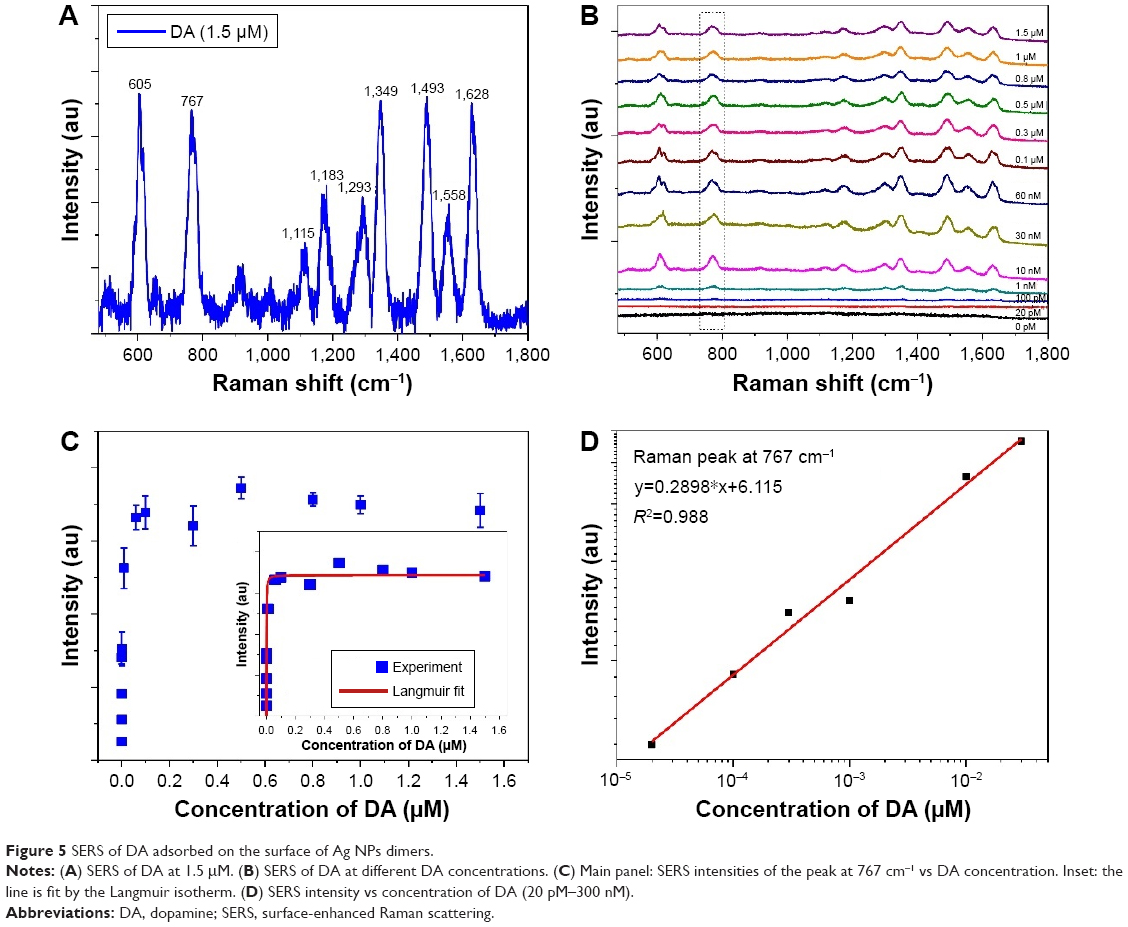 | Figure 5 SERS of DA adsorbed on the surface of Ag NPs dimers. |
Figure 5C shows the Raman intensity at 767 cm−1 as a function of the DA concentration. The selection of this position as the characteristic peak is due to its peak shape, which is suitable for our subsequent integration and quantitative analysis. The data are fitted to a Langmuir isotherm (Equation 3). The equilibrium constant K was determined to be 1.79×10⁹, corresponding to a free energy of adsorption of 256 kJ/mol at room temperature (Equation 4). The regression coefficient (R2) is 0.8. It is generally known that the free energy of adsorption of <40 kJ/mol came from the physical adsorption process and that of the typical 40–400 kJ/mol came from the chemical adsorption process.32 The large free energy of adsorption indicates that DA molecules are adsorbed on Ag NPs through chemical adsorption. This strategy has various advantages. First, compared with the weak physical adsorption by the van der Waals force or electrostatic force, stable chemical bonds make DA molecules solidly adsorb on the surface of NPs. Second, the high free energy of adsorption can make the molecules to adsorb more on the surface of the Ag NPs dimer, which will be more favorable for the sensitive detection of DA molecules. It affords the highest SERS EF and greatly benefits the ultrasensitive detection of DA molecules. As shown in Figure 5C, the adsorption isotherms can be divided into two sections. At low concentrations from 20 pM to 300 nM, the isotherms present a linear relationship between the SERS intensity and DA concentrations, as zoomed in Figure 5D. The regression coefficient (R2) is 0.98 and the fitted linear equation is y=0.2898x+6.115. An LOD of 20 pM was obtained. These SERS intensities remain constant for a DA concentration above 300 nM because the adsorption of DA on Ag NPs is saturated.
The chemical adsorption is attributed to the reaction between DA and the surface citrate. The citrate molecules serve both as the capping agent of Ag NPs and the sensing agent of DA. The positively charged DA molecules can effectively anchor on the negatively charged citrate-capped Ag NP surface via electrostatic interaction. Meanwhile, the primary amine in pyrocatechol rapidly reacts with the carboxyl group of citrate to form a stable amide bond.33 The formation of the stable amide bond was also seen in the SERS spectra of DA. As shown in Figure 6, curve a shows the normal Raman spectrum of DA molecules measured with DA powder and curve b shows the simulation with DFT. On comparing the experimental and theoretical Raman spectra, the spectrum of the DA powder only shows a double peak at 750 cm−1, corresponding to the in-plane bending vibration arising from the benzene ring. The characteristic Raman peaks of the benzene ring between 1,300 and 1,700 cm−1 disappear because the π–π stacking in the DA powder attenuates the vibration of the benzene group.17 DFT simulations indicate that a Raman peak at ~1,490 cm−1 appears after the formation of the amide bond (curve c), and its vibration is enhanced when the amide bond is located in the vicinity of Ag (curve d). The peak at ~1,490 cm−1 is conspicuous on the experimental SERS spectrum of DA (curve e), showing that the DA molecules are adsorbed on the Ag NPs through the chemical bonding between amino and carboxyl groups. The band at ~1,115 cm−1 were then ascribed to in-plane −OH bending vibration arising from the cationic. In addition, the peak at 1,628 cm−1 is the result of hydroxyl scaling. The band at 1,349 cm−1 is from the out-of-plane C−H bending vibration. The band at 1,293 cm−1 is from the benzene ring scaling in the DA molecule. The bands at 767 and 1,558 cm−1 have been ascribed to the in-plane bending vibration arising from the benzene ring.
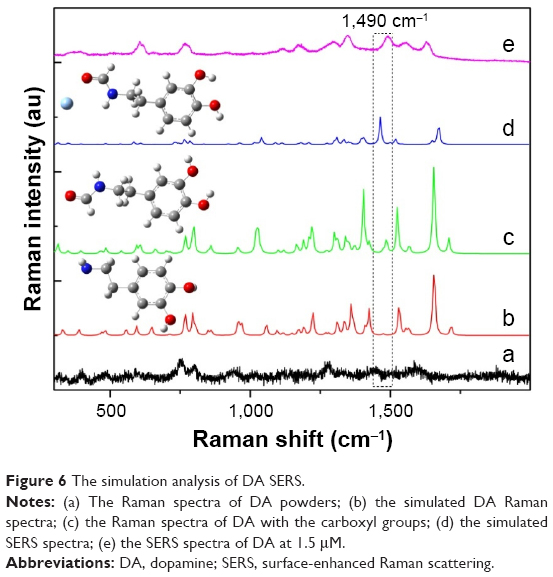 | Figure 6 The simulation analysis of DA SERS. |
FT-IR analysis was further carried out to verify the formation of the amide bond in the reaction. As shown in Figure 7, after reaction with Ag NP dimers, several new peaks appeared in the spectra compared with those of fresh DA. According to Pande et al,27 peaks at 1,610 cm−1 could be ascribed to the bending vibration of C=(N−H) in fresh DA (gray line), while those at 1,410 cm−1 could be assigned to the formation of the amide bond. When the amide bond was located in the vicinity of Ag (blue line), peaks at 1,610 cm−1 disappeared and at 1,410 cm−1 appeared, which further confirmed the formation of the amide bond.
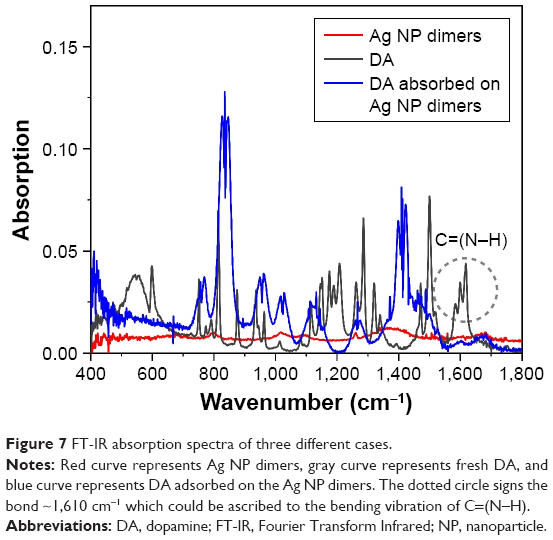 | Figure 7 FT-IR absorption spectra of three different cases. |
Quantitative analysis of SERS
SERS has advantages of high sensitivity and fingerprint detection of molecules. However, the relatively low stability and reproducibility of SERS signals restrict its application in quantitative analysis. MEMSERS has been recently proposed to improve quantitative analysis by taking into consideration various experimental factors, such as the properties of a SERS substrate, excitation laser power, the focus position, and SERS signal strength.22,23
The quantitative performance of the MEMSERS model may be evaluated in terms of absolute relative percentage error (ARPE):
|
|
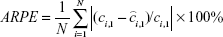
where ci, 1 and  are the actual and predicted concentrations of the analyte of interest in the ith test sample, respectively and N is the number of test samples.
SERS spectra in the range of 300-2,000 cm−1 were selected for subsequent quantitative analysis. Figure 8A shows the qK factor used in the MEMSERS model, according to Equation 5. It is evident that different calibration samples generally have different multiplicative parameter values (qK) and vary in the range of 1-7.67. These results demonstrate that the presence of significant multiplicative confounding effects in the Raman spectral data and the introduction of the multiplicative parameter, qK, in Equation 5 is theoretically and practically relevant. Otherwise, the multiplicative parameter values (qK) calculated by modified optical path length estimation and correction method for the calibration samples would vary within a narrow range and would also be quite close to 1. According to this factor, the predicted DA concentration was compared with the real concentration in Figure 8B. A moderate coincidence for ARPE was 4.2% between the predicted and real DA concentrations, which is lower than the generally accepted ARPE value of 10%. This remarkable improvement further confirmed the effectiveness of the scheme on the quantitative analysis of DA.
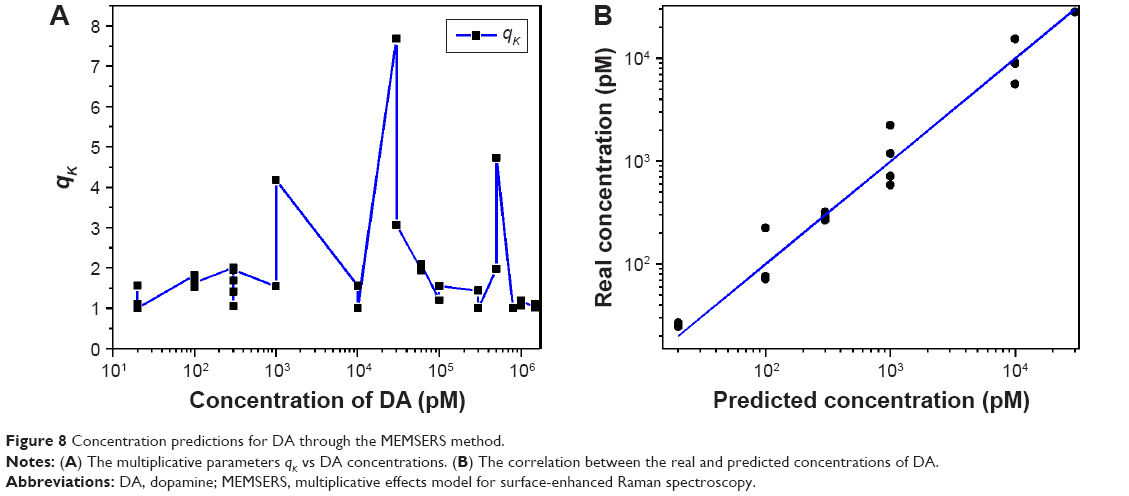 | Figure 8 Concentration predictions for DA through the MEMSERS method. |
Selectivity for DA detection
To evaluate the applicability and selectivity of this method, five interfering chemicals (PEA, Trp, Tyr, L-dopa, and BSA) were tested under the same conditions. The DA concentration was 300 nM, and the concentration of other substances was 1 μM. The SERS intensity of the peak at 767 cm−1 of the Ag NP dimer sensor containing 300 nM DA was ~5-fold higher than those of five substances (Figure 9). It needs to be emphasized that the SERS intensity showed no obvious enhancement with these interfering substances even at the high concentration. To further confirm the specificity of this method, these five interfering chemicals were mixed as the substrate for DA detection.18 The results revealed that the interfering chemicals had no influence on DA detection. Therefore, this method has an excellent selectivity for the detection of DA.
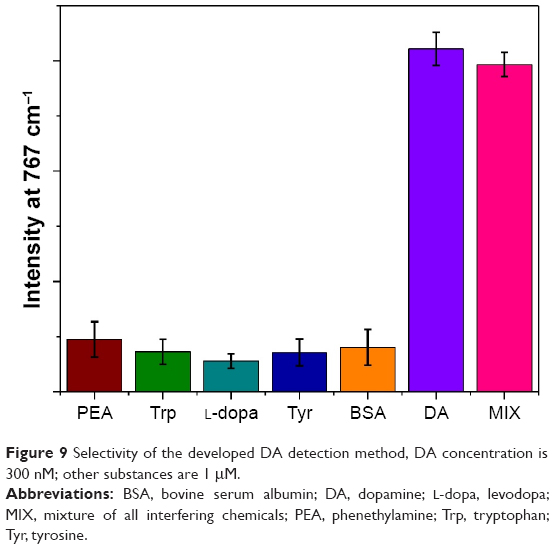 | Figure 9 Selectivity of the developed DA detection method, DA concentration is 300 nM; other substances are 1 μM. |
Conclusion
We synthesized Ag NP dimers for the sensitive SERS detection of DA molecules. The PVP-stabilized Ag NP dimers exhibited a high stability and high SERS EF. The SERS enhancement and detection mechanisms were exhaustively studied via experimental measurements (including Raman spectroscopy, UV-Vis spectroscopy, FT-IR, and transmission electron microscopy), as well as theoretical simulations (DFT and DDA). DA was self-assembled on the surface of the Ag NP dimers through the stable amide bond, where the surface citrates serve as both the capping agent of Ag NPs and the sensing agent of DA molecules. The free adsorption energy was found to be 256 kJ/mol by fitting SERS intensity to a Langmuir adsorption model. An LOD of 20 pM and linear response range from 20 pM to 300 nM were obtained. By using the MEMSERS model for quantitative DA analysis, the ARPE was 4.2% between the real and predicted DA concentrations. The experiments in real samples confirmed that this method had a good selectivity for the DA detection. These advantages make this method quite promising for the noninvasive and real-time detection of DA for certain clinical applications.
Acknowledgments
This work was partly supported by the National Science Foundation of China (Nos. 6141001145, 11674101, and 11774096), the Science and Technology Commission of Shanghai Municipality (15520711500, 15ZR1411700, and 15ZR1410100), and the Program of Introducing Talents of Discipline to Universities (B12024).
Disclosure
The authors report no conflicts of interest in this work.
References
Gubernator NG, Zhang H, Staal RGW, Mosharov EV. Fluorescent false neurotransmitters visualize dopamine release from individual presynaptic terminals. Science. 2009;324(5933):1441–1444. | ||
Schapira AHV. Dopamine agonists and neuroprotection in Parkinson’s disease. Eur J Neurol. 2002;9:7–14. | ||
Ali SR, Ma Y, Parajuli RR, Balogun Y. A nonoxidative sensor based on a self-doped polyaniline/carbon nanotube composite for sensitive and selective detection of the neurotransmitter dopamine. Anal Chem. 2007;79(6):2583–2587. | ||
Baig N, Kawde A-N. A cost-effective disposable graphene-modified electrode decorated with alternating layers of Au Nps for the simultaneous detection of dopamine and uric acid in human urine. RSC Adv. 2016;6:80756–80765. | ||
Taylor IM, Robbins EM, Catt KA, Cody PA, Happe CL, Cui XT. Enhanced dopamine detection sensitivity by pedot/graphene oxide coating on in vivo carbon fiber electrodes. Biosens Bioelectron. 2017;89:400–410. | ||
Khoobi A, Ghoreishi SM, Behpour M, Masoum S. Three-dimensional voltammetry: a chemometrical analysis of electrochemical data for determination of dopamine in the presence of unexpected interference by a biosensor based on gold nanoparticles. Anal Chem. 2014;86:8967–8973. | ||
Zhao L, Xin X, Ding P, et al. Fluorescent oligomer as a chemosensor for the label-free detection of Fe(3+) and dopamine with selectivity and sensitivity. Anal Chim Acta. 2016;926:99–106. | ||
Zhang L, Cheng Y, Lei J, Liu Y, Hao Q, Ju H. Stepwise chemical reaction strategy for highly sensitive electrochemiluminescent detection of dopamine. Anal Chem. 2013;85:8001–8007. | ||
Zhang X, Chen X, Kai S, et al. Highly sensitive and selective detection of dopamine using one-pot synthesized highly photoluminescent silicon nanoparticles. Anal Chem. 2015;87:3360–3365. | ||
Niu S, Fang Y, Zhang K, Sun J, Wan J. Determination of dopamine using the fluorescence quenching of 2, 3-diaminophenazine. Instrum Sci Technol. 2016;45:101–110. | ||
Jiang Z, Gao P, Yang L, Huang C, Li Y. Facile in situ synthesis of silver nanoparticles on the surface of metal-organic framework for ultrasensitive surface-enhanced raman scattering detection of dopamine. Anal Chem. 2015;87:12177–12182. | ||
Palanisamy S, Yan L, Zhang X, He T. Surface enhanced raman scattering-active worm-like Ag clusters for sensitive and selective detection of dopamine. Anal Methods. 2015;7:3438–3447. | ||
Wang P, Xia M, Liang O, et al. Label-free sers selective detection of dopamine and serotonin using graphene-Au nanopyramid heterostructure. Anal Chem. 2015;87:10255–10261. | ||
Tripathi A, Emmons ED, Fountain AW. Critical role of adsorption equilibria on the determination of surfaceenhanced Raman enhancement. ACS Nano. 2015;9:584–593. | ||
Mazzulli JR, Burbulla LF, Krainc D, Ischiropoulos H. Detection of free and protein-bound ortho-quinones by near-infrared fluorescence. Anal Chem. 2016;88:2399–2405. | ||
Na C, Ming R, Shao X, et al. Surface-enhanced Raman spectroscopy of serum accurately detects prostate cancer in patients with prostate-specific antigen levels of 4–10 Ng/ML. Int J Nanomedicine. 2017;12:5399–5407. | ||
Yuan Y, Yu X, Zhang Q, et al. Sensitive detection of polycyclic aromatic molecules: surface enhanced Raman scattering via Pi-Pi stacking. Anal Chem. 2016;88:4328–4335. | ||
Tang L, Li S, Han F, et al. Sers-active Au@Ag nanorod dimers for ultrasensitive dopamine detection. Biosens Bioelectron. 2015;71:7–12. | ||
Joshi P, Zhou Y, Ahmadov TO, Zhang P. Quantitative sers-based detection using Ag–Fe3O4 nanocomposites with an internal reference. J Mater Chem C. 2014;2:9964–9968. | ||
Bu Y, Lee SW. Flower-like gold nanostructures electrodeposited on indium tin oxide (Ito) glass as a sers-active substrate for sensing dopamine. Microchimica Acta. 2015;182:1313–1321. | ||
Kasera S, Herrmann LO, del Barrio J, Baumberg JJ, Scherman OA. Quantitative multiplexing with nano-self-assemblies in sers. Sci Rep. 2014;4:6785. | ||
Jin JW, Chen ZP, Li LM, et al. Quantitative spectroscopic analysis of heterogeneous mixtures: the correction of multiplicative effects caused by variations in physical properties of samples. Anal Chem. 2012;84:320–326. | ||
Chen Y, Chen Z-P, Jin J-W, Yu R-Q. Quantitative determination of ametryn in river water using surface-enhanced raman spectroscopy coupled with an advanced chemometric model. Chemom Intell Lab Syst. 2015;142:166–171. | ||
Lee PC, Meise D. Adsorption and surface-enhanced raman of dyes on silver and gold sols. J Phys Chem. 1982;86:3391–3395. | ||
Frisch MJ, Pople JA, Binkley JS. Self-consistent molecular orbital methods 25. supplementary functions for gaussian basis sets. J Chem Phys. 1984;80:3265–3269. | ||
Lee C, Yang W, Parr RG. Development of the Colle-Salvetti correlation-energy formula into a functional of the electron density. Phys Rev B. 1988;37:785–789. | ||
Pande S, Jana S, Sinha AK, Sarkar S. Dopamine molecules on Aucore-Agshell bimetallic nanocolloids: fourier transform infrared, Raman, and surface-enhanced Raman spectroscopy study aided by density functional theory. J Phys Chem C. 2009;113:6989–7002. | ||
Lofrumento C, Platania E, Ricci M, Becucci M, Castellucci EM. Sers spectra of Alizarin Anion–Agn(N=2, 4, 14) systems: Tddft calculation and comparison with experiment. J Phys Chem C. 2016;120:12234–12241. | ||
Draine BT, Flatau PJ. Discrete-dipole approximation for scattering calculations. J Opt Soc Am A. 1994;11:1491–1499. | ||
Lynch DW, Hunter WR. Comments on the optical constants of metals and an introduction to the data for several metals A2. In: Palik ED, editor. Handbook of Optical Constants of Solids. Burlington, NJ: Academic Press; 1997:275–367. | ||
Pallaoro A, Braun GB, Moskovits M. Biotags based on surface-enhanced raman can be as bright as fluorescence tags. NANO Lett. 2015;15:6745–6750. | ||
Graham D. The characterization of physical adsorption systems. I. The equilibrium function and standard free energy of adsorption. J Phys Chem. 1953;57:1450–1456. | ||
Zeng Z, Cui B, Wang Y, Sun C, Zhao X, Cui H. Dual reaction-based multimodal assay for dopamine with high sensitivity and selectivity using functionalized gold nanoparticles. ACS Appl Mater Interfaces. 2015;7:16518–16524. |
 © 2018 The Author(s). This work is published and licensed by Dove Medical Press Limited. The full terms of this license are available at https://www.dovepress.com/terms.php and incorporate the Creative Commons Attribution - Non Commercial (unported, v3.0) License.
By accessing the work you hereby accept the Terms. Non-commercial uses of the work are permitted without any further permission from Dove Medical Press Limited, provided the work is properly attributed. For permission for commercial use of this work, please see paragraphs 4.2 and 5 of our Terms.
© 2018 The Author(s). This work is published and licensed by Dove Medical Press Limited. The full terms of this license are available at https://www.dovepress.com/terms.php and incorporate the Creative Commons Attribution - Non Commercial (unported, v3.0) License.
By accessing the work you hereby accept the Terms. Non-commercial uses of the work are permitted without any further permission from Dove Medical Press Limited, provided the work is properly attributed. For permission for commercial use of this work, please see paragraphs 4.2 and 5 of our Terms.