")
Back to Journals » Clinical, Cosmetic and Investigational Dentistry » Volume 11
Self-Reported General and Oral Health in Adults in the United States: NHANES 1999-2014
Authors Li KY , Okunseri CE, McGrath C, Wong MCM
Received 11 October 2019
Accepted for publication 28 November 2019
Published 24 December 2019 Volume 2019:11 Pages 399—408
DOI https://doi.org/10.2147/CCIDE.S234335
Checked for plagiarism Yes
Review by Single anonymous peer review
Peer reviewer comments 2
Editor who approved publication: Professor Katarzyna Emerich
Kar Yan Li,1 Christopher E Okunseri,2 Colman McGrath,3 May CM Wong3
1Faculty of Dentistry, The University of Hong Kong, Hong Kong, People’s Republic of China; 2Department of Clinical Services, School of Dentistry, Marquette University, Milwaukee, WI, USA; 3Dental Public Health, Faculty of Dentistry, The University of Hong Kong, Hong Kong, People’s Republic of China
Correspondence: May CM Wong
Dental Public Health, Faculty of Dentistry, The University of Hong Kong, 34 Hospital Road, Hong Kong, People’s Republic of China
Tel +852-2859-0422
Fax +852-2858-7874
Email [email protected]
Objective: To assess self-reported general health (SRGH) and self-reported oral health (SROH), and to identify factors associated with these self-health reports among adults in the United States.
Methods: Data from the National Health and Nutrition Examination Survey (NHANES) for 1999 to 2014 were analyzed. Survey-weighted descriptive statistics were computed and Pearson correlations between the two self-reported health status measures were tested. Separate multivariable logistic regressions in SROH and SRGH were performed. Measures of inequality-absolute inequality (AI) and relative inequality (RI) in SRGH and SROH were investigated.
Results: The sample consisted of 37,904 adults. Survey-weighted proportions of “excellent or very good” general health decreased from 54% in 1999–2000 to 45% in 2013–2014 and that of oral health increased from 27% in 1999–2000 to 38% in 2013–2014. Whites, participants with college degrees and those ≥400% of family poverty income ratio (PIR) had a higher probability of reporting “excellent or very good” general and oral health. Young people had a higher probability of reporting “excellent or very good” general health and the probability of reporting “excellent or very good” oral health fluctuated among the different age groups. There was a slight increase in both AI and RI by sociodemographic factors for SRGH (except for gender). For SROH, AI increased slightly, and RI decreased slightly (except for education) over the same period.
Conclusion: Self-reported general health had higher ratings than self-reported oral health. Survey period, age, race/ethnicity, education and family PIR were significantly associated with SRGH and SROH, but gender was only significant in the SROH model. SRGH was significantly associated with SROH after adjusting for other sociodemographic factors.
Keywords: adults, epidemiology, oral health, public health
Introduction
In the last 2 decades, studies have reported on the relationship between oral and general health as well as identified factors associated with reported health status.1–5 An analysis of available new data on the topic provides an opportunity to expand the literature by providing more current evidence on this relationship, given its importance for policy and program development, and dental public health practice. In addition, measures of general and oral health have the potential to demonstrate a linear change when oral and general health are measured directly with other closely related variables. Conversely, a non-linear function of change is possible in the same closely associated variables depending on an individual’s circumstance and how the measure is viewed.6 These observations suggest possible changes in oral health and general health status over time.
Hakeberg et al reported on the existence of socioeconomic gradients in self-reported oral health (SROH) and general health (SRGH) in a randomly selected adult population in Sweden. This was irrespective of the socioeconomic measure used.2 Sabbah et al analyzed data from the National Health and Nutrition Examination Survey and found that similar income and education gradients exist in oral and general health.7 Borrell et al reported that individual socioeconomic characteristics are associated with SRGH and SROH and are affected by individuals’ behaviors and access to resources.1 While these studies document the existence of social gradients in oral and general health status, none have analyzed data from multiple years from a single source, which is important in identifying trends. Moreover, despite the availability of these studies, researchers and policymakers have paid relatively limited attention to information about SRGH and SROH trends at a population level.
This study examines trends in self-reported general health (SRGH) and oral health (SROH) and explores their associations with sociodemographic factors in a new nationally representative dataset available in the United States. Findings from this study will contribute to the expansion of knowledge and further support the notion that oral health is an integral part of general health and that it contributes to individuals’ overall health and wellbeing.8
Methods
Data were extracted and analyzed from the 1999–2014 National Health and Nutrition Examination Survey (NHANES). NHANES is a 2-year cross-sectional survey based on a complex multistage sampling design that monitored the health status of civilian non-institutionalized population groups in the United States. To achieve more precise estimates, some subgroup populations such as persons aged 80 years or older, non-Hispanic Blacks and Mexican-Americans were oversampled.9 In this study, we focused on individuals aged 20 years and above with respect to information provided on self-reported general and oral health status. NHANES participants aged 20–29 years in the survey period 2009–2010 were not the target group in the oral health questionnaire. Information for self-reported oral health status for the non-target population was missing and thus not included in this study.10
For consistency with previous publications on a closely related topic, self-reported general health and oral health status were considered in four categories - “excellent” or “very good”; “good”; “fair” and “poor”.11 Age was categorised in 10-year intervals (20–29; 30–39; 40–49; 50–59; 60–69; 70–79; 80+). Race/ethnicity was described as Mexican American, Non-Hispanic Black, Non-Hispanic White and Others. Educational level was stratified into four levels (≤ Grade 12/Grade 12 with no diploma; high school graduate/General Educational Development (GED) or equivalent; some college or associate (associate of arts (AA)) degree; college graduate or above). Family income was indicated by an index – family poverty income ratio (PIR) because this index could be comparable over the years. Family PIR was calculated by dividing family income by the poverty guidelines issued by the Department of Health and Human Services (DHHS), specific to family size, as well as the appropriate year and state for each year.12 Ratios below 100% were adopted as a simplified measure to indicate that a family income was below the poverty level. Family PIR was categorized into five levels (<100%; 100-199%; 200-299%; 300-399%; ≥400%).
Statistical Analysis
Data were pooled to generate summary and inferential statistics. Survey-weighted analyses were used to analyze the data incorporating sample weights, primary sampling units and strata to account for NHANES’ complex survey design (including over-sampling), survey non-response and post-stratification. Survey-weighted descriptive statistics were computed to provide nationally representative estimates. Survey-weighted mosaic plot, Pearson correlations and Rao–Scott chi-square test were used to investigate the association between the two self-reported health status indicators.
Separate multivariable logistic regressions of “excellent or very good” rating in SRGH and SROH based on the survey period and five categorical sociodemographic factors: age, gender, race/ethnicity, education level and family PIR were performed. In order to detect the possible time-changing effects across the surveys, interaction effects between the survey period and the above five socio-demographic factors (period × age, period × gender, period × race/ethnicity, period × education level, and period × PIR) were added using a forward selection method. Predicted probabilities were estimated with odds ratios in the final models.
Furthermore, SRGH was also included as a binary factor (excellent or very good; good, fair or poor) into the SROH model adjusted for the above five socio-demographic factors and the possible interaction effects. The likelihood ratio test, score test and Wald test were used to check the goodness-of-fit of the models. All data were analyzed with the two-sided 0.05 significance level using Statistical Analysis System (SAS) On Demand for Academics Version 3.4 (Enterprise Edition) (SAS Institute Inc., Cary, NC, USA).
Measures of inequality (absolute inequality (AI) and relative inequality (RI)) in SRGH and SROH were investigated by the rate difference and rate ratio of the predicted probabilities of “excellent or very good” for each significant sociodemographic factor. Due to the lack of a natural order in certain subgroups for the different factors (e.g., race/ethnicity), and in order to ensure consistency, AI and RI in all factors were measured by the difference and ratio between those subgroups with the highest and lowest values of the predicted probabilities estimated from the final model, respectively.13
Results
The sample consisted of 37,904 adults (aged 20+ years). Survey-weighted proportions of “excellent or very good” ratings for SRGH were larger than those in SROH over the years. Survey-weighted proportions of “excellent or very good” general health decreased from 54% in 1999–2000 (n=4116) to 45% in 2013–2014 (n=5301) but survey-weighted proportions of the same rating in oral health increased from 27% in 1999–2000 to 38% in 2013–2014 (Figure 1).
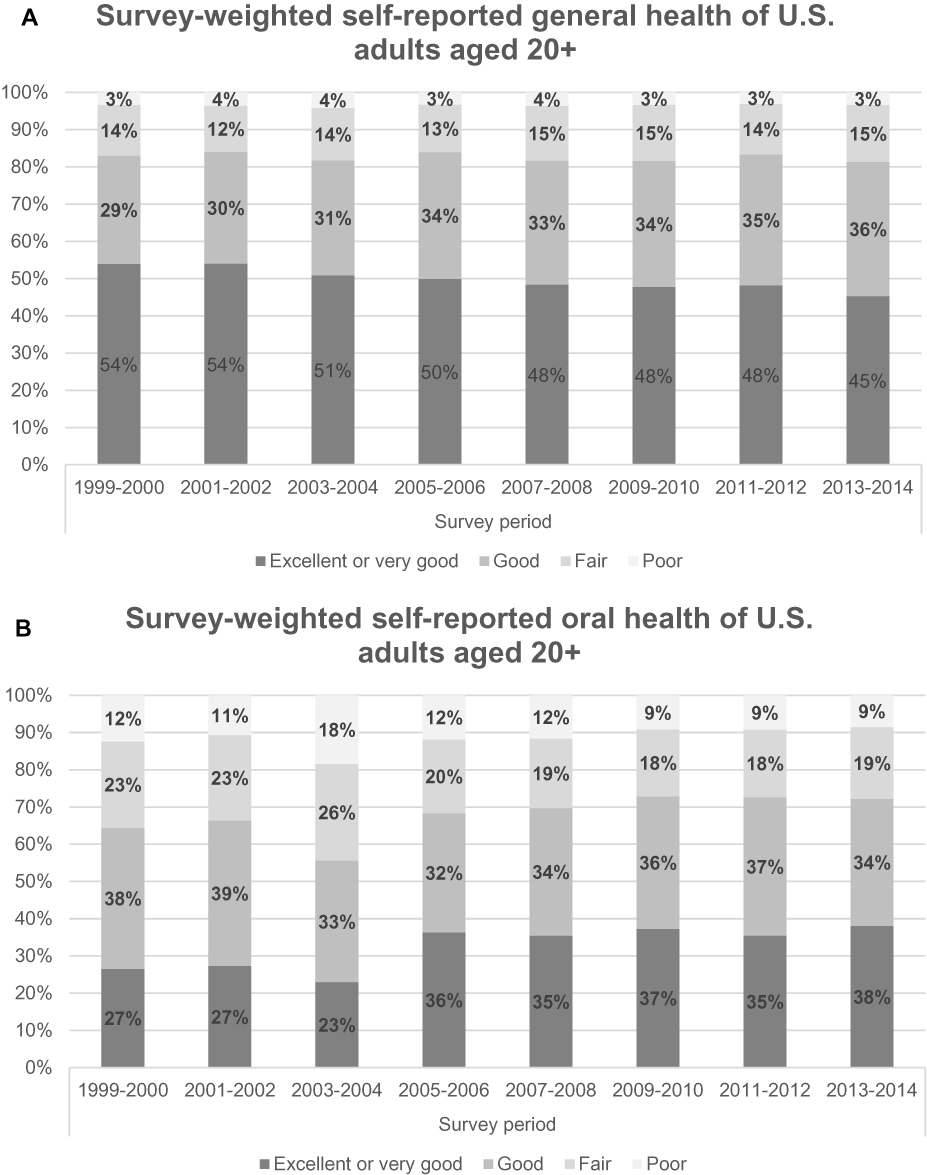 |
Figure 1 (A) Survey-weighted self-reported general health (SRGH) and (B) self-reported oral health (SROH) of US adults aged 20+ in 1999–2014. |
A mosaic plot (Figure 2) showing unequal distributions of SRGH in different SROH categories suggests an association between these two self-reported health status indicators. There was a statistically significant weak positive association between the two self-reported health status indicators over the whole period (Pearson correlation = 0.34; Rao–Scott chi-square test, p<0.001) and for each survey period (Pearson correlation range 0.31–0.38; Rao–Scott chi-square test, all Bonferroni adjusted p<0.001).
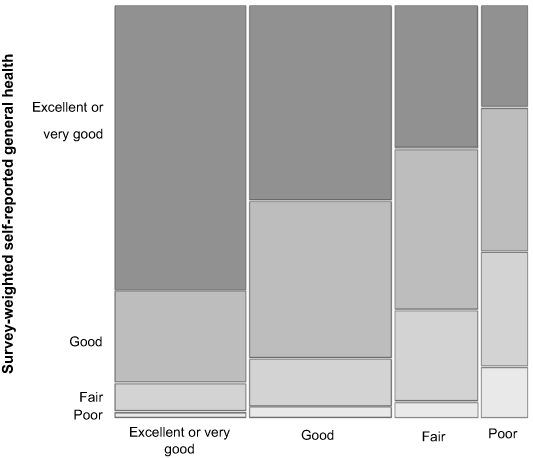 |
Figure 2 Relationship between self-reported general health and oral health (SRGH and SROH) status of US adults aged 20+ in 1999–2014 (Mosaic plot) (width indicating the relative proportion of the corresponding value on the population). |
Survey period, age, race, education and PIR were significant factors (all p<0.001) in SRGH (Table 1) and SROH (Model 1, Table 2) logistic regression analyses, but gender was significant in the SROH model (p<0.001) but not in the SRGH model. The significant interaction terms were also different in SROH and SRGH final models. There existed only one significant interaction term (period × PIR; p=0.025) in the SRGH final model but two significant interaction terms (period × age and period × education level; p=0.009 and 0.008, respectively) were found in the SROH final model (Model 1, Table 2). We conducted further analysis considering SRGH as an independent binary variable in the SROH model (Model 2 of Table 2). All original factors and final interaction terms remained the same (all p<0.05), while SRGH was also significantly associated with SROH (p<0.001). People with “excellent or very good” SRGH had a higher probability of reporting excellent or very good SROH compared with those with just good, fair or poor SRGH (odds ratio, OR = 2.87, 95% confidence interval, CI (2.68, 3.07)). In general, Model 2 had similar patterns as the original model (Model 1, Table 2).
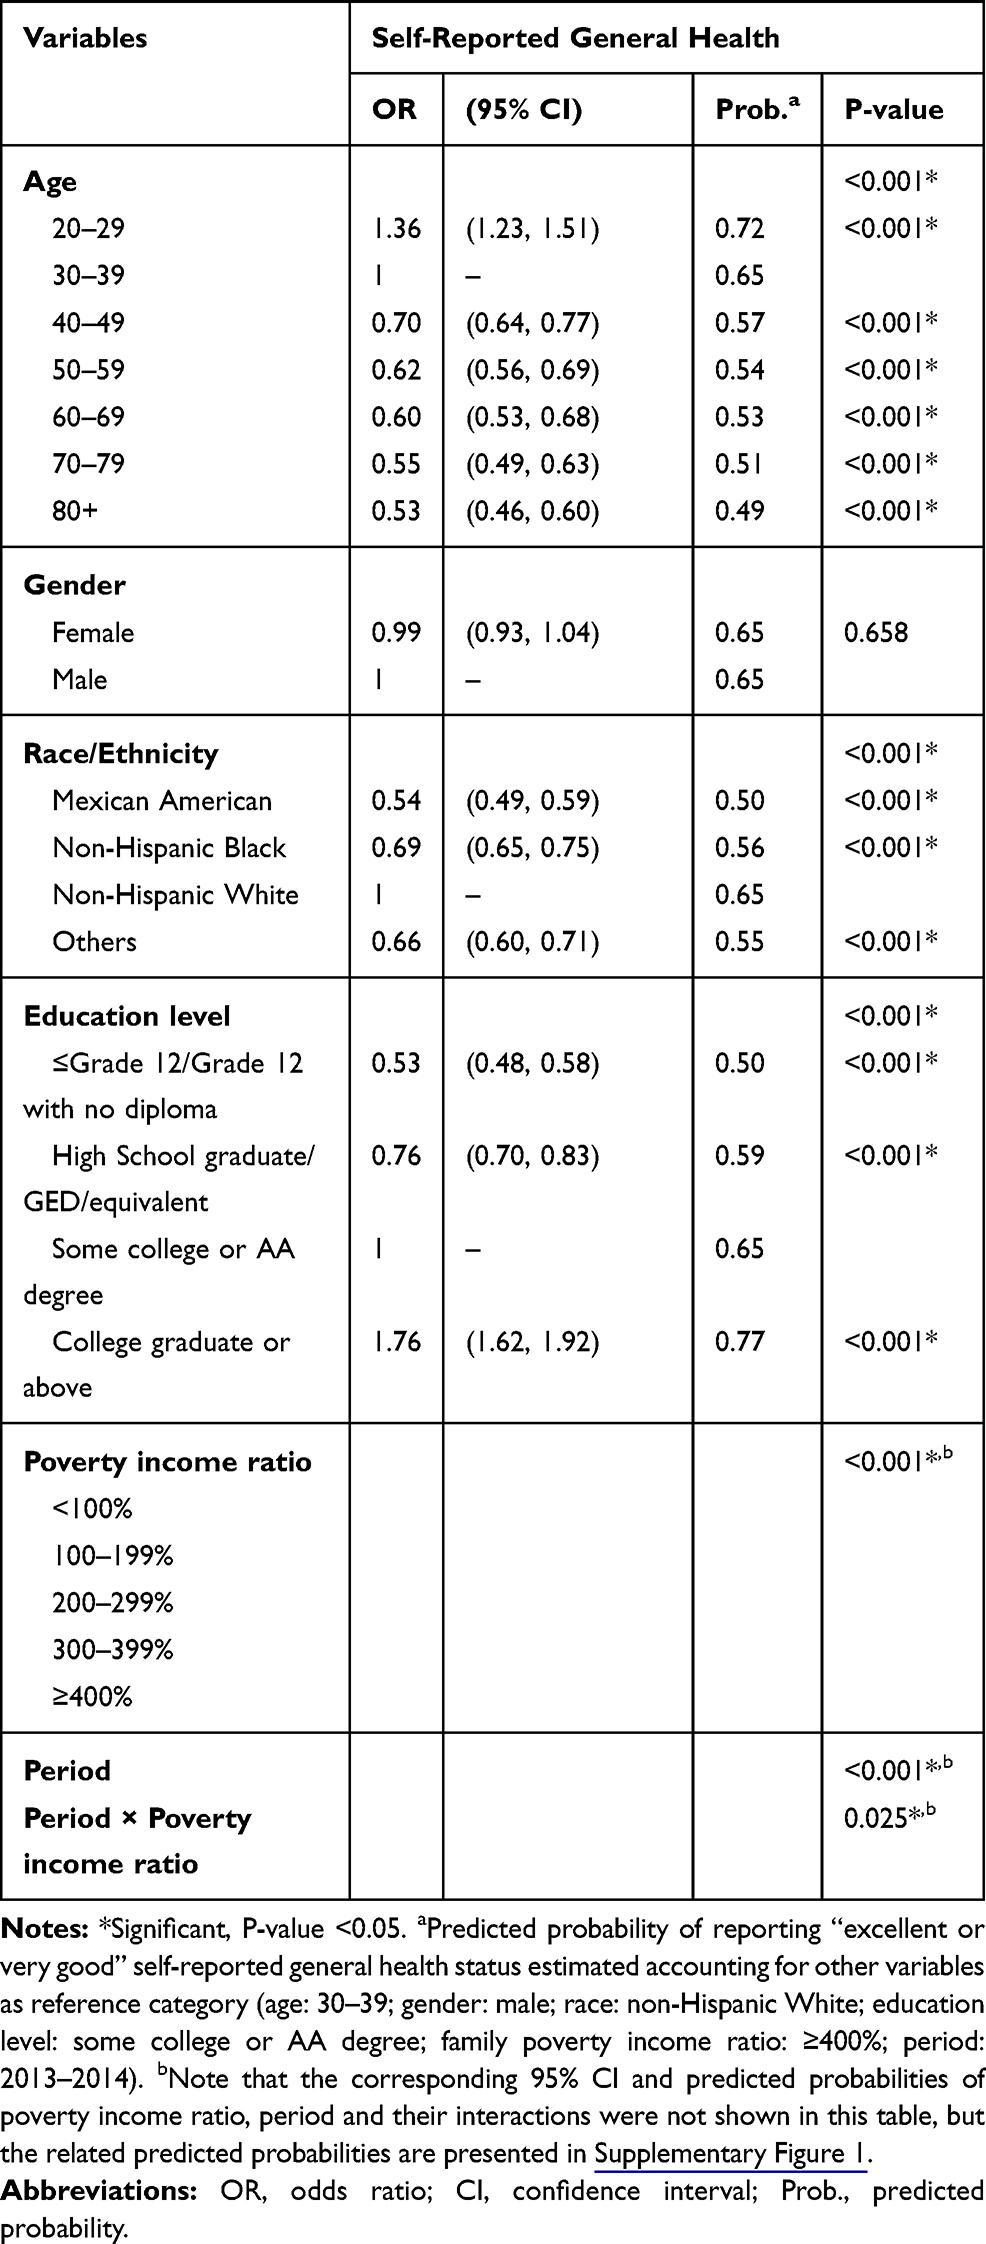 |
Table 1 Pooled Survey-Weighted Multivariable Logistic Regression for the “Excellent or Very Good” Self-Reported General Health (SRGH) Status of US Adults Aged 20+ Years in 1999–2014 |
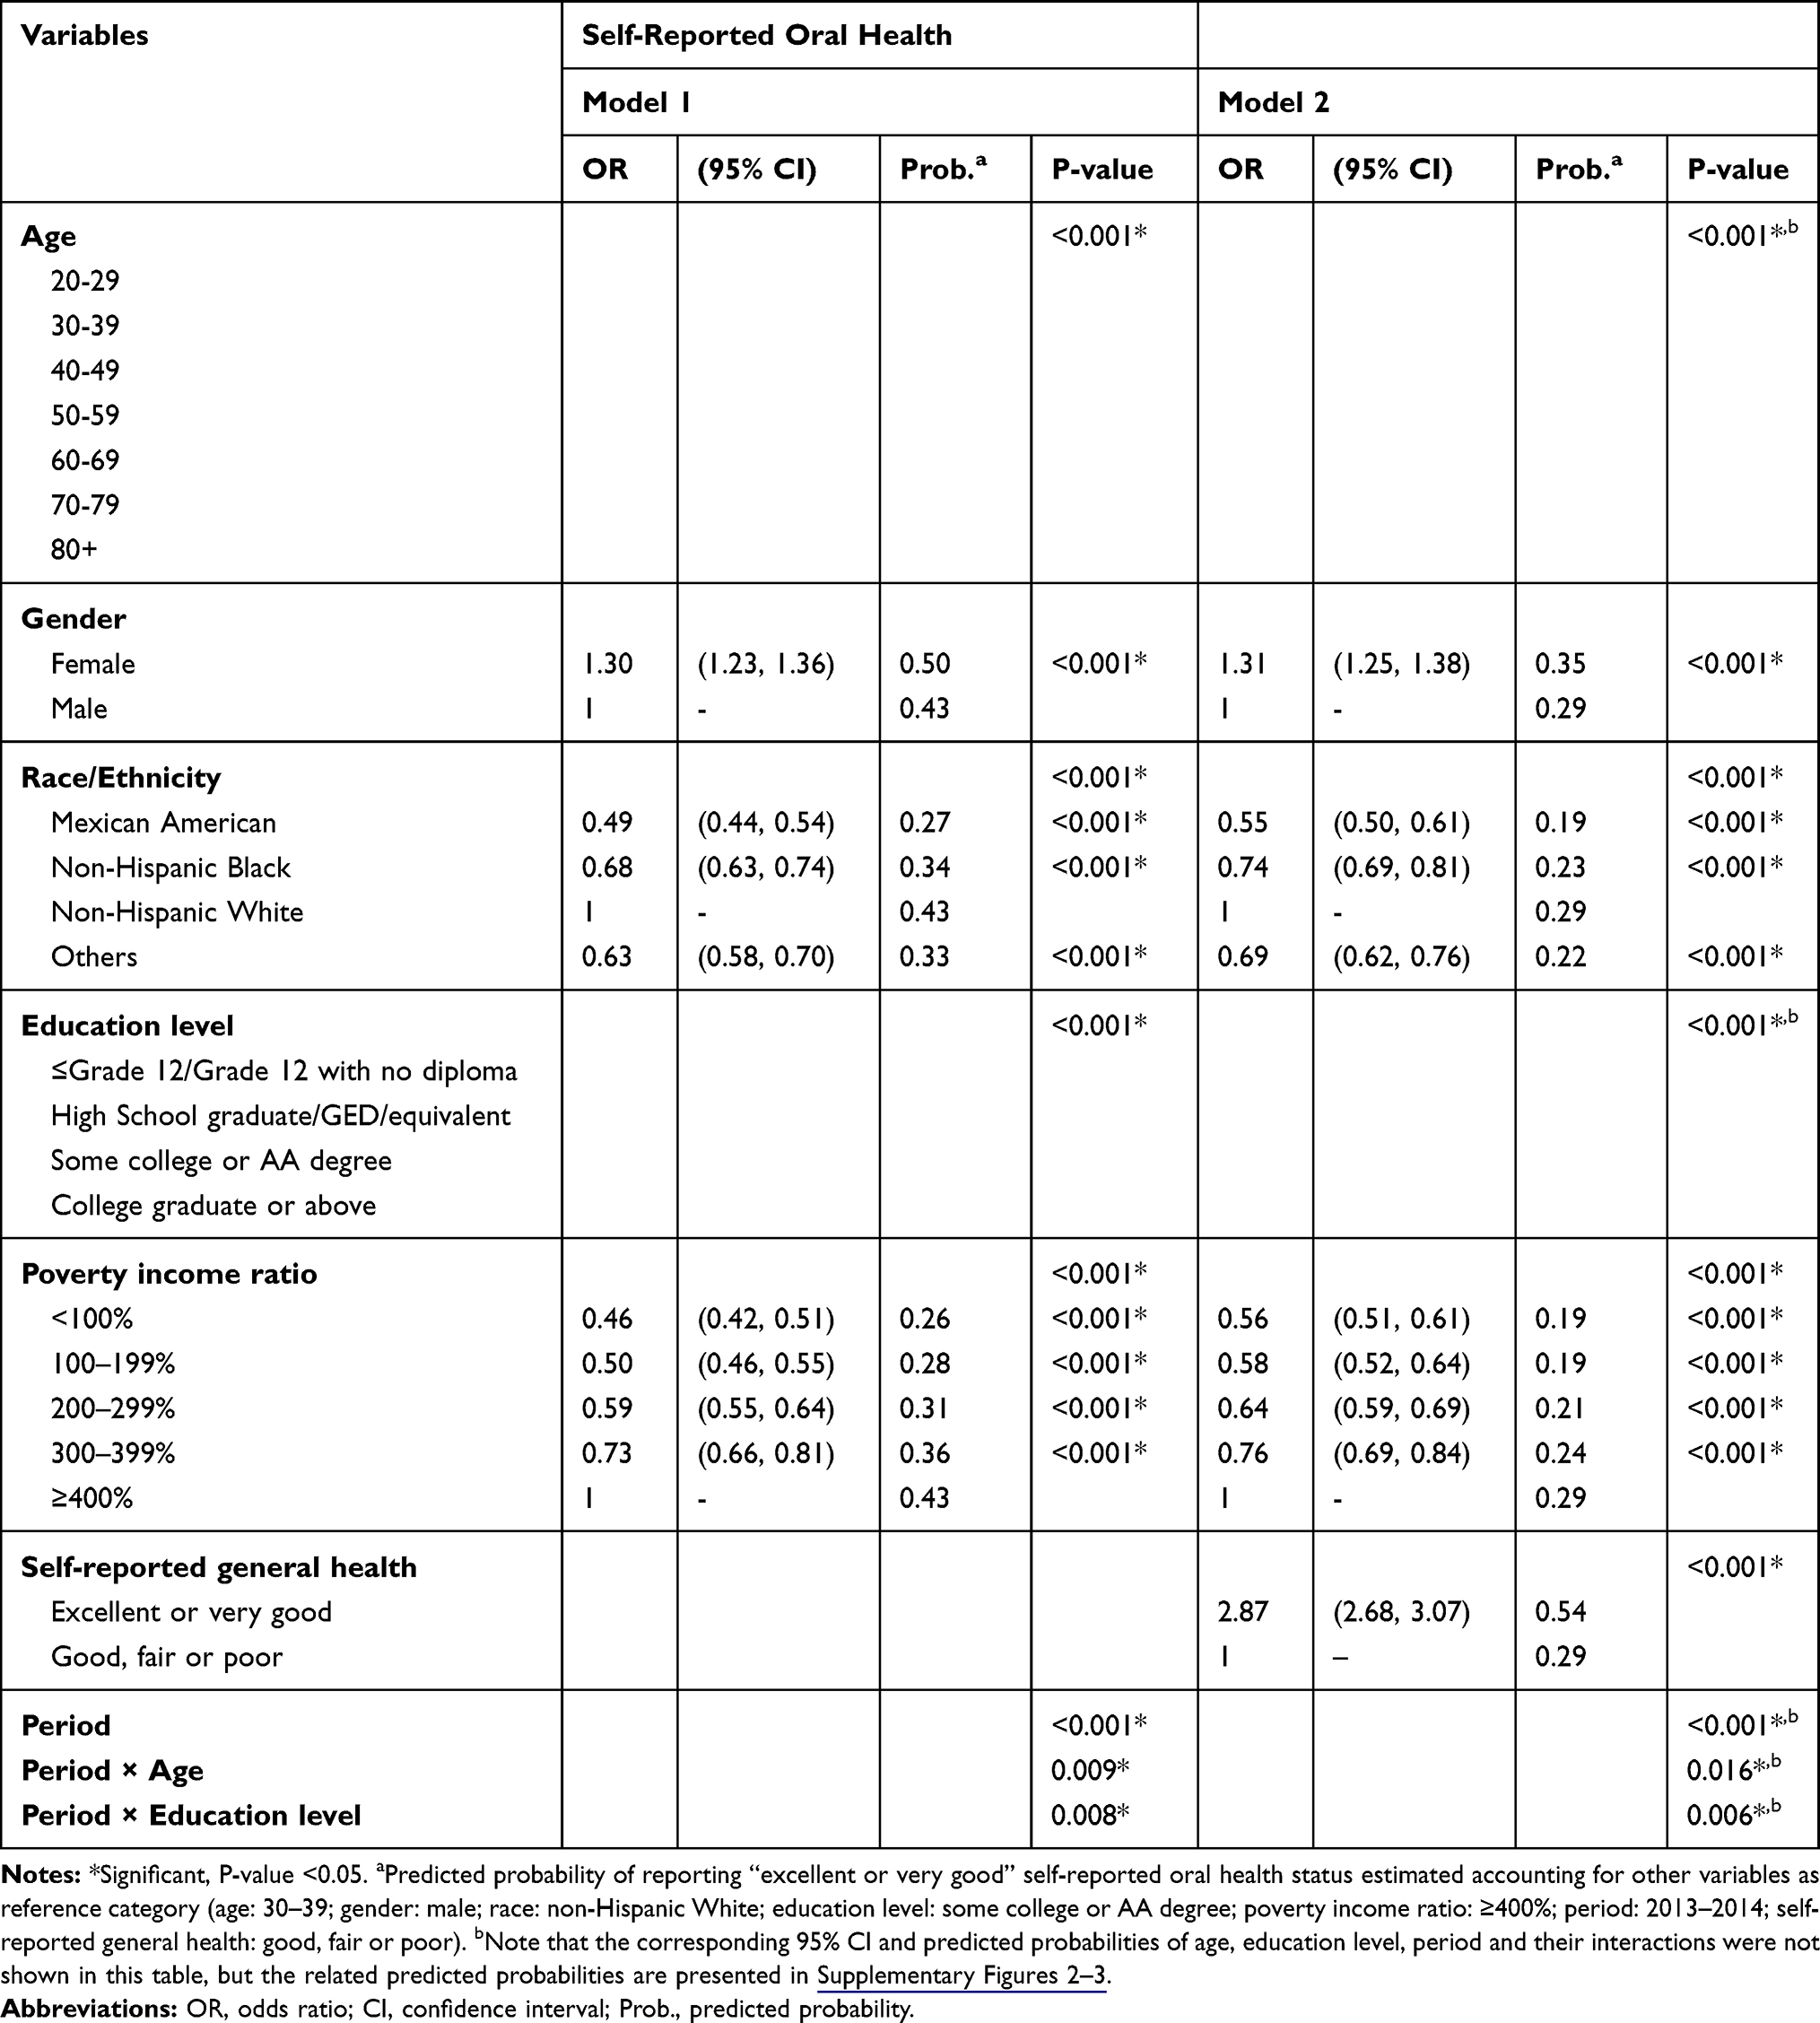 |
Table 2 Pooled Survey-Weighted Multivariable Logistic Regression for the “Excellent or Very Good” Self-Reported Oral Health Status (SROH) of US Adults Aged 20+ Years in 1999–2014 (Model 1: Without Self-Reported General Health (SRGH); Model 2: With SRGH) |
The goodness-of-fit for the separate multivariable logistic analyses in SRGH and SROH was evaluated using the likelihood ratio test, score test and Wald test, and all tests demonstrated that the models were a good fit. Predicted probability for the main effects is shown in Tables 1 and 2, while those related to the interaction effects are plotted in Supplementary Figures 1–3, given that figures are much easier to explain the interaction effects.
Participants with a higher family income also had a higher probability of self-reporting “excellent or very good” general and oral health even with differences in ratings of SRGH within the richest and poorest groups over the years (Tables 1 and 2 and Supplementary Figure 1). Similarly, people with a higher level of education had higher probability of self-reporting “excellent or very good” general and oral health despite the inconsistent differences in SROH ratings between those with ≤ Grade 12/Grade 12 with no diploma and those with high school or had GED or equivalent education over the years (Tables 1and 2 and Supplementary Figure 2).
In general, participants surveyed in the earlier survey periods (1999–2004) had slightly higher predicted probabilities of reporting “excellent or very good” general health (Supplementary Figure 1) but lower predicted probabilities of reporting “excellent or very good” oral health (Supplementary Figures 2–3). Younger participants had a higher probability of reporting “excellent or very good” general health (Table 1) but the probability of reporting “excellent or very good” oral health fluctuated among different age groups (Supplementary Figure 3). Compared to the respondents aged 30–39 years, those aged 50–59 years had a relatively lower probability of reporting “excellent or very good” oral health while those aged 20–29 years had a higher probability of reporting “excellent or very good” oral health after adjustment for SRGH. However, the probability of reporting “excellent or very good” oral health for the people aged 60 or above was not consistent and the differences among other age groups varied over the period (Supplementary Figure 3).
There was no significant association in terms of gender with self-reported general health as “excellent or very good” (p=0.658, Table 1). However, females showed a significantly higher probability of reporting “excellent or very good” oral health (both p<0.001, Table 2) even when considering SRGH as a possible confounding factor. Regarding race/ethnicity, Whites had the highest probabilities and Mexican Americans had the lowest probabilities of reporting “excellent or very good” oral and general health (all p<0.001).
Figure 3 shows that both absolute inequality (AI) and relative inequality (RI) in SRGH between genders remained stable over time (“Females”>“Males”; AI: 0.3%; RI: 1.0). Race/ethnicity (“Whites”>“Mexican”), age (“20–29”>“80+”) and education (“College graduate or above”>“≤Grade 12/Grade 12 with no diploma”) had similar trend patterns. In both cases, absolute inequality (AI) and relative inequality (RI) increased slightly between the periods 1999–2000 and 2013–2014. AI and RI in SRGH showed larger fluctuations over time among different family PIR groups where both inequalities (“≥400%” >“<100%”) had shown an increasing trend with a sudden peak in 2009–2010.
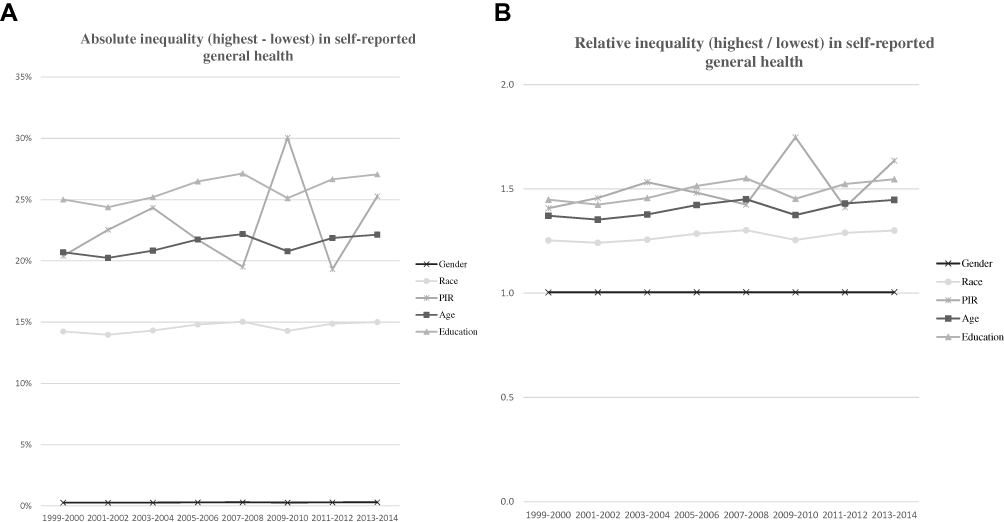 |
Figure 3 (A) Absolute inequality (AI) and (B) relative inequality (RI) in self-reported general health (SRGH) status of US adults aged 20+ in 1999–2014. |
Gender (“Females”>“Males”), Race/ethnicity (“Whites”>“Mexican”) and family PIR (“≥400%” >“<100%”) had similar trend patterns in both absolute inequality (AI) and relative inequality (RI) in SROH (Figure 4). AI slightly increased while RI slightly decreased over the years, and AI and RI in SROH showed larger fluctuations over time among age and education groups. AI increased, and RI decreased slightly among different age groups while both AI and RI increased among education groups.
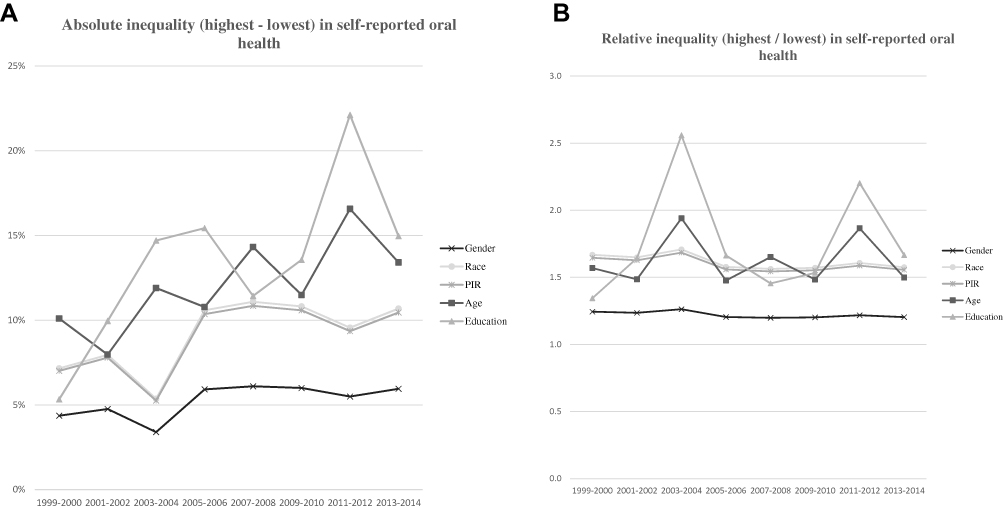 |
Figure 4 (A) Absolute inequality (AI) and (B) relative inequality (RI) in self-reported oral health (SROH Model 2) status of US adults aged 20+ in 1999–2014. |
Discussion
The purpose of this study was to use up-to-date available data to identify trends and factors associated with self-reported oral and general health of adults in the United States. Self-reported general health of “excellent to very good” decreased by approximately 10% in 2013–2014 compared 1999–2000, but the proportion of participants that reported poor general health remained consistent over time. Possible reasons for the difference in self-reported general health could include ill health, changes in lifestyle or psycho-social or socio-demographic changes, which have been documented to adversely affect health.14 During the same period, the proportion of participants that reported “excellent to very good” oral health increased by slightly over 10%. This finding reflects a significant improvement in the oral health of adults living in the United States over time. This finding is consistent with that of older adults in Canada15 but in sharp contrast with adults living in Australia.16
We found statistically significant differences in SRGH and SROH over time. In general, SRGH had higher ratings than SROH. This potentially highlights a need to increase access to oral health care and health literacy through promotional programs to reinforce the importance of oral health to overall wellbeing. In addition, our study revealed a statistically significant (but) weak positive association between the two self-reported health measures over the whole period and for each survey period. SRGH remained significantly associated with SROH even after adjusting for other sociodemographic factors. The associations between the SROH and sociodemographic factors were the same with and without the inclusion of SRGH in our study, a finding in line with that of a previous report.11 The healthcare system, individual life styles and personal habits play a role in SRGH and SROH. Our findings clearly strengthen the notion that oral health is a key part of general health.
Another interesting finding was that family income and education were significant predictors of SROH and SRGH. A higher family poverty income ratio and educational level were associated with higher odds of reporting excellent or very good oral and general health. The inclusion of interaction terms in our analyses did not change our finding of the existence of social gradient in this study. This result is consistent with previous published studies.1,2,7,17,18 The survey period was a significant predictor of SROH and SRGH. There was lower odds of reporting excellent or very good general health and higher odds of reporting the same for oral health in the later period of the study. This finding is suggestive of the existence of possible variability in participants’ self-assessment of their oral and general health based on their frame of reference at a point in time. Future studies are required to explore the pathway related to how survey periods affect SRGH and SROH.
In this study, age was significantly associated with SRGH and SROH, while gender showed a significant association with SROH only. Younger adults had higher odds of reporting that their general health was excellent or very good and the odds of reporting excellent or very good oral health fluctuated among different age groups. Compared to men, female subjects had higher odds of reporting that their oral health was excellent or very good. Our findings are consistent with some previous studies,4 but in sharp contrast to that reported by Wilson et al who reported that there was no significant association between changes in self-reported health status and age or gender.15
Measures of inequality (absolute inequality (AI) and relative inequality (RI)) were implored in our study. We found a slight increase in both AI and RI between the periods 1999–2000 and 2013–2014 for SRGH; except for gender. Absolute sociodemographic inequalities in SROH increased slightly and the relative inequalities decreased slightly from 1999 to 2004 except for education. This finding demonstrates that sociodemographic inequalities in US adults exist. While these findings hold true, the frame of reference used by individuals to assess their oral and general health status remains unclear. Such frames of reference could be based on the biomedical model or disease-oriented model, the emotional or general feeling model or the functional status model.19 The study data did not provide the opportunity to examine this dimension related to the conceptual framework for self-reported oral and general health assessment. Nonetheless, Kaplan et al reported that good and poor self-reported health are not a continuum, but perhaps two different concepts that are evaluated in more than one way by individuals.1
The issue of social gradients in self-reported general health and oral health and whether similarities exist is a growing area in health services research. Racial and ethnic inequalities in SRGH and SROH were identified. Compared to Whites, Blacks and Mexican Americans had lower odds of reporting that their oral and general health was excellent or very good. Although this finding is not entirely new in the dental literature, it confirms existing norms and the need to continue to explore mechanisms to explain for these associations. Studies have suggested the possibility of an indirect mechanism in terms of differences in the exposure to risk factors and health behaviors.18,20,21 There are several public health implications of our findings including the applicability of the measures for the assessment of oral and general health. Our findings also highlight the need for improvements in oral and general health to achieve overall wellbeing through engagement in health promotion activities. Finally, the findings underscore the need to continuously monitor the oral and general health of the population because of possible changes depending on the frame of reference.
Limitations
Our study has certain limitations that should be considered during interpretation. First, our data are from a series of cross-sectional studies and not repeated measures for specific individuals over time. Nonetheless, the longitudinal nature of our data with its large sample size lends itself to the evaluation of “changes” over time. Second, we did not examine the association of these subjective measures with any clinical parameter to assess the validity and reliability of the measure. Notwithstanding this, studies have consistently documented that these measures are valid and reliable for population health assessment and monitoring. Third, we are unable to demonstrate “causality” because of our study design. Despite the shortcomings of self-reported oral and general health measures noted in the literature, they are both still viable metrics used in population-based health surveys. Fourth, Spearman correlation could not be performed for the complex sample design by SAS. Therefore, Pearson’s correlation was performed instead. Although Spearman correlations were not estimated, our results appeared to be significantly weak and similar to results from Pearson’s correlations. Finally, data on dental insurance and last dental visit were not considered in this study because they were unavailable in certain periods 2005–2014 and 2005–2010, respectively.
Conclusion
In conclusion, self-reported general health had higher ratings than self-reported oral health. Survey period, age, race, education level and family income were significantly associated with SRGH and SROH, but gender was only significant in the SROH model and not in the SRGH model. Sociodemographic inequalities in self-reported oral and general health exist in US adults.
Abbreviations
AA, associate of arts; AI, absolute inequality; CI, confidence interval; DHHS, Department of Health and Human Services; GED, General Educational Development; NHANE, National Health and Nutrition Examination Survey; OR, odds ratio; PIR, poverty income ratio; Prob., predicted probability; RI, relative inequality; SAS, Statistical Analysis System; SRGH, self-reported general health; SROH, self-reported oral health.
Ethical Statement
This study was carried out in accordance with the principles of the Declaration of Helsinki. The NHANES data used in this study did not contain identifiable nor protected health information and is publicly available for download. The Marquette University Institutional Review Board determined that our study is not human research and for their purposes, our research does not require IRB submission/approval.
Data Sharing Statement
The dataset analyzed in the current study is available from the corresponding author on reasonable request.
Author Contributions
All authors contributed to data analysis, drafting or revising the article, gave final approval of the version to be published, and agree to be accountable for all aspects of the work.
Disclosure
The author reports no conflicts of interest in this work.
References
1. Borrell LN, Baquero MC. Self-rated general and oral health in New York City adults: assessing the effect of individual and neighborhood social factors. Community Dent Oral Epidemiol. 2011;39(4):361–371. doi:10.1111/j.1600-0528.2010.00603.x
2. Hakeberg M, Wide Boman U. Self-reported oral and general health in relation to socioeconomic position. BMC Public Health. 2017;18(1):63. doi:10.1186/s12889-017-4609-9.
3. Dolan TA, Gooch BF, Bourque LB. Associations of self-reported dental health and general health measures in the Rand Health Insurance Experiment. Community Dent Oral Epidemiol. 1991;19(1):1–8. doi:10.1111/j.1600-0528.1991.tb00095.x
4. Finlayson TL, Williams DR, Siefert K, Jackson JS, Nowjack-Raymer R. Oral health disparities and psychosocial correlates of self-rated oral health in the National Survey of American life. Am J Public Health. 2010;100(Suppl 1):S246–S255. doi:10.2105/AJPH.2009.167783
5. Kim SY, Kim JE, Kim HN, et al. Association of self-perceived oral health and function with clinically determined oral health status among adults aged 35–54 years: a cross-sectional study. Int J Environ Res Public Health. 2018;15(8):1681. doi:10.3390/ijerph15081681
6. Bailis DS, Segall A, Chipperfield JG. Two views of self-rated general health status. Soc Sci Med. 2003;56(2):203–217. doi:10.1016/S0277-9536(02)00020-5
7. Sabbah W, Tsakos G, Chandola T, Sheiham A, Watt RG. Social gradients in oral and general Health. J Dent Res. 2007;86(10):992–996. doi:10.1177/154405910708601014
8. U.S. Department of Health and Human Services. Oral Health in America: A Report of the Surgeon General. Rockville (MD): U.S. Department of Health and Human Services, National Institute of Dental and Craniofacial Research, National Institutes of Health; 2000.
9. Johnson CL, Dohrmann SM, Burt VL, Mohadjer LK. National Health and Nutrition Examination Survey: sample design, 2011-2014. Vital Health Stat. 2014;2:(162):1–33.
10. Centers for Disease Control and Prevention. National health and nutrition examination survey, 2009-2010 data documentation, codebook, and frequencies. Oral Health (OHQ_F). 2012. Available from: https://wwwn.cdc.gov/Nchs/Nhanes/2009-2010/OHQ_F.htm.
11. Li KY, Okunseri CE, McGrath C, Wong MC. Trends in self‐reported oral health of US adults: National Health and Nutrition Examination Survey 1999‐2014. Community Dent Oral Epidemiol. 2018;46(2):203–211. doi:10.1111/cdoe.12355
12. U.S. Department of Health & Human Services, Office of the Assistant Secretary for Planning and Evaluation. Frequently Asked Questions Related to the Poverty Guidelines and Poverty. Available from: https://aspe.hhs.gov/frequently-asked-questions-related-poverty-guidelines-and-poverty.
13. World Health Organization. Handbook on Health Inequality Monitoring: With a Special Focus on Low- and Middle-Income Countries. Geneva: World Health Organization; 2013:29–32.
14. Eriksson I, Unden AL, Elofsson S. Self-rated health. Comparisons between three different measures. Results from a population study. Int J Epidemiol. 2001;30(2):326–333. doi:10.1093/ije/30.2.326
15. Wilson K, Elliott SJ, Eyles JD, Keller-Olaman SJ. Factors affecting change over time in self-reported health. Can J Public Health. 2007;98(2):154–158. doi:10.1007/BF03404329
16. Do L. Oral health status and perception of oral health of young Australian adults. Aust Dent J. 2012;57(4):515–517. doi:10.1111/adj.12009
17. Molarius A, Engstrom S, Flink H, Simonsson B, Tegelberg A. Socioeconomic differences in self-rated oral health and dental care utilization after the dental care reform in 2008 in Sweden. BMC Oral Health. 2014;14:134. doi:10.1186/1472-6831-14-134
18. Locker D. Self-esteem and socioeconomic disparities in self-perceived oral health. J Public Health Dent. 2009;69(1):1–8. doi:10.1111/j.1752-7325.2008.00087.x
19. Kaplan G, Baron-Epel O. What lies behind the subjective evaluation of health status. Soc Sci Med. 2003;56(8):1669–1676. doi:10.1016/S0277-9536(02)00179-X
20. Sanders AE, Spencer AJ. Why do poor adults rate their oral health poorly? Aust Dent J. 2005;50(3):161–167. doi:10.1111/j.1834-7819.2005.tb00355.x
21. Sisson KL. Theoretical explanations for social inequalities in oral health. Community Dent Oral Epidemiol. 2007;35(2):81–88. doi:10.1111/j.1600-0528.2007.00354.x
 © 2019 The Author(s). This work is published and licensed by Dove Medical Press Limited. The full terms of this license are available at https://www.dovepress.com/terms.php and incorporate the Creative Commons Attribution - Non Commercial (unported, v3.0) License.
By accessing the work you hereby accept the Terms. Non-commercial uses of the work are permitted without any further permission from Dove Medical Press Limited, provided the work is properly attributed. For permission for commercial use of this work, please see paragraphs 4.2 and 5 of our Terms.
© 2019 The Author(s). This work is published and licensed by Dove Medical Press Limited. The full terms of this license are available at https://www.dovepress.com/terms.php and incorporate the Creative Commons Attribution - Non Commercial (unported, v3.0) License.
By accessing the work you hereby accept the Terms. Non-commercial uses of the work are permitted without any further permission from Dove Medical Press Limited, provided the work is properly attributed. For permission for commercial use of this work, please see paragraphs 4.2 and 5 of our Terms.