")
Back to Journals » OncoTargets and Therapy » Volume 13
Secretory Pathway Kinase FAM20C, a Marker for Glioma Invasion and Malignancy, Predicts Poor Prognosis of Glioma
Authors Du S , Guan S , Zhu C, Guo Q, Cao J, Guan G, Cheng W, Cheng P, Wu A
Received 9 August 2020
Accepted for publication 21 October 2020
Published 18 November 2020 Volume 2020:13 Pages 11755—11768
DOI https://doi.org/10.2147/OTT.S275452
Checked for plagiarism Yes
Review by Single anonymous peer review
Peer reviewer comments 2
Editor who approved publication: Dr Leo Jen-Liang Su
Shaonan Du,1 Shu Guan,2 Chen Zhu,1 Qing Guo,1 Jingyuan Cao,1 Gefei Guan,1 Wen Cheng,1 Peng Cheng,1 Anhua Wu1,3
1Department of Neurosurgery, The First Hospital of China Medical University, Shenyang, People’s Republic of China; 2Department of Surgical Oncology and Breast Surgery, The First Hospital of China Medical University, Shenyang, People’s Republic of China; 3College of Applied Technology, China Medical University, Shenyang, Liaoning 110122, People’s Republic of China
Correspondence: Anhua Wu; Peng Cheng
The First Hospital of China Medical University, No. 155 Nanjingbei Street, Heping District, Shenyang, Liaoning 110001, People’s Republic of China
Email [email protected]; [email protected]
Purpose: Glioblastoma (GBM) is the most lethal primary cancer in adult central nervous system, and new strategies are desperately needed. The secretory pathway kinase or kinase-like proteins (SPKKPs) have been shown to mediate multiple physiological functions by phosphorylating extracellular proteins and proteoglycans. However, their roles in cancers, especially GBM, remain poorly defined.
Methods: The least absolute shrinkage and selection operator (LASSO) regression was employed for establishing the SPKKPs signature for IDH wild type (wt) GBM prognosis. Integrative analyses with multiple datasets were employed to identify the core member of this gene family in glioma. The receiver operator characteristic (ROC) curves and immunohistochemistry were further used for evaluating its association with progressive malignancy in glioma and GBM patients’ survival, respectively. Gene set enrichment analysis (GSEA) and Kyoto Encyclopedia of Genes and Genomes (KEGG) were used to interpret its functions in GBM, which were further verified in vitro.
Results: A SPKKPs classifier was constructed with 3 genes of this family. This signature could effectively distinguish IDH wt GBM survival. Family with sequence similarity 20 C (FAM20C) was further identified as the core member of this family in glioma. Elevated FAM20C expression was not only closely correlated with glioma malignancy progression and the mesenchymal subtype of GBM but also indicated unfavorable survival of GBM patients. FAM20C was also found to be associated with the disrupted immune response in GBM microenvironment and was required for the migration of glioma and immune cells.
Conclusion: These data indicate that the potential of FAM20C serving as a predictive molecule and a therapeutic target for GBM.
Keywords: glioblastoma, FAM20C, migration, invasion, prognosis
Introduction
Protein phosphorylation mediated by kinases is a fundamental mechanism for both intracellular and extracellular regulation process.1 The human kinase group contains more than 500 kinases, which are activators of biological molecules and mediate signaling pathways.2 The defective and abnormal activation of kinases has been implicated in diseases including solid tumors.2 Recent years, several studies have identified a group of proteins, called “secretory pathway kinase or kinase-like proteins” (SPKKPs), which were specifically localized in lumen of the endoplasmic reticulum, Golgi apparatus, and extracellular space.3–5 These kinases or kinase-like proteins are co-localized with secretory pathways and quite different from typical protein kinases. They possess phosphatase and glycan kinase activities for secretory molecules, and can phosphorylate a series of substrates which play important roles in physiological and pathophysiological processes including tumor growth and metastasis.2–4,6–9 However, the functions of these SPKKPs in cancers still remain poorly defined.
Glioblastoma (GBM) is the most lethal primary malignancy in adult central nervous system.10 Despite extensive resection and the combination of postoperative chemo- and radio-therapy, the median survival of GBM patients is only 15 months.11–13 Kinases have been shown to play important roles in gliomagenesis.14–16 The understanding of kinase-related mechanism will help us to develop a new strategy against glioma.
Therefore, in this study, we sought to investigate the functions of SPKKPs in glioma. First, we examine the expression of these SPKKPs in GBM, and construct a novel secretory pathway-related gene signature to classify IDH wild type (wt) GBM survival. Then, we further examined the prognostic value of this signature in Cancer Genome Atlas (TCGA), chinese Glioma Genome Atlas (CGGA), and Gene Expression Omnibus (GEO) datasets. We confirmed family with sequence similarity 20 C (FAM20C) as the core member in this family and its potential as a prognostic marker in glioma with clinical samples and multiple datasets. FAM20C was an independent risk factor for glioma malignancy and might be a potential therapeutic target in GBM. We also identified Fibronectin 1 (FN1) as the key substrate interacting with FAM20C. Finally, the annotation of FAM20C function in GBM confirmed its role in regulating local tumor microenvironment and promoting the migration of glioma and immune cells.
Materials and Methods
Human Specimens and Ethics
This study was approved by the Ethics Committee of the First Hospital of China Medical University. The glioma samples for immunohistochemical staining were collected at the First Hospital of China Medical University from November 2016 to October 2019 (GBM 28 cases, grade III 7 cases, and grade II 3 cases). The histological diagnoses of these samples were determined by two neuropathologists in accordance with the 2016 World Health Organization (WHO) classification guidelines. Informed consent was obtained from each patient.
Construction of Secretory Pathway Related Gene Signature by the Least Absolute Shrinkage and Selection Operator (LASSO) Regression Analyses
To construct the optimal model of secretory pathway-related gene signature, LASSO regression analysis was performed with the “glmnet” packages in R/Bioconductor, as previously described.17 LASSO coefficients of 13 secretory pathway-related genes (Table S1) were calculated based on its mRNA expression value and survival data of IDH wt samples of TCGA GBM RNA-seq dataset. Cross-validation was used to select the regularization parameter. Risk score (RS) for each patient was calculated combining the expression levels of the RNAs (Expi) and LASSO coefficients (Li) as follows:

The samples were stratified into high- and low-risk group based on the median of RS.
Dataset Preparation for FAM20C Expression and Survival Analyses
TCGA (extracted from the cancer genome atlas, https://portal.gdc.cancer.gov/) and CGGA (downloaded from http://www.cgga.org.cn) glioma RNA sequencing (RNA-seq) datasets were applied for FAM20C expression and survival analyses in glioma patients. The Ivy GAP RNA-seq dataset (http://glioblastoma.alleninstitute.org/) was used for FAM20C expression analysis in different regions of GBM. The Clinical proteomic tumor analysis consortium (CPTAC) protein expression profile was download from https://proteomics.cancer.gov. Oncomine webtool (http://www.oncomine.org) was used to query FAM20C expression in cancers. Gravendeel dataset (GSE16011) was obtained from GlioVis (https://gliovis.bioinfo.cnio.es/). Single-cell RNA-seq (scRNA-seq) data was downloaded from the Gene Expression Omnibus database under the accession code GSE84465 and GSE131928. SCP393 dataset was a part of GSE131928 and could also download from the Broad Institute Single-Cell Portal. (https://portals.broadinstitute.org/single_cell/study/SCP393/single-cell-rna-seq-of-adult-and-pediatric-glioblastoma). The R package “Seurat” was applied for data standardization. Then, the plots were drawn with the given cell classification using R package “ggplot2”.
Immunohistochemistry (IHC)
The IHC staining was performed as previously described.18,19 FAM20C antibody for immunohistochemistry were purchased from Abcam (ab154740). The staining intensity was quantified with German immunohistochemical scores (GIS).20 The clinical information of samples and GIS of FAM20C immunohistochemical staining were listed in Table S2.
Cell Culture
The LN229 cells were purchased from Fenghbio (Changsha, China). Cells were maintained in high-glucose Dulbecco’s modified Eagle’s medium (DMEM; Gibco, Grand Island, NY, USA) with 10% fetal bovine serum (FBS) at 37°C under 5% CO2. THP1 cells were obtained from the Cell bank of Chinese Academy of Sciences (Shanghai, China) and cultured in RPMI-1640 medium supplemented with 10% FBS.
RNA Interference and Cell Transfection
Cells transfection was performed in 6-well plates using Lipofectamine 3000 (Thermo Fisher Scientific, Shanghai, China) according to instructions from the manufacturer. The cells were harvested after 48 h. Small interfering RNAs (siRNAs) that specifically targeted human FAM20C were purchased from Sangon Biotech (Shanghai, China). The sequences were as follows:
sense: CGGGCAAGCGCUGUUCAAATT; antisense: UUUGAACAGCGCUUGCCCGTT.
RNA Isolation and Reverse‐Transcription qPCR (RT‐qPCR)
Total RNA was isolated with TRIzol reagent (Invitrogen, Carlsbad, CA), following the manufacturer’s instructions. The RNA was then reversely transcribed into cDNA with Prime‐Script RT Master Mix (Takara, Dalian, Liaoning, China). qPCR was performed in a thermal cycler (PCR LightCycler 480; Roche, Basel, Switzerland) with SYBR Green Master Mix (Takara) under following conditions: 1 cycle of 95°C 30 s, followed by 40 cycles of a two‐step cycling program (95°C 5 s; 60°C 30 s). The mRNA expression of target genes was calculated by the 2−ΔΔCt method and normalized to 18S. The primer sequences were listed in Table S3.
Transwell and Colony Formation Assays
The invasion and migration capabilities of cells were measured with 24-well transwell plates with or without Matrigel (BD), respectively. The cells (5×10⁴ cells for migration assay; 1×10⁵ cells for invasion assay) in culture medium containing 0.2% FBS were seeding into the top chamber. For the invasion and migration assays of LN229 cells, culture medium containing 20% FBS was added into the bottom chamber. For the migration assay of THP1 cells, culture medium containing 20 μg/mL FAM20C recombinant protein (R&D Systems, 9265-FM-050) were added into the lower chamber, and phosphate-buffered saline (PBS) served as a control. After 24 h incubation, the membranes were washed with PBS, fixed using 4% paraformaldehyde, and then stained with 0.1% crystal violet solution. Cells were counted in five random fields under 100× magnification. For colony formation assay, 2000 cells were seeded into 6-well plates and cultured in culture medium containing 10% FBS. After two weeks, cells were fixed with methanol, and then stained with 0.1% crystal violet. The number of visible colonies was counted.
In vitro Cell Proliferation Assay and Apoptosis Detection
Cell growth was measured with MTS method as previously described.21 Annexin V-FITC Early Apoptosis Detection Kit #6592, cell signaling technology (CST) was employed for the apoptosis detection of LN229 cells, following the instruction from the manufacturer.
Molecular Docking
SWISS-MODEL (https://swissmodel.expasy.org/interactive/) was used for the protein structure homology-modelling of FAM20C and FN1 protein. Then, the data was uploaded to the online docking website (ZDOCK server, version 3.0.2, http://zdock.umassmed.edu/) for molecular docking.22 The scoring functions included IFACE statistical potential energy, shape complementarity, and electrostatics. The Top 1 model was applied for further analysis. PyMOL 2.3.2 (https://pymol.org/installers) was used for the visualization of molecular models to create three-dimensional structural images of FAM20C and FN1 proteins. Ligplus 2.1 (http://www.ebi.ac.uk/thornton-srv/software/LigPlus) was used to analyze hydrogen bonding and hydrophobic interactions in complexes.
Functional Analyses by Bioinformatics Methods
Genes positively correlated with FAM20C expression (r > 0.3, Pearson correlation analysis) were collected from TCGA and CGGA GBM RNA-seq, and CPTAC GBM datasets (Table S4). Kyoto Encyclopedia of Genes and Genomes (KEGG) pathway analyses were carried out using R package “GOplot”. After patients were stratified into two groups according to the median value of FAM20C mRNA expression in indicated datasets, gene set enrichment analysis (GSEA) was applied to examine whether the identified gene sets showed significant different enrichment between these two sample groups.23 Gene set variation analysis (GSVA, http://www.bioconductor.org) was used to further verify whether FAM20C were associated with specific signaling pathways.24 Tumor purity, immune score, and stromal score were calculated with R package “estimate” as previously described.25 xCell cell types enrichment (https://xcell.ucsf.edu/)26 and Estimate the Proportion of Immune and Cancer cells (EPIC, https://gfellerlab.shinyapps.io/EPIC_1-1/)27 analyses were employed to evaluate the relationship between FAM20C expression and immune cell subpopulations.
Statistical Analysis
GraphPad Prism 8 (GraphPad Software Inc., La Jolla, CA) and R (version 3.6.2; R packages: pheatmap, corrplot) were used for statistical analyses and generating figures. Statistical significance was defined as P value < 0.05. The quantitative differences between and among groups were determined by two‐tailed t-test and one‐way analysis of variance (ANOVA) followed by Turkey posttest, respectively. The univariate Cox regression analyses were carried out with R (version 3.6.2). The receiver operator characteristic (ROC) curve was plotted by Medcalc 19.0.7 (www.medcalc.org). Survival analyses were performed with Kaplan–Meier method followed by the log‐rank test.
Results
The Construction of SPKKPs Signature for IDH Wt GBM
The SPKKPs phosphorylate a series of substrates, which play important roles in multiple physiological processes.2–4,6–9 According to previous reports, we summarized a list of 13 SPKKPs family members (Table S1).6,7 Then, LASSO regression analysis was performed to construct a signature based on their expression and association with GBM IDH wt patients’ survival. Considering collinearity and following refinement, 3 genes (FAM20A, FAM20C, C3orf58) were finally selected for the following risk score formula based on their individual coefficients and expression level (Figure 1A and B): Risk Score = (0.1445 * FAM20A expression value) + (0.0289 * FAM20C expression value) + (−0.1790 * C3orf58 expression value). The GBM IDH wt samples in TCGA were subsequently stratified into low- and high-risk groups. These two groups had distinct pathological characteristics (MGMT promoter methylation status and subtypes, Figure 1C) and prognosis (Figure 1D, and Figure S1A and B). Furthermore, FAM20A and FAM20C expression increased and C3orf58 expression decreased with WHO grades of glioma (Figure 1E, and Figure S1C). All of these three genes had an elevated expression in IDH wt GBM than IDH mutant (mut) GBM (Figure 1F, and Figure S1D). In low-grade glioma (LGG), their expression was higher in LGG without 1p19q codeletion (non-codel) than LGG with 1p19q codeletion (codel) (Figure 1G, and Figure S1E). Collectively, these data suggest important prognostic value of SPKKPs family members in glioma, and the signature constructed on 3 member gene expression (FAM20A, FAM20C, C3orf58) could effectively distinguish IDH wt GBM patients’ survival.
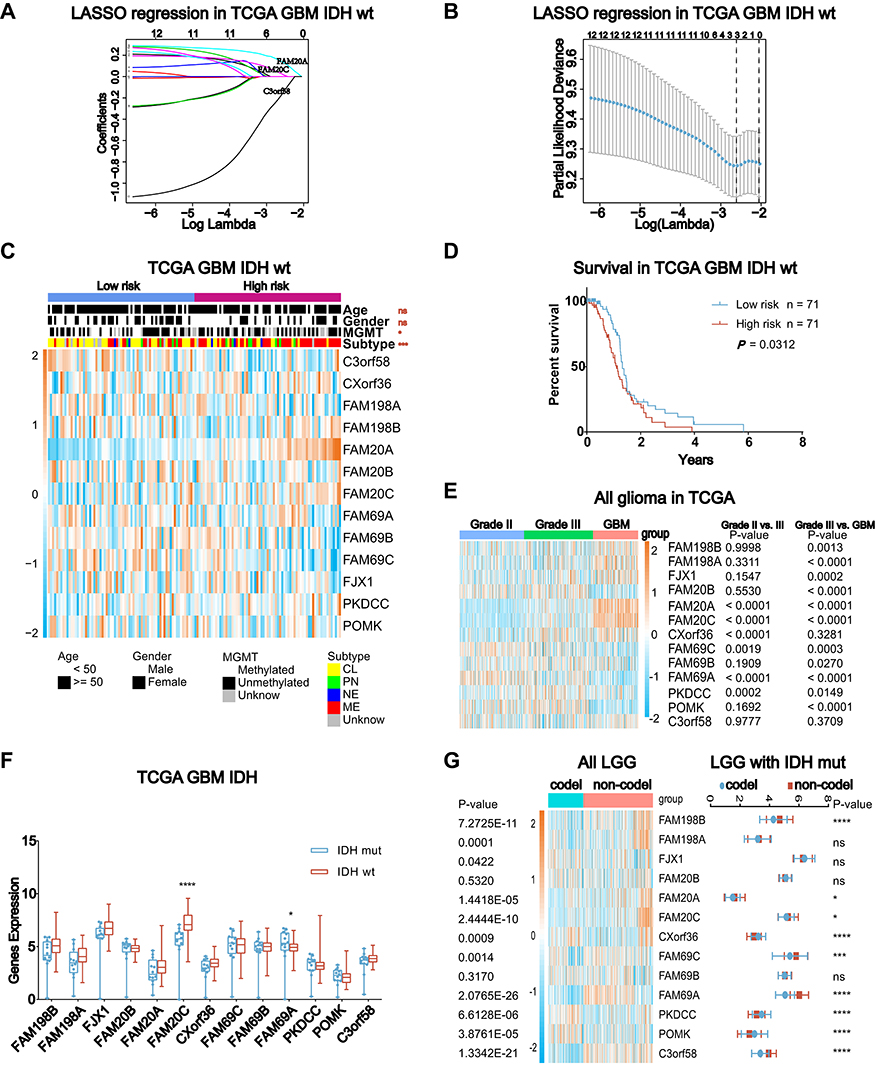 |
Figure 1 The development of secretory pathway kinase or kinase-like proteins (SPKKPs) gene signature stratifies the IDH wild type (wt) GBM as two groups with distinct survival. (A) The coefficient profiles of 13 SPKKPs genes with the gradual increase of lambda by LASSO regression (TCGA GBM RNA-seq, IDH wt, n = 142). (B) LASSO regression analysis with cross-validation method identified a SPKKPs gene signature including 3 members in this family (FAM20A, FAM20A, and C3orf58) with prognostic value in IDH wt GBM (TCGA, n = 142). (C) Heatmap showing the association of 13 SPKKPs gene expression with clinicopathologic features in low- and high-risk GBM groups defined by the secretory pathway kinase related gene signature (TCGA GBM RNA-seq: low risk: n = 71, high risk: n = 71, Chi-square test). (D) Kaplan–Meier curves describing the survival of IDH wt GBM in low- and high-risk groups defined by secretory pathway-related gene signature (TCGA GBM RNA-seq: low risk: n = 71, high risk: n = 71, Log rank test, P = 0.0312). (E) The expression of SPKKPs member genes in different WHO grades of glioma (TCGA RNA-seq: grade II: n = 260, grade III: n = 267, GBM: n = 168, one-way ANOVA). (F) The expression of SPKKPs member genes in GBM with different IDH status (TCGA GBM RNA-seq: IDH mutant (mut): n = 11, IDH wt: n = 144, t-test). (G) The expression of SPKKPs member genes in all low-grade gliomas (LGG) and IDH-mut LGG with different 1p/19q codeletion (codel) status (TCGA RNA-seq: LGG 1p19q codel: n = 160, LGG 1p19q non-codel: n = 317; LGG with IDH mut 1p19q codel: n = 160, LGG with IDH mut 1p19q non-codel: n = 230, t-test). (ns P > 0.05, *P < 0.05, ***P < 0.001, and ****P < 0.0001). |
The Analysis of SPKKPs Family Members in Glioma Identifies FAM20C as the Core Member in Glioma
To understand the interactions among these thirteen proteins, we further analyzed the interactions and correlations among these proteins with STRING. The result showed that FAM20C was the core protein in this family, which had most active interactions with other SPKKPs members, including FAM20A, FAM198A, PKDCC, and FAM198B (Figure 2A). Moreover, FAM20C expression was significantly positive correlated with FAM20A, FJX1 and FAM198B, and negative correlated with POMK (Figure 2B). These findings were consistent with the data shown in Figure 1A: FAM20A and FAM20C expression were positively correlated with the grades of gliomas. Similar results were obtained from CGGA RNA-seq dataset (Figure S2A). We further performed univariate Cox regression analysis with the survival data of glioma patients from TCGA and CGGA datasets. FAM20C was identified as the member of SPKKPs family with highest hazard ratio correlated with unfavorable survival of glioma (Figure 2C, and Figure S2B). These data indicated FAM20C as the core member of SPKKPs family in glioma. To extend the above observations, Oncomine was employed to analyze FAM20C expression in different types of cancers. The result showed that multiple solid tumors, including brain, breast, cervical, colorectal, esophageal, and pancreatic cancers, had an elevated FAM20C expression (Figure 2D).
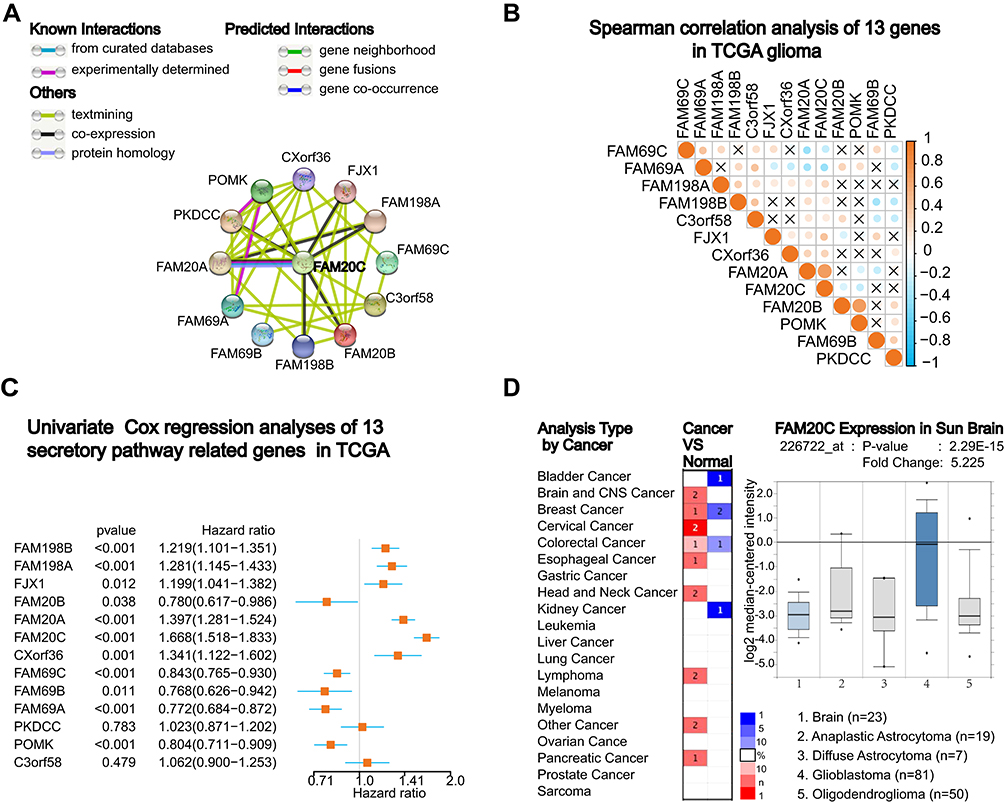 |
Figure 2 Integrative transcriptomic analyses identify FAM20C as the core member of secretory pathway kinase or kinase-like proteins (SPKKPs) family in glioma. (A) The protein interaction analysis among SPKKPs member genes with STRING (https://string-db.org). Dark green and pink lines represent known interactions. Green, red, and blue lines represent predicted interactions. Light green, black and gray lines represent other interactions. (B and C) Spearman correlation (B), the circle size represents correlation strength, and the color represents the positive (orange) or negative (blue) correlation and the univariate Cox regression analyses (C) of secretory pathway-related genes in TCGA glioma RNA-seq dataset. (D) Oncomine analysis of FAM20C expression in indicated cancers (The number in red represents the number of datasets demonstrating elevated FAM20C expression in indicated cancers. The number in blue represents the number of datasets showing decreased FAM20C expression in indicated cancers. The intensity of the color means the level of P value). |
FAM20C Serves as a Marker for Progressive Malignancy and Poor Survival in Glioma
Next, we investigated whether FAM20C expression was associated with histopathological grades of glioma. We performed immunohistochemical staining of FAM20C on 38 different grades of glioma samples. Elevated FAM20C expression was observed in GBM compared with LGG (Figure 3A). Higher FAM20C expression also indicated a shorter survival in GBM (Figure 3B). Similar results were obtained from TCGA (Figure 3C and D), CGGA (Figure S3A and B), and CPTAC datasets (Figure 3E and F). Furthermore, the analysis of IVY GBM dataset showed that FAM20C expression was enriched in peri-necrotic zone and pseudo-palisade cells surrounding tumor necrosis zone (Figure 3G). Similar results were observed in the IHC staining of clinical GBM samples (Figure 3H). Mesenchymal GBM was a more aggressive subtype than other subtypes of GBM.28,29 We further characterized the expression preference of FAM20C in three previously defined subtypes of GBM.30 As expected, the mesenchymal subtype exhibited a higher expression level of FAM20C than other subtypes (Figure 3I and Figure S3C), and higher FAM20C expression can serve as a diagnostic marker for mesenchymal subtype (Figure 3J and Figure S3D). Moreover, IDH wt GBM had a higher FAM20C expression level than their IDH mutantt counterparts (Figure 3K, and Figure S3E). High FAM20C expression also implied a poor 2-year survival for IDH wt GBM (Figure 3L, and Figure S3F). To investigate the correlation of FAM20C expression with representative clinical characteristics (age, IDH status, 1p19q deletion) in glioma, we conducted univariate and multivariate Cox regression analyses. The result showed that FAM20C was an independent risk factor for the overall survival of glioma patients (Table S5). This was complemented with a comparison of the sensitivity and specificity of FAM20C as a predictive marker for 3‐year, and 5‐year patient survival with routine prognostic factors (age, IDH status, and 1p19q), which indicated that FAM20C could be used as a better molecule to predict glioma patients’ survival than these factors (Figure 3M, and Figure S3G). Based on the above findings indicating that FAM20C was preferentially expressed in IDH wt and mesenchymal GBM, we speculated that patients with higher expression of FAM20C may be more resistant to routine radio- and chemo-therapy. As shown in Figure 3N and O and Figure S3H–I, lower FAM20C expression implied a better survival in GBM patients with radio- and chemo-therapy. Additionally, the prognosis of GBM with high FAM20C expression was significantly worse than GBM with low FAM20C expression in both primary and recurrent tumors (Figure S3J and K). Collectively, these data implied that FAM20C expression was elevated in glioma and highlighted the potential of FAM20C as a marker for progressive malignancy and unfavorable survival in glioma.
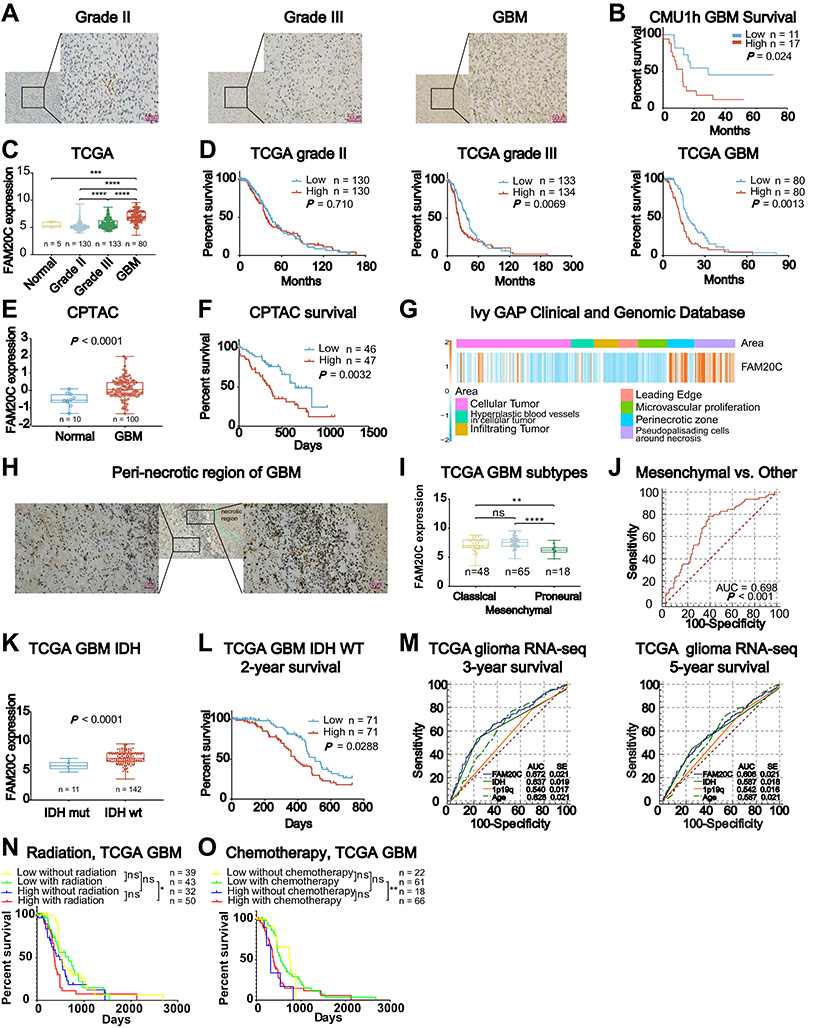 |
Figure 3 FAM20C is associated with progressive malignancy and unfavorable prognosis in glioma. (A) Representative immunohistochemical images of FAM20C staining in clinical glioma samples (Scale bar, 50 μm; grade II: n = 3, grade III: n = 7, grade IV: n=28). (B) Kaplan–Meier curve evaluating the correlation between FAM20C protein expression and GBM patients’ survival (FAM20C low vs high, low n = 11, high n = 17, P = 0.0241; Log rank test). (C) The analyses of FAM20C expression in non-tumor and different grade glioma samples (TCGA glioma RNA-seq: non-tumor, n = 5; grade II: n = 130; grade III: n = 133; GBM: n = 80, one-way ANOVA). (D) Kaplan–Meier curves of FAM20C expression and the survival of different grade glioma in TCGA. (left panel: grade II, low n = 130, high n = 130, P = 0.710; middle panel: grade III, low n = 133, high n = 134, P = 0.0069; right panel: GBM, low n = 80, high n = 80, P = 0.0013, Log rank test). (E) The analysis of FAM20C expression in non-tumor and GBM samples using data from Clinical Proteomic Tumor Analysis Consortium (CPTAC, non-tumor, n = 10; GBM, n = 100, P < 0.0001, t-test). (F) Kaplan–Meier curves of FAM20C expression and GBM patients’ survival in CPTAC. (high: n = 46, low: n = 47, P = 0.0032, Log rank test) (G) The analysis of FAM20C expression in different regions of GBM with data from the IVY GBM Altas Project (http://glioblastoma.alleninstitute.org/). (H) Representative immunohistochemical images of FAM20C staining in peri-necrotic region of GBM. (Scale bar, 50 μm). (I) The analyses of FAM20C expression in different subtypes GBM (TCGA GBM RNA-seq: classical n = 48; mesenchymal n = 65; proneural n = 18, one-way ANOVA). (J) The receiver operator characteristic (ROC) curve describing the sensitivity and specificity of FAM20C as a marker for mesenchymal (n = 65) vs other subtypes (classical n = 48, and proneural n = 18) in TCGA. (K) FAM20C expression analysis in GBM with different IDH status (TCGA GBM RNA-seq: IDH mut, n = 11; IDH wt, n = 143, P < 0.0001, t-test). (L) Kaplan‐Meier curve describing the association between FAM20C expression and GBM IDH wt patients’ 2-year survival (TCGA, low n = 71, high n = 71, P = 0.0288, Log rank test). (M) The ROC curves comparing the sensitivity and specificity of FAM20C as a prognostic marker for glioma patients in TCGA (left panel: 3‐year; right: 5‐year). (N and O) Kaplan–Meier curves describing the association between FAM20C expression and TCGA GBM patients’ survival with or without radiation (N) or chemotherapy (O) (N: low without radiation n = 39, low with radiation n = 43; high without radiation n = 32, high with radiation n = 50; (O) low without chemotherapy n = 22, low with chemotherapy n = 61; high without chemotherapy n = 18, high with chemotherapy n = 66, Log rank test). (ns P > 0.05, *P < 0.05, **P < 0.01, ***P < 0.001, and ****P < 0.0001). |
Suppression of Glioma Migration and Clone-Formation by FAM20C Knockdown
To illustrate the functions of FAM20C in GBM, we calculated GSEA enrichment score to analyze the phenotype enriched with high FAM20C expression. GSEA showed that a high level of FAM20C expression was positively correlated with the regulations of immune response and cell adhesion (Figure 4A, and Figure S4A). This was further confirmed by analyzing the correlation between FAM20C and genes included in the gene sets of negative regulation of immune response and positive regulation of cell adhesion (Figure 4B, and Figure S4B). We also summarized the genes positively correlated with high FAM20C expression in TCGA, CGGA, and CPTAC datasets (Pearson r > 0.3, Table S4). KEGG analysis of these three datasets revealed that high FAM20C expression was associated with TNF and IL-17 signaling pathway (Figure 4C, and Figure S4 C and D), which had been proved to function in promoting cell migration and regulating immune response.31–33 Based on these observations, we further assessed the effects of FAM20C deletion on glioma cell migration, invasion, proliferation, and apoptosis. The knock-down of FAM20C by siRNA substantially decreased the mRNA expression of matrix metalloproteinases 2 (MMP-2) and MMP-9, two well-known tumor invasion markers (Figure 4D). In consistent with this result, FAM20C-knockdown significantly decreased the migration, invasion, and clone formation abilities of LN229 cells (Figure 4E and F), whereas their proliferation and apoptosis were not inhibited by FAM20C deletion (Figure S4E and F).
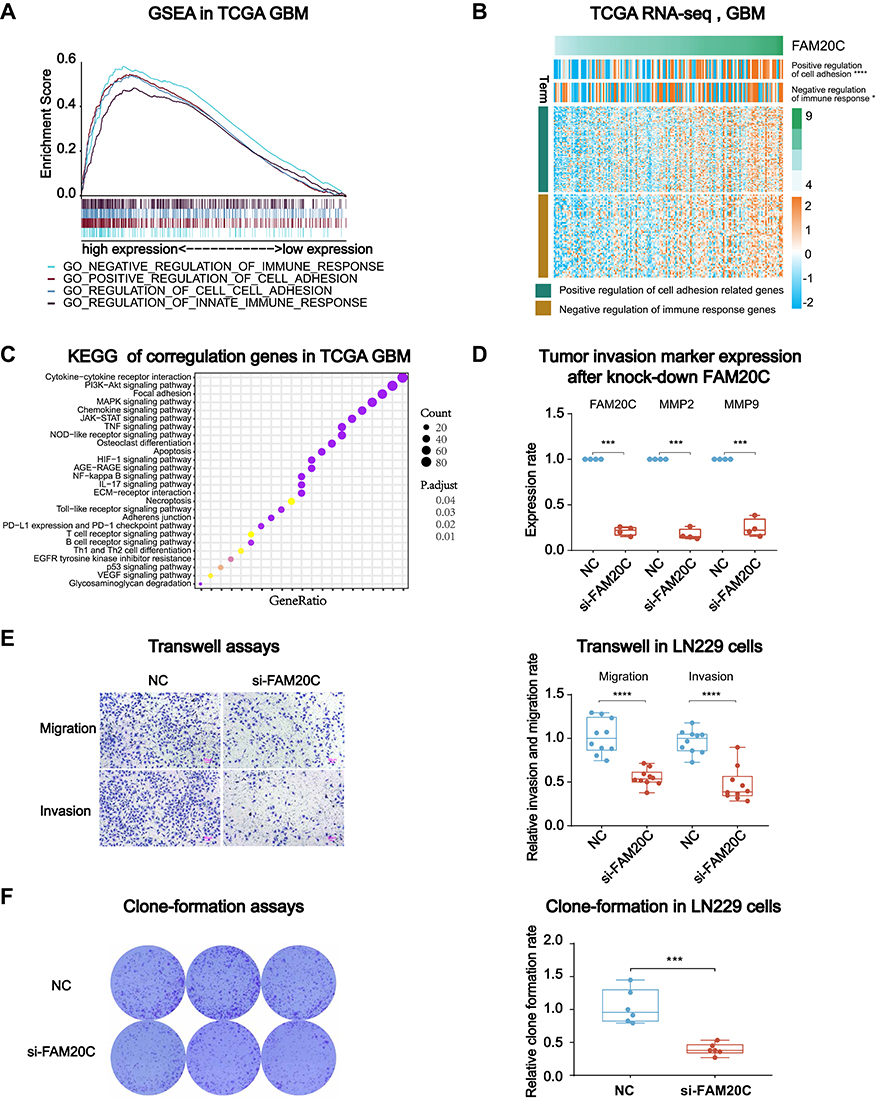 |
Figure 4 FAM20C knockdown suppresses the migration, invasion, and colony formation of GBM cells. (A) GSEA with TCGA GBM RNA-seq dataset disclosed a significant enrichment of cell adhesion- and immune response-related phenotypes in GBM patients with high FAM20C expression. (B) Heat maps describing the association between FAM20C expression and cell adhesion and negative immune-regulation‐related genes in TCGA GBM RNA-seq dataset (Chi-square test). (C) KEGG analysis was performed on genes with a correlation coefficient greater than 0.3 (Spearman analysis) with FAM20C in TCGA GBM RNA-seq dataset. (D) qPCR analyses of FAM20C, MMP2, and MMP9 mRNA expression in LN229 cells transfected with siRNA targeting FAM20C or a non-targeting control (n = 4, t-test). (E) Transwell assays demonstrating FAM20C knock-down inhibited the migration (upper panel) and invasion (lower panel) capabilities of LN229 cells (n = 10, t-test). (F) The colony formation assay showing FAM20C knock-down significantly inhibited the colony formation capability of LN229 cells. (n = 6, t-test). (*P < 0.05, ***P < 0.001, and ****P < 0.0001). |
The Expression Analyses of FAM20C and Its Substrates in GBM Identify FN1 Was the Key Substrate for FAM20C in GBM
FAM20C has been reported as the kinase responsible for generating multiple secreted phosphor-proteome, including substrates drive tumor cell migration.6 In order to further analyze the functional mechanism of FAM20C in GBM, we summarized a list of its phosphorylation substrates from a published paper, including BMP4, CALU, CST3, FN1, IGFBP3, NUCB1, PCSK9, PRKCSH, and RCN1.6 The interactions between FAM20C and these substrates were validated by text mining in STRING (Figure 5A). Univariate Cox regression analysis with TCGA and CGGA demonstrated that, among FAM20C substrates, CALU, FN1, and IGFBP3 were the risk factors for GBM survival (Figure 5B, and Figure S5A). Spearman correlation analyses further confirmed that FN1 was the substrate which had the highest positive correlation with FAM20C in GBM (Figure 5C and D, and Figure S5B and C). These data suggested that FN1 was the important substrate for FAM20C in GBM. Moreover, we employed molecular docking method to simulate the binding mode between FAM20C and FN1 protein (Figure 5E). Then, PyMOL 2.3.2 and Ligplus 2.1 were used to display the binding mode of FAM20C and FN1. As shown in Figure 5F, the docking results demonstrated that the amino acids (Pro200, Asn185, Trp202, Ala219, and Glu217) in FAM20C protein bind to the amino acids (Arg550, Gly551 and Arg552) in FN1 protein through hydrogen bonding interaction. Together, these results showed that FAM20C can function by combining with FN1, which had previously been shown to promote glioma cell migration and invasion.
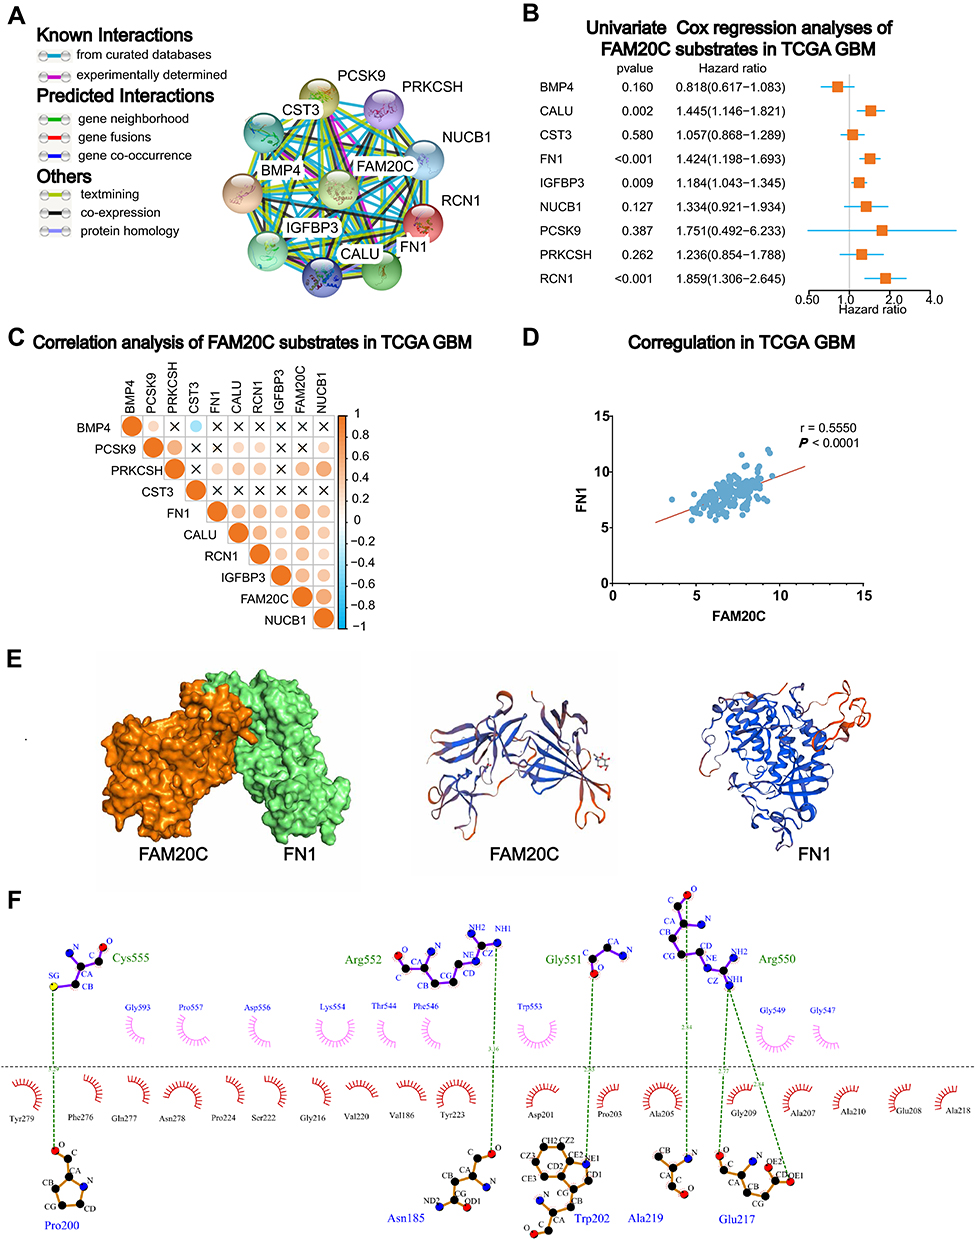 |
Figure 5 The screening of FAM20C substrates in GBM distinguishes FN1 as the key substrate interacting with it. (A) The analyses of protein interactions between FAM20C and its substrates by STRING webtool (https://string-db.org). (B) The univariate Cox regression analyses of FAM20C substrates in TCGA GBM RNA-seq dataset. (C) Pearson correlation analysis between FAM20C and its substrates (TCGA GBM RNA-seq dataset: circle size represents the correlation strength, and color represents the positive (orange) or negative (blue) correlation). (D) Pearson correlation analysis between FAM20C and FN1 in TCGA GBM RNA-seq dataset. (E) Three-dimensional binding pattern of FAM20C and FN1 protein obtained by molecular docking simulation. (F) The interaction site between FAM20C and FN1. |
FAM20C Mediates the Disrupted Immune Response in GBM and Promoted the Migration of Immune Cells
The tumor microenvironment (TME) of GBM relates to significant inter- and intra-tumoral genetic instability and resultant heterogeneity. This generates diverse aberrant signaling pathways within and across tumors, and contribute actively to tumor progression and therapeutic resistance.34 Our previous study found that tumor purity was negatively correlated with glioma malignancy, while stromal and immune score were positively associated with it.25 According to TCGA and CGGA, FAM20C was negatively correlated with tumor purity and positively correlated with stromal and immune score in GBM (Figure 6A, and Figure S6A). Since GSEA revealed that FAM20C mediated negative regulation of immune response (Figure 4A), we further performed xCell and EPIC analyses to explore whether high FAM20C expression increased the infiltration of immune cells. The result showed that GBM with higher FAM20C expression had more infiltrating monocytes and macrophages in their TME, in comparison with GBM with lower FAM20C expression (Figure 6B, and Figure S6B). The analyses of scRNA-seq GBM data showed similar results. FAM20C was mainly expressed by glioma cells and macrophages (Figure 6C and D, and Figure S6C and D). Additionally, in vitro migration assay demonstrated that FAM20C substantially promoted the migration of THP1 cells (Figure 6E). Collectively, these data suggest a crucial role of FAM20C in mediating the disrupted immune response of GBM.
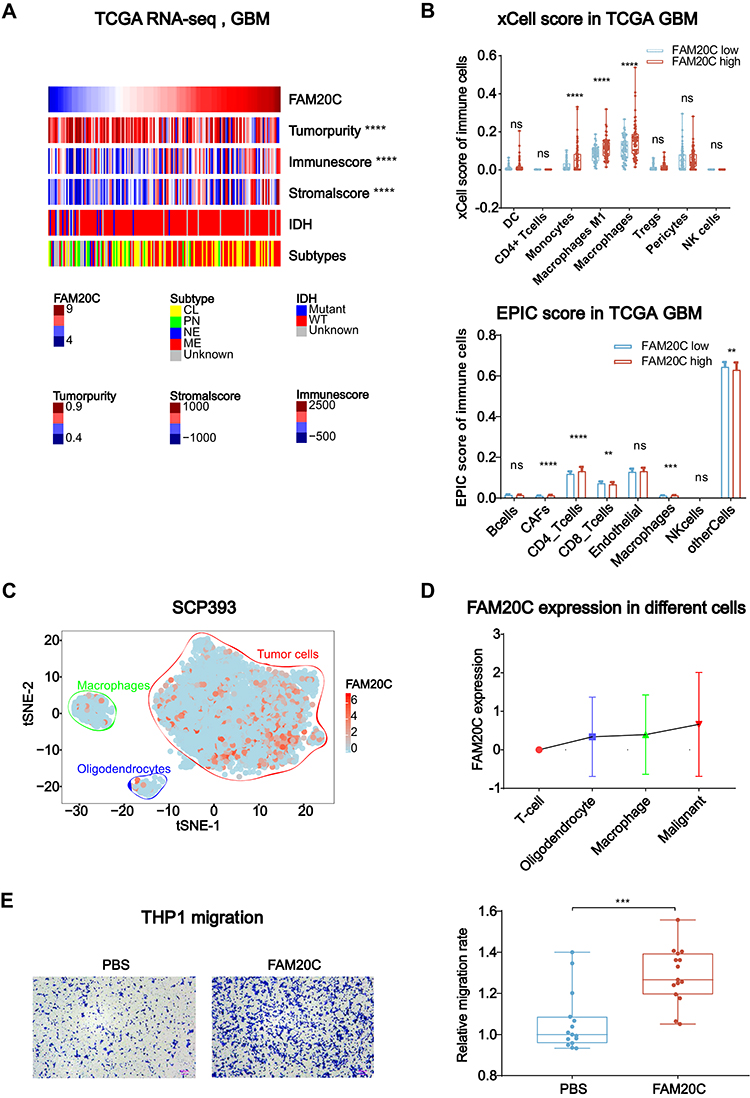 |
Figure 6 FAM20C is associated with the regulation of immune response in GBM. (A) Heat maps describing the expression of FAM20C negatively correlated with tumor purity, and positively correlated with immune score and stromal score (TCGA GBM RNA-seq, n = 168, Pearson correlation analysis). (B) The analyses of xCell (upper panel) and EPIC scores (lower panel) indicating FAM20C expression pattern in indicated cell populations (TCGA GBM RNA-seq: FAM20C low n = 84; high n = 84, t-test). (C and D) t-SNE map color-coded for transcript counts (C) and the corresponding single-cell bar plots (D) of FAM20C enriched in different cell subpopulations of GBM (SCP393 dataset, https://portals.broadinstitute.org/single_cell/study/SCP393/single-cell-rna-seq-of-adult-and-pediatric-glioblastoma). (E) Transwell assay showing 20 μg/mL FAM20C recombinant protein significantly enhances the migration of THP1 cells. (n = 15, t-test). (ns P > 0.05, **P < 0.01, ***P < 0.001, and ****P < 0.0001). |
Discussion
Malignant progression and high recurrence rate render GBM the most lethal type of primary brain tumor.35–37 In this study, we construct a 3-gene SPKKPs signature which could efficiently evaluate the risk of GBM patients and stratified these patients into two subgroups with distinct survival and clinicopathological features (MGMT promoter methylation status and subtypes). Several studies have shown the regulatory roles of SPKKPs family members in cancer biology. FAM198A mutation is related to drug resistance in non-small cell lung cancer,38 whereas high FAM198B expression is associated with prolonged survival and inhibits metastasis in lung adenocarcinoma.39 FAM20C could significantly affect the migration of breast cancer cells.6 These findings suggested that the members of SPKKPs family may have distinct functions in different cancers.
GBM is characterized by its infiltrative growth pattern and recurrence even after aggressive resection and a combination of post-operative chemo- and radio-therapy. Thus, identifying potential molecule promoting the invasiveness of GBM cells may help us develop a new strategy against glioma. Interestingly, the knock-down of FAM20C effectively inhibits the migration and invasion of glioma cells. We also find that FAM20C, as the core member of SPKKPs family, is an independent risk factor for progressive malignancy and poor survival of GBM. These data indicate that FAM20C may serve as a novel therapeutic target for GBM. To our knowledge, this is the first study that evaluates the expression and the function of FAM20C in GBM. The close relation between FAM20C and the survival of GBM with radiation and chemotherapy suggests GBM patients may benefit from therapeutic strategies combining routine radiation/chemotherapy and inhibition of FAM20C. We also identified FN1 as the key substrate interacting with FAM20C, which could promote glioma cell migration and invasion.40,41 Phosphoprotein histology studies have shown that more than two-thirds phosphoproteome of human serum,42 plasma,43 cerebrospinal fluid44 contain phosphorus in Ser-x-Glu/pSer motif, which could be phosphorylated by FAM20C. Further functional and mechanistic studies will be needed to elucidate the precise role of FAM20C in the tumorigenicity of glioblastoma.
Monocytes are recruited to primary or metastatic tumors where they differentiate to TAMs and promote tumor metastasis and progression.45 Increased TAMs in TME have been shown to associated with poor clinical outcomes in many human cancers.46 Another important set of findings in this study is that FAM20C is closely related to stromal and immune cell populations, especially macrophages. Additionally, in vitro data proved that FAM20C significantly increased the migration of THP-1 cells. This may help us to understand the mechanism of TAMs infiltration in GBM. Based on these observations, we hypothesized that FAM20C may participate in regulating cell adhesion and immune response in TME of GBM. Future studies are still needed to clarify the mechanisms of FAM20C regulating TME of GBM.
In conclusion, we firstly established a prognosis signature for GBM IDH wt patients based on 3 member genes (FAM20A, FAM20A, and C3orf58) of SPKKPs. This signature could efficiently stratify these patients into two groups with distinct survival. Secondly, we identified the core role of FAM20C in this family. Its elevated expression not only indicated the progressive malignancy and poor survival of glioma patients, but also disclosed a significant enrichment of cell adhesion- and immune response-related phenotypes in GBM. Furthermore, we identified FN1 can bind to FAM20C through multiple sites as a functional substrate. Moreover, FAM20C promoted the migration of glioma and THP-1 cells. Taken together, these results suggest FAM20C as a possible target in developing new therapeutic strategies against GBM. Inhibition of FAM20C may be a viable therapeutic strategy to prevent glioma cells progression and malignant progression.
Acknowledgment
We thank all the members in Dr A. H. Wu’s lab for the helpful discussion about our study.
Author Contributions
S.N. Du, P. Cheng, and A.H. Wu. conceived and designed the study. S.N. Du, Q. Guo., C. Zhu, J.Y. Cao. carried out the experiments and collected data, S.N. Du, S. Guan., W. Cheng performed the bioinformatics analysis. S.N. Du, P. Cheng, G.F. Guan, and A.H. Wu drafted the manuscript. P. Cheng and A.H. Wu obtained funding for the study. All authors made a significant contribution to the work reported, whether that is in the conception, study design, execution, acquisition of data, analysis and interpretation, or in all these areas: took part in drafting, revising or critically reviewing the article; gave final approval of the version to be published; have agreed on the journal to which the article has been submitted; and agree to be accountable for all aspects of the work.
Funding
This work was supported by the National Natural Science Foundation of China (no. 81872054 to A. Wu, and no. 81872057 to P. Cheng), Natural Science Foundation of Liaoning Province (no.20180550063 to P. Cheng), and Liaoning Science and Technology Plan Projects (no. 2011225034 to A. Wu).
Disclosure
The authors declare no conflicts of interest.
References
1. Tagliabracci VS, Engel JL, Wen J, et al. Secreted kinase phosphorylates extracellular proteins that regulate biomineralization. Science. 2012;336:1150–1153. doi:10.1126/science.1217817
2. Manning G. The protein kinase complement of the human genome. Science. 2002;298:1912–1934. doi:10.1126/science.1075762
3. Tagliabracci VS, Pinna LA, Dixon JE. Secreted protein kinases. Trends Biochem Sci. 2013;38:121–130. doi:10.1016/j.tibs.2012.11.008
4. Tagliabracci VS, Xiao J, Dixon JE. Phosphorylation of substrates destined for secretion by the Fam20 kinases. Biochem Soc Trans. 2013;41:1061–1065. doi:10.1042/BST20130059
5. Sreelatha A, Kinch LN, Tagliabracci VS. The secretory pathway kinases. Biochimica et Biophysica Acta. 2015;1854:1687–1693. doi:10.1016/j.bbapap.2015.03.015
6. Tagliabracci VS, Wiley SE, Guo X, et al. A single kinase generates the majority of the secreted phosphoproteome. Cell. 2015;161:1619–1632. doi:10.1016/j.cell.2015.05.028
7. Zhang H, Zhu Q, Cui J, et al. Structure and evolution of the FAM20 kinases. Nat Commun. 2018;9:1218. doi:10.1038/s41467-018-03615-z
8. Ishikawa HO, Takeuchi H, Haltiwanger RS, Irvine KD. Four-jointed is a golgi kinase that phosphorylates a subset of cadherin domains. Science. 2008;321:401–404. doi:10.1126/science.1158159
9. Koike T, Izumikawa T, Tamura J-I, Kitagawa H. FAM20B is a kinase that phosphorylates xylose in the glycosaminoglycan–protein linkage region. Biochem J. 2009;421:157–162. doi:10.1042/BJ20090474
10. Sun L-H, Yang F-Q, Zhang C-B, et al. Overexpression of paxillin correlates with tumor progression and predicts poor survival in glioblastoma. CNS Neurosci Ther. 2017;23:69–75. doi:10.1111/cns.12606
11. Wen PY, Kesari S. Malignant gliomas in adults. N Engl J Med. 2008;359:492–507. doi:10.1056/NEJMra0708126
12. Stupp R, Hegi ME, Mason WP, et al. Effects of radiotherapy with concomitant and adjuvant temozolomide versus radiotherapy alone on survival in glioblastoma in a randomised Phase III study: 5-year analysis of the EORTC-NCIC trial. Lancet Oncol. 2009;10:459–466. doi:10.1016/S1470-2045(09)70025-7
13. Chinot OL, Wick W, Mason W, et al. Bevacizumab plus radiotherapy–temozolomide for newly diagnosed glioblastoma. N Engl J Med. 2014;370:709–722. doi:10.1056/NEJMoa1308345
14. Cheng P, Phillips E, Kim S-H, et al. Kinome-wide shRNA screen identifies the receptor tyrosine kinase AXL as a key regulator for mesenchymal glioblastoma stem-like cells. Stem Cell Rep. 2015;4:899–913. doi:10.1016/j.stemcr.2015.03.005
15. Furnari FB, Cloughesy TF, Cavenee WK, Mischel PS. Heterogeneity of epidermal growth factor receptor signalling networks in glioblastoma. Nat Rev Cancer. 2015;15(5):302–310. doi:10.1038/nrc3918
16. Pattwell SS, Arora S, Cimino PJ, et al. A kinase-deficient NTRK2 splice variant predominates in glioma and amplifies several oncogenic signaling pathways. Nat Commun. 2020;11(1):2977. doi:10.1038/s41467-020-16786-5
17. Friedman J, Hastie T, Tibshirani R. Regularization paths for generalized linear models via coordinate descent. J Stat Softw. 2010;33:1–22. doi:10.18637/jss.v033.i01
18. Wang J, Cheng P, Pavlyukov MS, et al. Targeting NEK2 attenuates glioblastoma growth and radioresistance by destabilizing histone methyltransferase EZH2. J Clin Invest. 2017;127:3075–3089. doi:10.1172/JCI89092
19. Cheng P, Wang J, Waghmare I, et al. FOXD1-ALDH1A3 signaling is a determinant for the self-renewal and tumorigenicity of mesenchymal glioma stem cells. Cancer Res. 2016;76:7219–7230.
20. Remmele W, Schicketanz K-H. Immunohistochemical determination of estrogen and progesterone receptor content in human breast cancer. Pathol Res Pract. 1993;189:862–866. doi:10.1016/S0344-0338(11)81095-2
21. Riss TL, Moravec RA, Niles AL, et al. Cell viability assays. Assay Guidance Manual. 2004.
22. Pierce BG, Wiehe K, Hwang H, Kim B-H, Vreven T, Weng Z. ZDOCK server: interactive docking prediction of protein-protein complexes and symmetric multimers. Bioinformatics. 2014;30:1771–1773. doi:10.1093/bioinformatics/btu097
23. Subramanian A, Tamayo P, Mootha VK, et al. Gene set enrichment analysis: a knowledge-based approach for interpreting genome-wide expression profiles. Proc Natl Acad Sci U S A. 2005;102:15545–15550. doi:10.1073/pnas.0506580102
24. Hänzelmann S, Castelo R, Guinney J. GSVA: gene set variation analysis for microarray and RNA-Seq data. BMC Bioinform. 2013;14:7. doi:10.1186/1471-2105-14-7
25. Zhang C, Cheng W, Ren X, et al. Tumor purity as an underlying key factor in glioma. Clin Cancer Res. 2017;23:6279–6291. doi:10.1158/1078-0432.CCR-16-2598
26. Aran D, Hu Z, Butte AJ. xCell: digitally portraying the tissue cellular heterogeneity landscape. Genome Biol. 2017;18:220. doi:10.1186/s13059-017-1349-1
27. Racle J, de Jonge K, Baumgaertner P, Speiser DE, Gfeller D. Simultaneous enumeration of cancer and immune cell types from bulk tumor gene expression data. eLife. 2017;6. doi:10.7554/eLife.26476
28. Bhat KPL, Balasubramaniyan V, Vaillant B, et al. Mesenchymal differentiation mediated by NF-κB promotes radiation resistance in glioblastoma. Cancer Cell. 2013;24:331–346. doi:10.1016/j.ccr.2013.08.001
29. Tan MSY, Sandanaraj E, Chong YK, et al. A STAT3-based gene signature stratifies glioma patients for targeted therapy. Nat Commun. 2019;10(1):3601. doi:10.1038/s41467-019-11614-x
30. Verhaak RGW, Hoadley KA, Purdom E, et al. Integrated genomic analysis identifies clinically relevant subtypes of glioblastoma characterized by abnormalities in PDGFRA, IDH1, EGFR, and NF1. Cancer Cell. 2010;17:98–110. doi:10.1016/j.ccr.2009.12.020
31. Jiang Y, Zhou J, Zhao J, et al. MiR-18a-downregulated RORA inhibits the proliferation and tumorigenesis of glioma using the TNF-α-mediated NF-κB signaling pathway. EBioMedicine. 2020;52:102651. doi:10.1016/j.ebiom.2020.102651
32. Ma S, Cheng Q, Cai Y, et al. IL-17A produced by γδ T cells promotes tumor growth in hepatocellular carcinoma. Cancer Res. 2014;4:1969–1982. doi:10.1158/0008-5472.CAN-13-2534
33. Wang B, Zhao C‐H, Sun GS. IL‐17 induces the proliferation and migration of glioma cells through the activation of PI3K/Akt1/NF‐κB‐p65. Cancer Lett. 2019;447:
34. Quail DF, Joyce JA. The microenvironmental landscape of brain tumors. Cancer Cell. 2017;31:326–341. doi:10.1016/j.ccell.2017.02.009
35. Chai R, Zhang K, Wang K, et al. A novel gene signature based on five glioblastoma stem-like cell relevant genes predicts the survival of primary glioblastoma. J Cancer Res Clin Oncol. 2018;144:439–447. doi:10.1007/s00432-017-2572-6
36. Jiang T, Mao Y, Ma W, et al. CGCG clinical practice guidelines for the management of adult diffuse gliomas. Cancer Lett. 2016;375:263–273. doi:10.1016/j.canlet.2016.01.024
37. Chai RC, Zhang KN, Liu YQ, et al. Combinations of four or more CpGs methylation present equivalent predictive value for MGMT expression and temozolomide therapeutic prognosis in gliomas. CNS Neurosci Ther. 2019;25:314–322. doi:10.1111/cns.13040
38. van der Wekken AJ, Kuiper JL, Saber A, et al. Overall survival in EGFR mutated non-small-cell lung cancer patients treated with afatinib after EGFR TKI and resistant mechanisms upon disease progression. PLoS One. 2017;12:e0182885. doi:10.1371/journal.pone.0182885
39. Hsu C-Y, Chang G-C, Chen Y-J, et al. FAM198B is associated with prolonged survival and inhibits metastasis in lung adenocarcinoma via blockage of ERK-mediated MMP-1 expression. Clin Cancer Res. 2018;24:916–926. doi:10.1158/1078-0432.CCR-17-1347
40. Liao YX, Zhang ZP, Zhao J, Liu JP. Effects of Fibronectin 1 on cell proliferation, senescence and apoptosis of human glioma cells through the PI3K/AKT signaling pathway. Cell Physiol Biochem. 2018;48(3):1382–1396. doi:10.1159/000492096
41. Gong J, Wang ZX, Liu ZY. miRNA‑1271 inhibits cell proliferation in neuroglioma by targeting fibronectin 1. Mol Med Rep. 2017;6(1):143–150. doi:10.3892/mmr.2017.6610
42. Zhou W, Ross MM, Tessitore A, et al. An initial characterization of the serum phosphoproteome. J Proteome Res. 2009;8:5523–5531. doi:10.1021/pr900603n
43. Carrascal M, Gay M, Ovelleiro D, Casas V, Gelpí E, Abian J. Characterization of the human plasma phosphoproteome using linear ion trap mass spectrometry and multiple search engines. J Proteome Res. 2010;9:876–884. doi:10.1021/pr900780s
44. Bahl JMC, Jensen SS, Larsen MR, Heegaard NHH. Characterization of the human cerebrospinal fluid phosphoproteome by titanium dioxide affinity chromatography and mass spectrometry. Anal Chem. 2008;80:6308–6316. doi:10.1021/ac800835y
45. Arwert EN, Harney AS, Entenberg D, Wang Y. A unidirectional transition from migratory to perivascular macrophage is required for tumor cell intravasation. Cell Rep. 2018;23:1239–1248.
46. Yang M, McKay D, Pollard JW, Lewis CE. Diverse functions of macrophages in different tumor microenvironments. Cancer Res. 2018;78:5492–5503. doi:10.1158/0008-5472.CAN-18-1367
 © 2020 The Author(s). This work is published and licensed by Dove Medical Press Limited. The full terms of this license are available at https://www.dovepress.com/terms.php and incorporate the Creative Commons Attribution - Non Commercial (unported, v3.0) License.
By accessing the work you hereby accept the Terms. Non-commercial uses of the work are permitted without any further permission from Dove Medical Press Limited, provided the work is properly attributed. For permission for commercial use of this work, please see paragraphs 4.2 and 5 of our Terms.
© 2020 The Author(s). This work is published and licensed by Dove Medical Press Limited. The full terms of this license are available at https://www.dovepress.com/terms.php and incorporate the Creative Commons Attribution - Non Commercial (unported, v3.0) License.
By accessing the work you hereby accept the Terms. Non-commercial uses of the work are permitted without any further permission from Dove Medical Press Limited, provided the work is properly attributed. For permission for commercial use of this work, please see paragraphs 4.2 and 5 of our Terms.