")
Back to Journals » Drug, Healthcare and Patient Safety » Volume 8
Seasonality in acute liver injury? Findings in two health care claims databases
Authors Weinstein R, Schuemie M, Ryan P, Stang P
Received 29 August 2015
Accepted for publication 11 February 2016
Published 31 March 2016 Volume 2016:8 Pages 39—48
DOI https://doi.org/10.2147/DHPS.S95399
Checked for plagiarism Yes
Review by Single anonymous peer review
Peer reviewer comments 2
Editor who approved publication: Professor Chul Ahn
Rachel B Weinstein, Martijn J Schuemie, Patrick B Ryan, Paul E Stang
Epidemiology, Janssen Research and Development, LLC, Titusville, NJ, USA
Background: Presumed seasonal use of acetaminophen-containing products for relief of cold/influenza (“flu”) symptoms suggests that there might also be a corresponding seasonal pattern for acute liver injury (ALI), a known clinical consequence of acetaminophen overdose.
Objective: The objective of this study was to determine whether there were any temporal patterns in hospitalizations for ALI that would correspond to assumed acetaminophen use in cold/flu season.
Methods: In the period 2002–2010, monthly hospitalization rates for ALI using a variety of case definitions were calculated. Data sources included Truven MarketScan® Commercial Claims and Encounters (CCAE) and Medicare Supplemental and Coordination of Benefits (MDCR) databases. We performed a statistical test for seasonality of diagnoses using the periodic generalized linear model. To validate that the test can distinguish seasonal from nonseasonal patterns, we included two positive controls (ie, diagnoses of the common cold [acute nasopharyngitis] and influenza), believed to change with seasons, and two negative controls (female breast cancer and diabetes), believed to be insensitive to season.
Results: A seasonal pattern was observed in monthly rates for common cold and influenza diagnoses, but this pattern was not observed for monthly rates of ALI, with or without comorbidities (cirrhosis or hepatitis), breast cancer, or diabetes. The statistical test for seasonality was significant for positive controls (P<0.001 for each diagnosis in both databases) and nonsignificant for ALI and negative controls.
Conclusion: No seasonal pattern was observed in the diagnosis of ALI. The positive and negative controls showed the expected patterns, strengthening the validity of the statistical and visual tests used for detecting seasonality.
Keywords: acute liver injury, acetaminophen, seasonality
Introduction
The use of acetaminophen (paracetamol outside the US), in either prescription products (mainly opioid combination analgesics) or over-the-counter (OTC) products, is widespread1 due in part to the use of acetaminophen both in specific formulations to treat pain and fever and also in OTC products that combine acetaminophen with other active ingredients to treat a number of symptoms (ie, cough and fever). It is estimated that ~56 million adults1,2 in the US take acetaminophen-containing products to treat pain, fever, cold/influenza (“flu”) symptoms each week. OTC cold/flu products account for ~27% of days of acetaminophen use, which fluctuates seasonally.3
Acetaminophen, when used at the recommended dose (up to 4 g/d), is considered safe and well tolerated; however, cases of acute liver injury (ALI) have been reported with ingestion of higher doses.4–6 Intentional overdose (suicide attempt) and unintentional overdose due to “therapeutic misadventure” (eg, simultaneously taking two or more acetaminophen-containing medications with unintentional, high cumulative acetaminophen exposure) can lead to centrilobular necrosis in the liver and ALI.7 Acetaminophen-associated ALI causes substantial morbidity and, for some, requires liver transplantation for fulminant hepatic failure.5 In a prospective registry of patients in the US who developed liver failure, 35% of cases with an acetaminophen overdose were fatal.7
Given the widespread seasonal availability of acetaminophen-containing cold/flu products and the potential increased likelihood of inadvertent overdose due to the use of multiple OTC products, one might expect to see a corresponding seasonal pattern in the occurrence of ALI. Those with preexisting hepatic disease (cirrhosis, hepatitis) may be particularly vulnerable and at higher risk of ALI. The objective of this study was to determine, without the examination of medication use, whether there are any seasonal patterns in the occurrence of ALI that correspond to the cold/flu season.
Patients and methods
Methods
We conducted a retrospective, observational study to identify patients with hospitalization for ALI using claims from two Truven MarketScan® Research databases – the Commercial Claims and Encounters (CCAE) database and the Medicare Supplemental and Coordination of Benefits (MDCR) database. The CCAE database consists of claims from >90 million individuals (ie, employees, their spouses, and their dependents) who are privately insured in large (primarily self-insured) employer-sponsored health plans. With most data provided by large employers, CCAE provides data continuity (across health plans) from unique patients over multiple years. CCAE members’ mean age was 31.3 years and approximately half (49%) were male. Their medical and pharmacy coverage was over a mean observation period of 2.3 years. The MDCR database consists of claims for Medicare- eligible retirees with employer-sponsored supplemental coverage. The MDCR database used for this study included >7 million members with data for the period January 2000 to January 2012, with a mean observation period in the database of 3.0 years. MDCR members’ mean age was 72.7 years and approximately two-thirds (65%) were female. Both databases include prescription drug data and medical claims data for health care services that were performed in outpatient and inpatient settings in all US states. Prescription drug data were not used in this study because it would underestimate true use considering the availability of OTC acetaminophen-containing products. This analysis relies entirely on diagnoses in the database.
Both databases include only deidentified data and are therefore fully compliant with the Health Insurance Portability and Accountability Act of 1996. This study did not collect, use, or transmit individually identifiable data. The New England Institutional Review Board determined that these data did not constitute human subjects research and were exempt from review.
The CCAE and MDCR data were transformed to the Observational Medical Outcomes Partnership (OMOP) Common Data Model (CDM),8 thereby standardizing the content and format of data across both data sources.
Study population
Eligible study patients were aged 18 years or older during the period of 2002 through 2010. ALI events were identified using three definitions of varying restrictiveness: 1) the occurrence of any International Classification of Diseases, Ninth Revision, Clinical Modification (ICD-9-CM) diagnosis code for ALI (Table S1) as the primary diagnosis for hospitalization and no ALI hospitalization in the previous 60 days; 2) a narrower definition – meeting requirements of Definition 1 above) AND having either one of the ALI diagnostic codes (eg, liver biopsy) in the 30 days preceding or including the day of hospitalization, OR one of the ALI therapeutic procedure codes (eg, liver transplant) in the 30 days following or including the day of hospitalization; and 3) a broader definition – the occurrence of any ALI diagnosis code not requiring hospitalization (including emergency department or outpatient visits).
Even though a single patient could have more than one ALI event, we excluded an event if it (according to the same definition enumerated herein) was already observed in the previous 60 days. Events were also excluded if the patient had been enrolled in the database fewer than 180 days prior to the event.
To test the ability to detect both seasonal patterns and nonseasonal patterns within each database, we identified two positive controls (conditions known to change with seasons) and two negative controls (conditions believed to be insensitive to season). The positive controls were patients diagnosed with a common cold (ICD-9 code 460, acute nasopharyngitis) and those diagnosed with influenza (ICD-9-CM codes: 487, 487.1, and 487.8). The negative controls were patients with a diagnosis of breast cancer (malignant neoplasm of female breast; ICD-9-CM codes: 174, 174.1–174.9) and patients with a diagnosis of diabetes mellitus (ICD-9-CM codes: 250, 250.01–250.03, 250.1–250.13, 250.21–250.23, 250.31–250.33, 250.41–250.43, 250.51–250.53, 250.61–250.63, 250.71–250.73, 250.81–250.83, 250.91–250.93).
Data analysis
Monthly event rates for ALI hospitalization (hospital visit) were calculated among all members enrolled in the database for the given month as well as those enrolled in the previous 180 days. In this calculation, the first 180 days of a patient’s enrollment in a database (when a patient was not eligible for ALI events, as noted earlier) were not included in patient time, the denominator in the monthly event rate calculation. Monthly rates for positive and negative control events were also calculated.
A widely used method for modeling the seasonality is to fit a sine curve to the monthly or regularly occurring rates.9 From this model, the ratio of peak-to-low occurrence rates can be obtained and has been referred to as the seasonal intensity of occurrence.9 For our test for seasonality, we used an application of the generalized linear model approach of Brookhart and Rothman9 to model event counts as a sinusoidal pattern. We modified their model by including a linear component for long-term trends. The model for the expected count of events E[Ni] in time period i is as follows:

where τ is the number of months since the study start date,

and
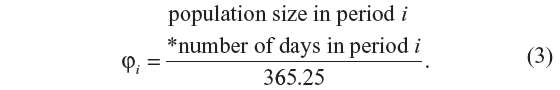
The ratio of peak-to-low occurrence rates of the process is given by
A value of R >1 indicates that peaks are higher than troughs in the fitted model, meaning there is seasonality. We therefore tested whether we can reject the null hypothesis that R equals one, against the alternative hypothesis that R is >1. Rejecting the null hypothesis therefore implies evidence of seasonality, whereas failure to reject the null hypothesis implies lack of evidence of seasonality.
Subgroup analyses of ALI, defined as the primary diagnosis for hospitalization and by the narrower definition, were performed based on the absence or presence (one or both) of the comorbidities cirrhosis or hepatitis (ICD-9-CM codes for each presented in Table S2) in the 180 days prior to hospital admission.
Results
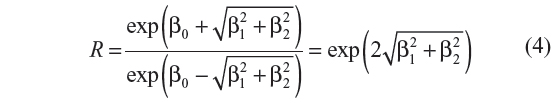
Figure 1 shows the monthly rate for all case definitions of ALI over time in the CCAE database (Figure 1A) and the MDCR database (Figure 1B). The prevalence of hospitalized ALI, irrespective of the presence of comorbidities, was low, leading to wide 95% confidence intervals. Monthly prevalence rates for the broad definition of ALI, not requiring hospitalization, were higher than the hospitalized rates with narrow confidence intervals. Visually, ie, from a visual inspection of the graph, a seasonal pattern was not apparent in any of the figures.
 | Figure 1 Prevalence of ALI. |
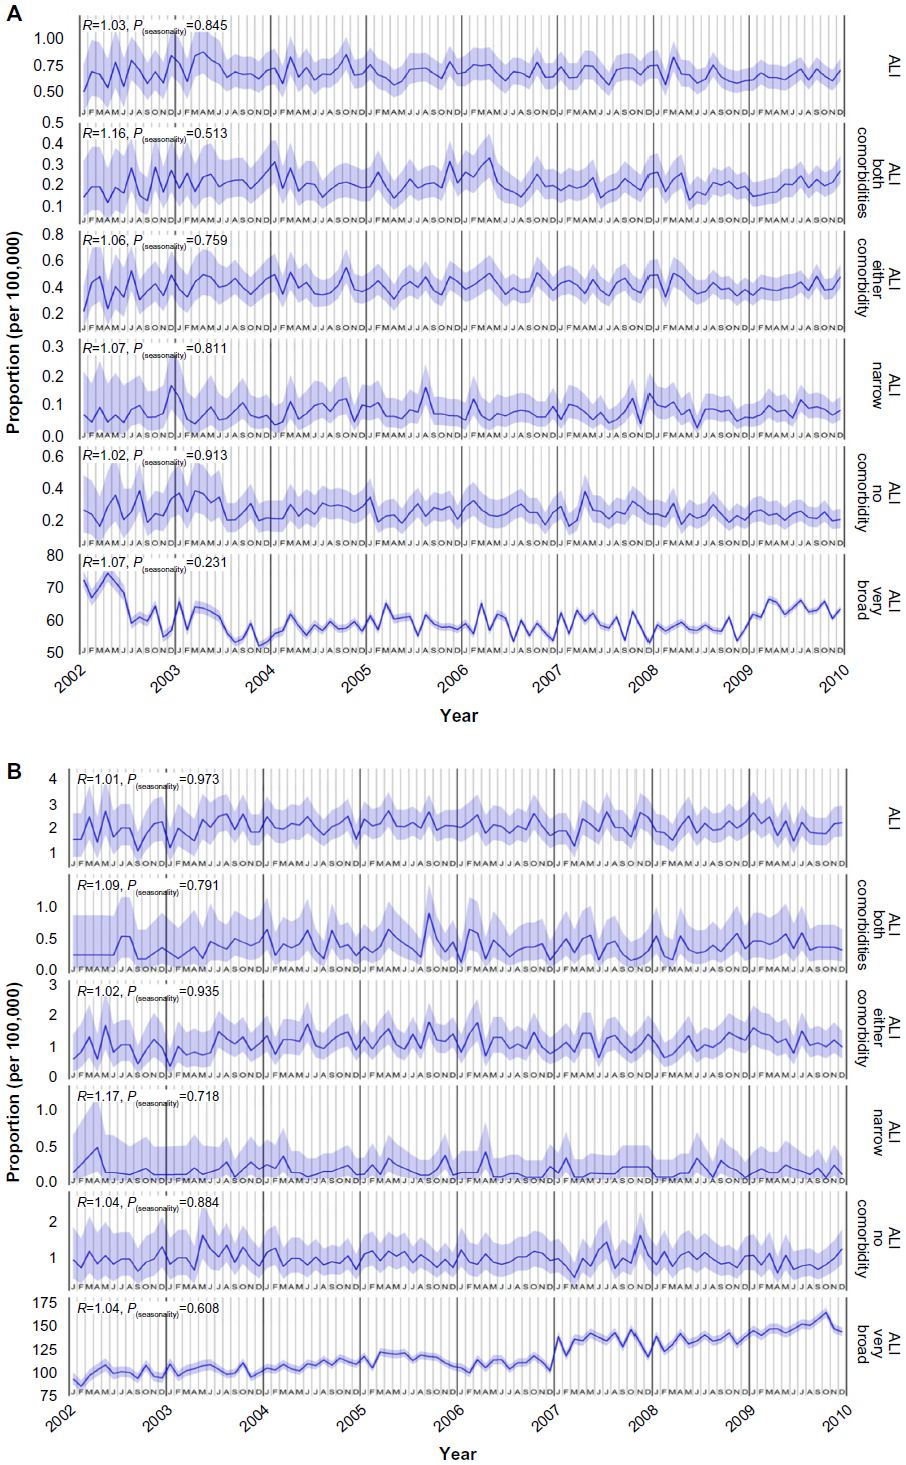
Figure 2 shows the monthly rate of negative and positive control events in the CCAE database (Figure 2A) and the MDCR database (Figure 2B). Cold/flu rates had an unmistakable seasonal fluctuation, whereas breast cancer and diabetes mellitus diagnosis rates did not appear to have seasonal patterns.
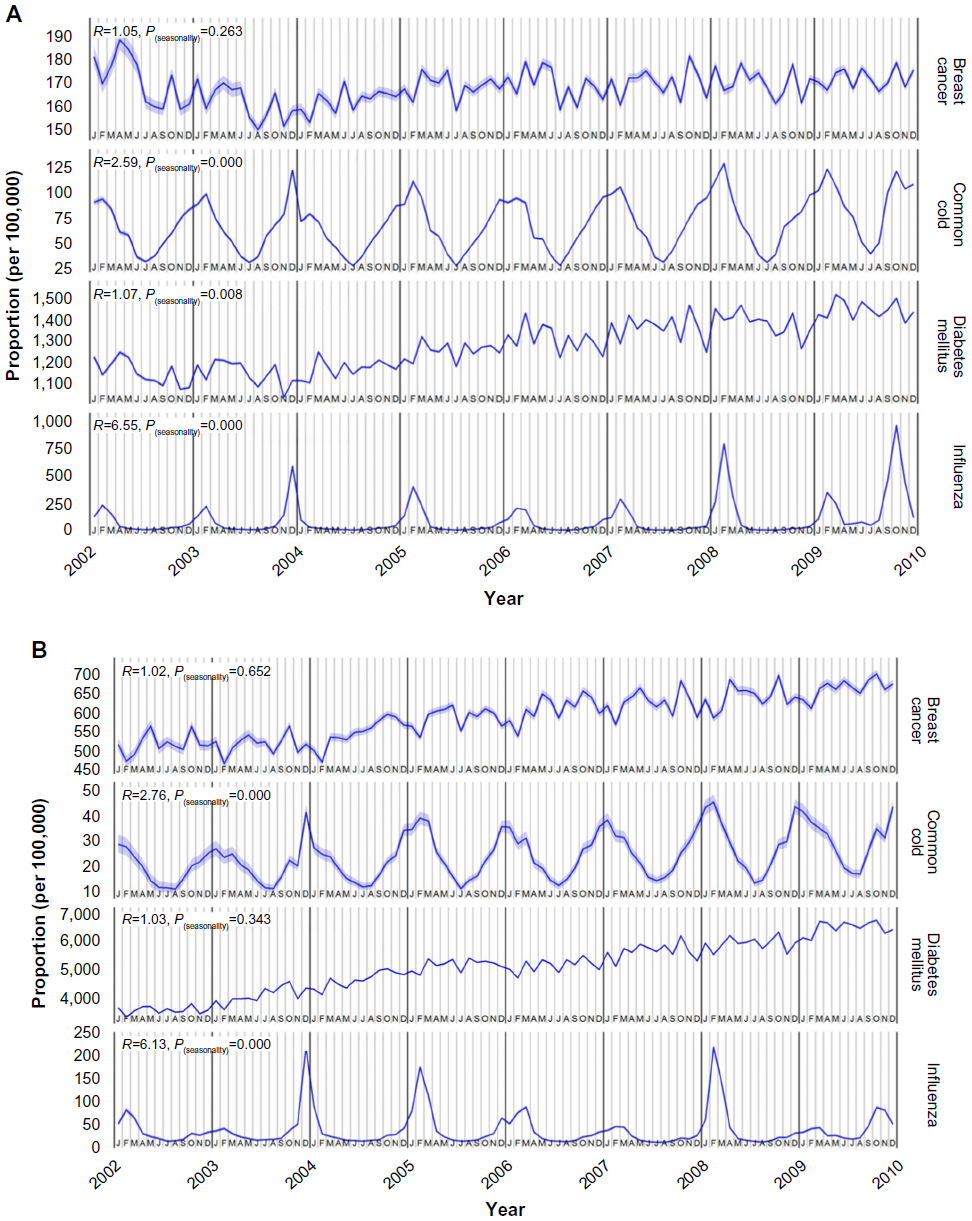 | Figure 2 Prevalence of negative- and positive-control events. |
Tables 1 and 2 present the results of the tests for seasonality. The last column of each table gives the P-value for the null hypothesis of a ratio of peak-to-low occurrence rates equal to one. The test for seasonality was negative (nonsignificant) for ALI as the primary diagnosis for hospitalization in both the CCAE database (no comorbidities: P=0.91; either comorbidity: P=0.76; both comorbidities: P=0.51) and the MDCR database (no comorbidities: P=0.88; either comorbidity: P=0.93; both comorbidities: P=0.79). Similarly, a seasonal pattern was not seen for ALI based on the narrower hospitalization-based definition qualified by a diagnostic procedure in the 30 days before or therapeutic procedure in the 30 days after, including the day of hospitalization. When hospitalization was not included in the case definition, to increase the number of cases and the precision, there was still no evidence for seasonality of ALI (CCAE: P=0.23; MDCR: P=0.61).
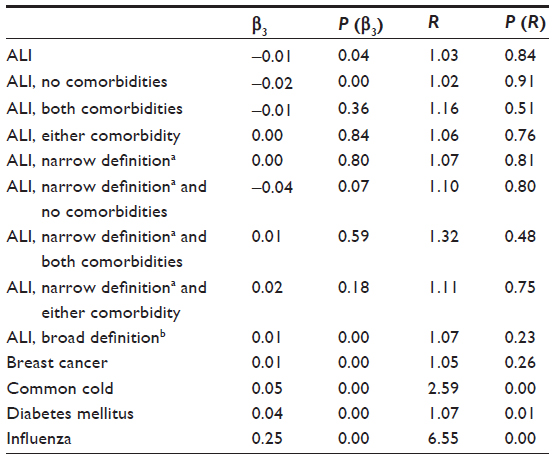 | Table 1 Results of the tests for seasonality using CCAE data |
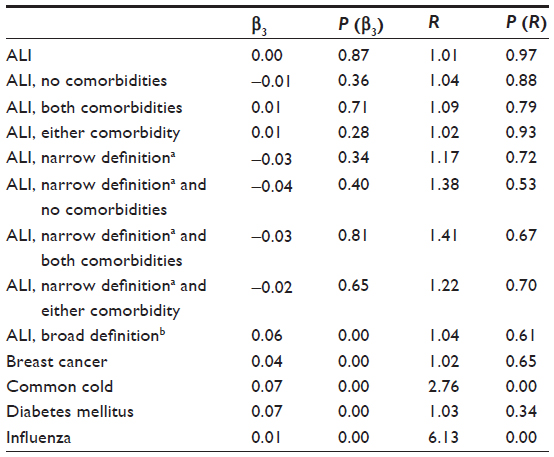 | Table 2 Results of the tests for seasonality using MDCR data |
In analyses of the positive controls, cold or influenza, the ratios of peak-to-low occurrence rates were statistically significantly >1, which was expected. In the analysis of the negative controls, the value of the ratio of peak-to-low occurrence rates approached one for both breast cancer and diabetes mellitus, and the test for seasonality was not significant for both diagnoses in the MDCR database and for breast cancer in the MDCR database.
Discussion
This study was conducted to gain insights into whether there are seasonal patterns in ALI hospitalizations that might correspond to the patterns of use of acetaminophen-containing products for relief of cold/flu symptoms and the consequent increased risk of inadvertent overdose. We used the Truven Health MarketScan® CCAE (persons aged <65 years) and MDCR (persons ≥65 years) databases for this observational study. The large size, comprehensive capture of health care use for insurance-covered individuals, and longitudinal nature of these databases enabled us to study monthly, and therefore, seasonal event rates over several years.
ALI is difficult to diagnose clinically and consequently is difficult to capture accurately in observational databases.10,11 It is not surprising that there is no widely accepted and “validated” definition to identify ALI in observational databases. This has led to significant variations in reported prevalence rates, which motivated us to incorporate several definitions into our analysis based on the existing literature.10,11 We also implemented further sensitivity testing to determine the impact of including and excluding patients with hepatitis and cirrhosis, which may increase the risk of ALI. To some extent, this makes our study more comparable to prior observational database studies of ALI using similar case definitions; however, all of these studies suffer from the imprecision in this diagnosis.
We calculated monthly rates for ALI using case definitions, both with and without related comorbidities (hepatitis, cirrhosis) that may have predisposed a patient to an ALI event. The case definitions ranged from more restrictive to less restrictive. The most restrictive (narrow) case definition required an ALI hospitalization, the case index date without a prior hospitalization for at least 60 days, and with evidence of diagnostic workup in the previous 30 days or treatment (liver transplant) in the subsequent 30 days. A less restrictive definition dropped the requirement for a diagnostic procedure or treatment, and the least restrictive definition dropped the requirement of a hospitalization and included any diagnosis of ALI. We also looked at how the impact of either excluding or including the comorbidities of chronic liver diseases, such as hepatitis and cirrhosis, changed the pattern of events. Regardless of the level of specificity of the case definition, no seasonal pattern of diagnosis was evident either visually or statistically.
One other possible explanation for any seasonality that might be observed in ALI is the observation that suicidality has been reported as seasonal, being most common in the spring.12 If suicidality is another etiology leading to ALI hospital admissions13 and is, itself, seasonal (with a peak in the spring), it would increase the likelihood of detecting a seasonal pattern of ALI. The model identifies a seasonal pattern as a peak and a trough occurring repetitively each year. Assuming that higher rates of ALI occur during the cold/flu season and in the spring, a pattern with a trough in the summer and fall would be observed. However, no patterns were observed or detected for any measure of ALI.
Additional assessment of unrelated diagnoses as positive and negative controls were performed to confirm 1) whether any seasonal patterns could be detected in any of the data in the database and 2) whether other diseases not considered as having seasonal patterns of diagnosis had similar assessment results. Acute nasopharyngitis (or the common cold) and influenza were selected as positive controls because they are known to occur seasonally (and likely to increase the exposure to OTC acetaminophen), and female breast cancer and diabetes mellitus were used as negative controls. The positive controls performed as expected and were both visually and statistically positive for seasonality. Breast cancer prevalence among women and diabetes mellitus was neither visually nor statistically associated with the seasons. The statistical test for seasonality of diabetes in the CCAE database (patients aged <65 years) was significant. However, visually, there was no clear pattern of monthly prevalence rates; the lower rates observed in July, August, and December for diabetes (statistically significant only in the CCAE database) could reflect lower health care utilization during vacation time. The graphs of monthly rates of ALI, diabetes, and breast cancer in the MDCR data show an increasing time trend, but this is the component of the periodic generalized linear model9 that we added, so that any seasonal cycle could be separated out from any linear time trends.
Long-term trends in data are common, but rarely studied. Even when such trends are observed, seasonality is rarely accounted for in the modeling of outcomes. We have shown in the two databases used here that trends and seasonal cycles are sometimes reflected in the data. The primary strategy to adjust for seasonality in a cohort or case–control study is either restriction or matching, ensuring that the matched sets in the comparator groups have index dates from the same month and year. This method of adjusting for seasonality is a much stricter criterion than the typically implemented strategy of either ignoring this issue or matching within the year or quarter.
Our analysis of the seasonality of ALI should be interpreted with caution. There are several potential causes of ALI that may overwhelm a pattern of seasonality, so our finding of no evidence of seasonality cannot be considered conclusive evidence that a relationship does not exist. Nor is this study meant to examine the relationship between acetaminophen and other exposures known to increase the risk of ALI. These databases capture prescription drug dispensing, including acetaminophen-containing opioid combinations, but do not capture use of any OTC medications. We would ideally have liked to measure OTC acetaminophen use, but instead we assumed a seasonal usage pattern based on the indication for the OTC products. An analysis based on prescription medications only would result in substantial misclassification of exposure. We have not included any medication data in this analysis. This could be considered a limitation of the current study. However, because of the known, high prevalence of acetaminophen use from both prescription and OTC sources in the general population,14 we believe our analysis contributes to an understanding of the frequency of potential patterns, and possible etiology, of ALI.
In summary, we presumed that the use of acetaminophen-containing products for relief of cold/flu symptoms fluctuates seasonally and hypothesized that there would be a corresponding pattern in ALI occurrence as patients already treating a pain condition, eg, could ingest more acetaminophen if they developed a cold or flu. We validated a generalized linear model with periodicity as a methodology for detecting seasonality in these health care claims databases through the use of positive and negative controls. However, the same methodology applied to the diagnosis of ALI failed to detect a pattern of seasonality. Additionally, the graph of monthly diagnosis rates of ALI over time did not appear to have a cyclic pattern upon visual examination.
Acknowledgments
Sandra Norris, PharmD, provided writing assistance and Bradford Challis, PhD (of Janssen Pharmaceutical Research and Development, LLC), provided additional editorial assistance. The study was sponsored by Janssen Research and Development, LLC.
Author contributions
All authors contributed toward data analysis, drafting and critically revising the paper and agree to be accountable for all aspects of the work.
Disclosure
All authors are employees of Janssen Research and Development, LLC, the sponsor of the study. The authors report no other conflicts of interest in this work.
References
Kaufman DW, Kelly JP, Rosenberg L, Anderson TE, Mitchell AA. Recent patterns of medication use in the ambulatory adult population of the United States: the Sloan survey. JAMA. 2002;287(3):337–344. | |
United States Census Bureau [webpage on the Internet]. USA Quick Facts from the US Census Bureau. Available from: http://quickfacts.census.gov/qfd/states/00000.html. Accessed 12 August 2015. | |
Shiffman S, Rohay JM, Kelly JP, Malone MK, Weinstein RB, Kaufman DW. Acetaminophen use patterns associated with excess dosing. Presented at the 28th International Conference on Pharmacoepidemiology and Therapeutic Risk Management August 23–26. Barcelona: 2012. | |
Ayonrinde OT, Phelps GJ, Hurley JC, Ayonrinde OA. Paracetamol overdose and hepatotoxicity at a regional Australian hospital: a 4-year experience. Intern Med J. 2005;35(11):655–660. | |
Cooper SC, Aldridge RC, Shah T, et al. Outcomes of liver transplantation for paracetamol (acetaminophen)-induced hepatic failure. Liver Transpl. 2009;15(10):1351–1357. | |
Ostapowicz G, Fontana RJ, Schiødt FV, et al; U.S. Acute Liver Failure Study Group. Results of a prospective study of acute liver failure at 17 tertiary care centers in the United States. Ann Intern Med. 2002;137(12):947–954. | |
Larson AM, Polson J, Fontana RJ, et al; Acute Liver Failure Study Group. Acetaminophen-induced acute liver failure: results of a United States multicenter, prospective study. Hepatology. 2005;42(6):1364–1372. | |
Overhage JM, Ryan PB, Reich CG, Hartzema AG, Stang PE. Validation of a common data model for active safety surveillance research. Am Med Inform Assoc. 2012;19(1):54–60. | |
Brookhart MA, Rothman KJ. Simple estimators of the intensity of seasonal occurrence. BMC Med Res Methodol. 2008;8:67. | |
Katz AJ, Ryan PB, Racoosin JA, Stang PE. Assessment of case definitions for identifying acute liver injury in large observational databases. Drug Saf. 2013;36(8):651–661. | |
Lo Re V 3rd, Haynes K, Goldberg D, et al. Validity of diagnostic codes to identify cases of severe acute liver injury in the US Food and Drug Administration’s Mini-Sentinel Distributed Database. Pharmacoepidemiol Drug Saf. 2013;22(8):861–872. | |
Woo J-M, Okusaga O, Postolache TT. Seasonality of suicidal behavior. Int J Environ Res Public Health. 2012;9(2):531–547. | |
Manthripragada AD, Zhou EH, Budnitz DS, Lovegrove MC, Willy ME. Characterization of acetaminophen overdose-related emergency department visits and hospitalizations in the United States. Pharmacoepidemiol Drug Saf. 2011;20(8):819–826. | |
Paulose-Ram R, Hirsch R, Dillon C, Gu Q. Frequent monthly use of selected non-prescription and prescription non-narcotic analgesics among U.S. adults. Pharmacoepidemiol Drug Saf. 2005;14(4):257–266. |
Supplementary materials
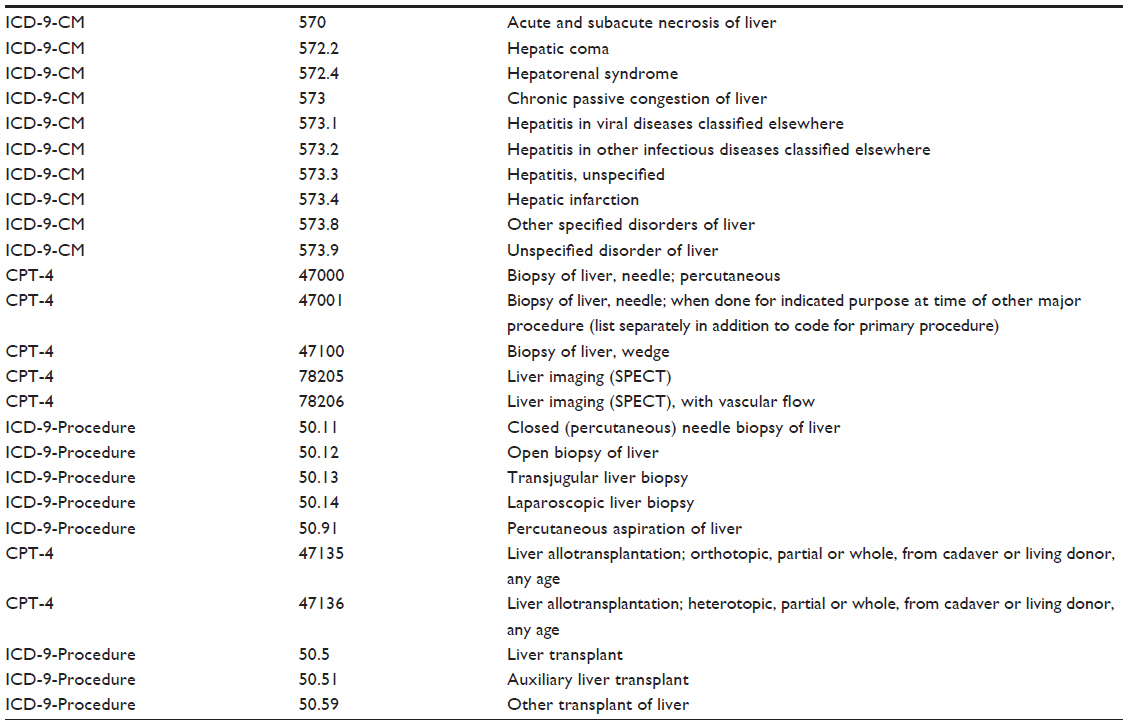 | Table S1 ICD-9-CM diagnosis, CPT-4, and ICD-9-Procedure codes for acute liver injury |
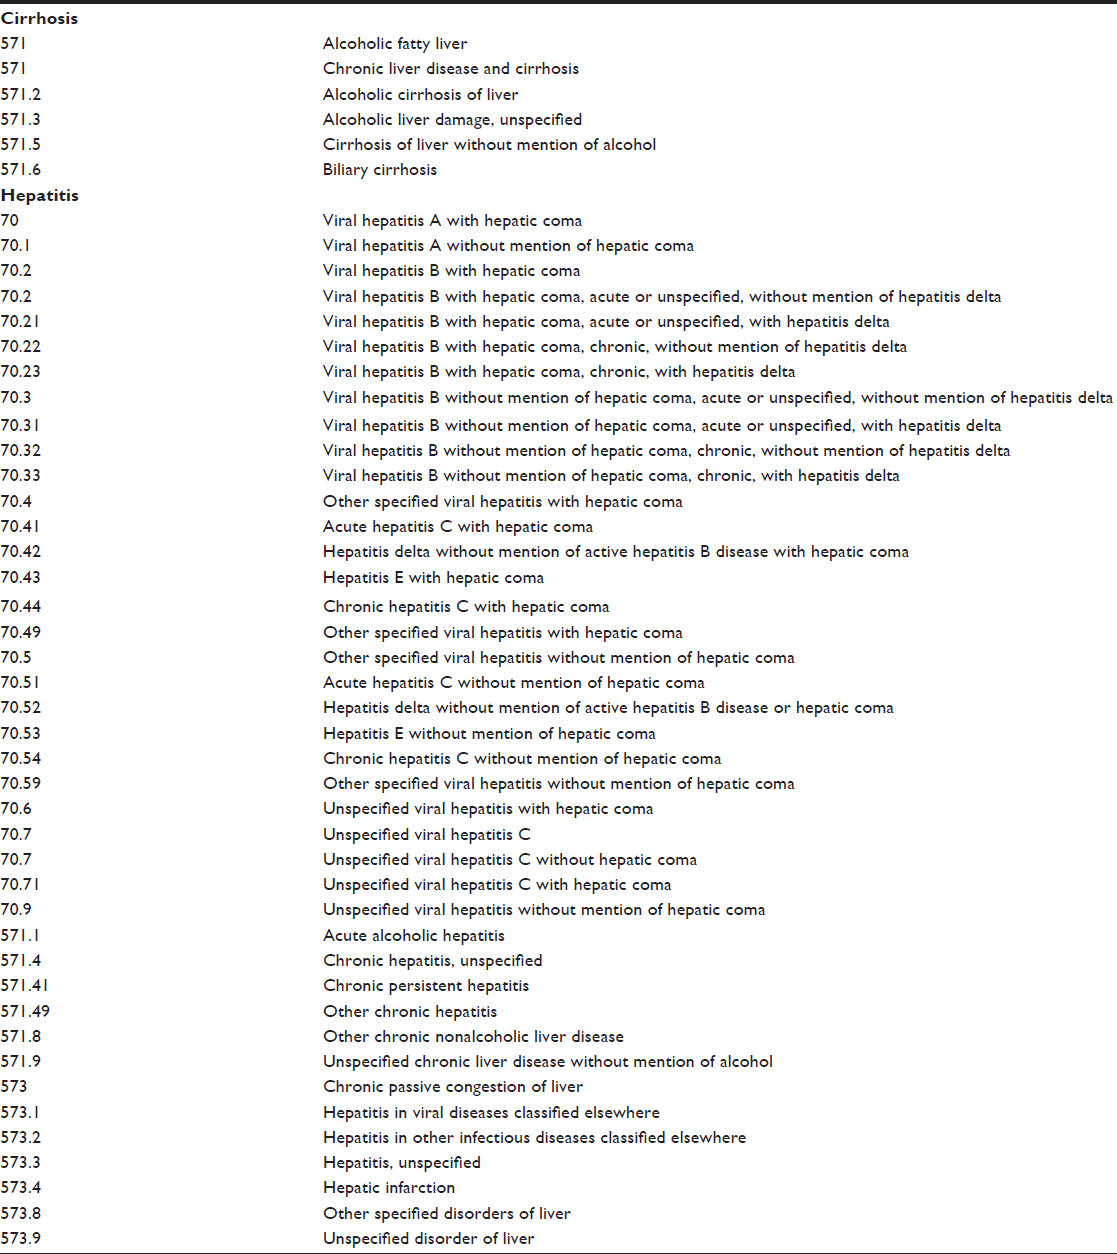 | Table S2 ICD-9-CM diagnosis codes for comorbidities |
 © 2016 The Author(s). This work is published and licensed by Dove Medical Press Limited. The full terms of this license are available at https://www.dovepress.com/terms.php and incorporate the Creative Commons Attribution - Non Commercial (unported, v3.0) License.
By accessing the work you hereby accept the Terms. Non-commercial uses of the work are permitted without any further permission from Dove Medical Press Limited, provided the work is properly attributed. For permission for commercial use of this work, please see paragraphs 4.2 and 5 of our Terms.
© 2016 The Author(s). This work is published and licensed by Dove Medical Press Limited. The full terms of this license are available at https://www.dovepress.com/terms.php and incorporate the Creative Commons Attribution - Non Commercial (unported, v3.0) License.
By accessing the work you hereby accept the Terms. Non-commercial uses of the work are permitted without any further permission from Dove Medical Press Limited, provided the work is properly attributed. For permission for commercial use of this work, please see paragraphs 4.2 and 5 of our Terms.