")
Back to Journals » International Journal of Chronic Obstructive Pulmonary Disease » Volume 10 » Issue 1
Seasonality, ambient temperatures and hospitalizations for acute exacerbation of COPD: a population-based study in a metropolitan area
Authors Almagro P , Hernandez C, Martinez-Cambor P , Tresserras R, Escarrabill J
Received 13 October 2014
Accepted for publication 12 December 2014
Published 8 May 2015 Volume 2015:10(1) Pages 899—908
DOI https://doi.org/10.2147/COPD.S75710
Checked for plagiarism Yes
Review by Single anonymous peer review
Peer reviewer comments 5
Editor who approved publication: Dr Richard Russell
Pere Almagro,1 Carme Hernandez,2,3,7 Pable Martinez-Cambor,4,5 Ricard Tresserras,2,6 Joan Escarrabill2,7
1Acute Geriatric Care Unit, Internal Medicine, University Hospital Mútua de Terrasa, University of Barcelona, Barcelona, Spain; 2Respiratory Disease Management Plan, Department of Health of the Autonomous Government of Catalonia, Observatory of Respiratory Therapy, 3Integrated Care Unit, Medical and Nursing Management, Hospital Clínic Barcelona, Barcelona, 4Oficina de Investigación Biosanitaria de Oviedo, Asturias, Spain; 5Universidad Autonoma de Chile, Santiago, Chile; 6Health Department, 7Chronic Diseases Care Program, Hospital Clinic, Hospital Clínic & REDISSEC (Health Services Research on Chronic Patients Network), Barcelona, Spain
Background: Excluding the tropics, exacerbations of chronic obstructive pulmonary disease (COPD) are more frequent in winter. However, studies that directly relate hospitalizations for exacerbation of COPD to ambient temperature are lacking. The aim of this study was to assess the influence of temperature on the number of hospitalizations for COPD.
Methods: This was a population-based study in a metropolitan area. All hospital discharges for acute exacerbation of COPD during 2009 in Barcelona and its metropolitan area were analyzed. The relationship between the number of hospitalizations for COPD and the mean, minimum, and maximum temperatures alongside comorbidity, humidity, influenza rate, and environmental pollution were studied.
Results: A total of 9,804 hospitalization discharges coded with COPD exacerbation as a primary diagnosis were included; 75.4% of cases were male with a mean age of 74.9±10.5 years and an average length of stay of 6.5±6.1 days. The highest number of admissions (3,644 [37.2%]) occurred during winter, followed by autumn with 2,367 (24.1%), spring with 2,347 (23.9%), and summer with 1,446 (14.7%; P<0.001). The maximum, minimum, and mean temperatures were associated similarly with the number of hospitalizations. On average, we found that for each degree Celsius decrease in mean weekly temperature, hospital admissions increased by 5.04% (r2=0.591; P<0.001). After adjustment for humidity, comorbidity, air pollution, and influenza-like illness, only mean temperatures retained statistical significance, with a mean increase of 4.7% in weekly admissions for each degree Celsius of temperature (r2=0.599, P<0.001).
Conclusion: Mean temperatures are closely and independently related to the number of hospitalizations for COPD.
Keywords: hospitalization, chronic obstructive pulmonary disease, seasonality, humidity, pollution
Introduction
Chronic obstructive pulmonary disease (COPD) is one of the most prevalent chronic diseases and is associated with high morbidity and mortality worldwide. Given that the prevalence of COPD increases with age, the perspective is that the impact of the disease will continue to increase in the near future. According to the World Health Organization, in 2005, COPD affected 210 million people, of whom 3 million died from the disease.1 More recently, the Global Burden of Disease Study estimated that, in 2010, COPD was the third leading cause of death globally and ninth in disability-adjusted life years.2,3
A great part of this mortality in COPD occurs during exacerbations and the subsequent weeks, especially in patients hospitalized for severe exacerbations.4,5 Recent studies show that up to one third of patients with COPD require hospitalization for exacerbation of their disease over a period of 3 years.6 In addition, these hospitalizations generate the majority of health care costs and cause a significant deterioration in quality of life for affected patients.6,7 Factors associated with an increased risk of hospitalization include a prior history of admissions for COPD exacerbation, older age, severe pulmonary functional impairment, and the presence of comorbidities.6,8–11
Recently, two publications based on data obtained in the TORCH and POET trials, (two large international studies involving over 13,000 patients) investigated the relationship between exacerbations and seasonality, and confirmed an increase in exacerbations during the winter months along with an increase in hospitalizations, although this association was not observed in the tropics.12,13 Both studies were performed by comparing seasons, and therefore only indirectly dealt with temperatures. There are few studies directly assessing the influence of temperature in exacerbations of COPD, especially in more severe cases, such as those requiring hospitalization.
The aim of our study was to assess the influence of temperature on the number of hospital admissions for COPD exacerbation in a well-defined geographic area and to assess the influence of humidity, comorbidity, influenza-like illness, and air pollution on these hospitalizations.
Materials and methods
Discharge codes of all hospitalizations between January 1, 2009 and December 31, 2009 registered in the database of the Department of Health of Catalonia, excluding gynecological and obstetric admissions, were analyzed. This database includes all hospital discharges, public or otherwise, in Catalonia. Discharge codes for admissions involving acute exacerbation of COPD according to the International Classification of Diseases (ICD9-CM: 491.2, 492.8, 493.2, 494, or 496 as main diagnoses, and 518.81 or 518.84 with secondary diagnosis of 491.2, 492.8, 493.2, 494, or 496) were selected. The collected data included age, sex, geographic location, length of stay, hospital mortality, comorbidities, and destination at discharge.
Given the climate diversity in Catalonia, Spain, and in order to homogenize the sample according to temperature, we selected only those pertaining to Barcelona and its metropolitan area (600 km2 and 3,000,000 inhabitants) with a homogeneous Mediterranean climate characterized by moderate temperatures with mild winters, hot summers, and a variable climate during spring and autumn. Regions with a Mediterranean climate are found between 31 and 40 degrees latitude north and south of the equator, on the western side of continents, and include areas of southern and southwestern Australia, central Chile, coastal California, the Western Cape of South Africa, and around the Mediterranean Sea. Since the temperature is usually a few degrees higher in the large cities than in the surrounding areas (urban heat island effect), we also compared the number of admissions and temperatures in the city of Barcelona with the rest of the metropolitan area.
The presence of comorbidities was collected using secondary diagnoses with ICD9-CM grouped up to a total of 22 diseases. We also calculated the Deyo-Charlson Index, an adaptation of the Charlson Comorbidity Index for use in administrative databases.14
Temperature data were obtained from a meteorological station located in the Barcelona metropolitan area (Valles Occidental) via the Meteorological Service of Catalonia (www.meteo.cat). The data collected included mean, minimum, and maximum temperatures, along with humidity and precipitation. In order to decrease the noise, these values were considered by weekly means. In addition, to compare our results with those published in the TORCH and POET trials, the numbers of hospitalizations for COPD were also stratified by month and seasonality. Seasons were defined as follows: winter (December to February), spring (March to May), summer (June to August), and autumn (September to November).12,13
The rate of respiratory infections was obtained using data collected in the information plan for acute respiratory infections in Catalonia (PIDIRAC).15 The PIDIRAC data are part of the European Influenza Surveillance Scheme, pertaining to the European Centre for Disease and Control, and its methodology is similar throughout Europe.16 Briefly, the PIDIRAC receives information from a sentinel network of primary care and pediatric physicians who collect the number of ambulatory consultations and home visits for influenza-like illness, with a collection of the first two weekly respiratory samples by nasal and pharyngeal swabs for viral detection by immunofluorescence or viral polymerase chain reaction. All hospitalizations for influenza-like illness were also studied for respiratory samples, and all positive cases for influenza virus were notified. Rates of influenza reported by PIDIRAC were similarly analyzed. During 2009, PIDIRAC surveillance was extended throughout the year in response to the emergence of the new influenza A (H1N1) virus.
Finally, to study the possible relationship between air pollution and the number of hospital admissions, data on air pollution levels were extracted from the air quality database of Catalonia using the Catalonian Air Quality Index. This index is based on daily levels of carbon monoxide (CO), nitrogen dioxide (NO2), sulfur dioxide (SO2), ozone (O3), and particulate matter (PM10) emissions. Values obtained in this index are expressed as a continuous score ranging from below −50 to 100. Stratified air quality values oscillate between less than −50 (very poor air quality), −49 to 0 (poor), 1–25 (low), 26–50 (acceptable), 51–75 (satisfactory), and 76–100 (excellent). That is, a lower score corresponds with increased air pollution17 (see Table S1 and Figure S1). For the statistical analysis, rates of both respiratory infections and air quality were also studied using weekly mean values.
Statistical analysis
Continuous variables are expressed as the mean ± standard deviation while categorical variables are described by absolute and relative frequencies. Means among seasons were compared using the Welch robust test. Fisher’s Exact test of proportions was used to compare the influence of different factors on the proportion of hospitalizations. Simple and multivariate linear regression models were used to investigate the relationship between the different variables (measured in weekly means) and the total number of weekly hospital admissions for COPD. Multicollinearity of the multivariate models was checked using Durbin-Watson tests. The real shape of the model was previously investigated by a general additive model. The determination coefficient was used to measure the quality of the models. P-values below 0.05 were considered to be statistically significant. All calculations were performed with the R.2.10 free software package (www.r-project.org).
Results
During the year 2009, a total of 967,241 discharges from Catalonian hospitals were recorded, of which 18,548 (1.9%) had acute exacerbation of COPD as the main diagnosis. The average age of patients hospitalized for COPD was 74.5±11.4 years, with 77.3% being male and the average hospital stay being 7.1±6.6 days. Of these admissions, 9,804 (53.2%) were in Barcelona and its metropolitan area. The number of weekly hospitalizations ranged between 89 and 459, with an average of 188.5±80.2 and a median of 174. Again, these patients were predominantly male (75.4%) with a mean age of 74.9±10.5 years and an average stay of 6.5±6.1 days. Differences in sex, age, and length of stay between total COPD admissions in Catalonia and the study sample were statistically significant (all P<0.001) but clinically irrelevant except for the average length of stay.
The highest number of admissions occurred during the winter, with 3,689 (37.6%) hospitalizations, followed by autumn with 2,353 (24.0%), spring with 2,328 (23.7%), and summer with 1,434 (14.6%; P<0.001, see Figure 1). The population and climate characteristics and their analysis grouped by seasonality are detailed in Table 1.
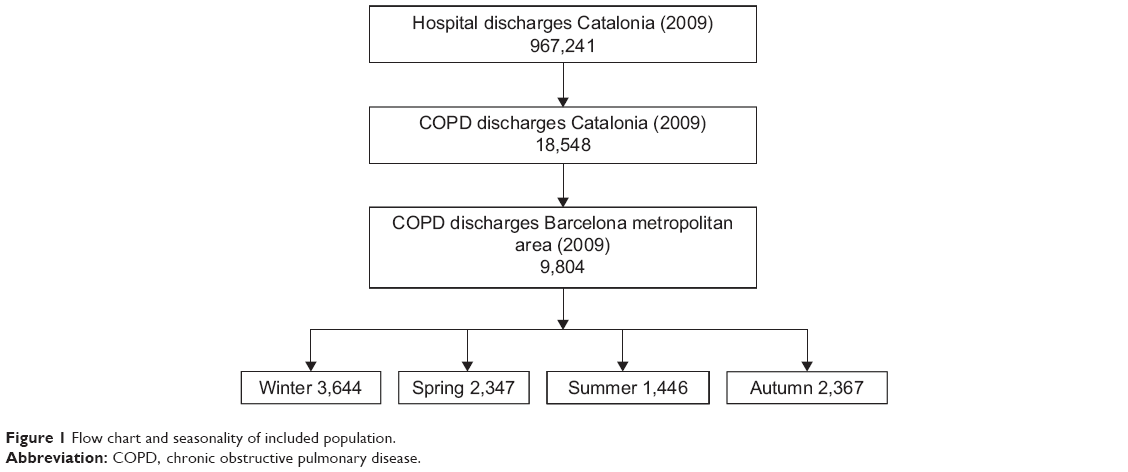 | Figure 1 Flow chart and seasonality of included population. |
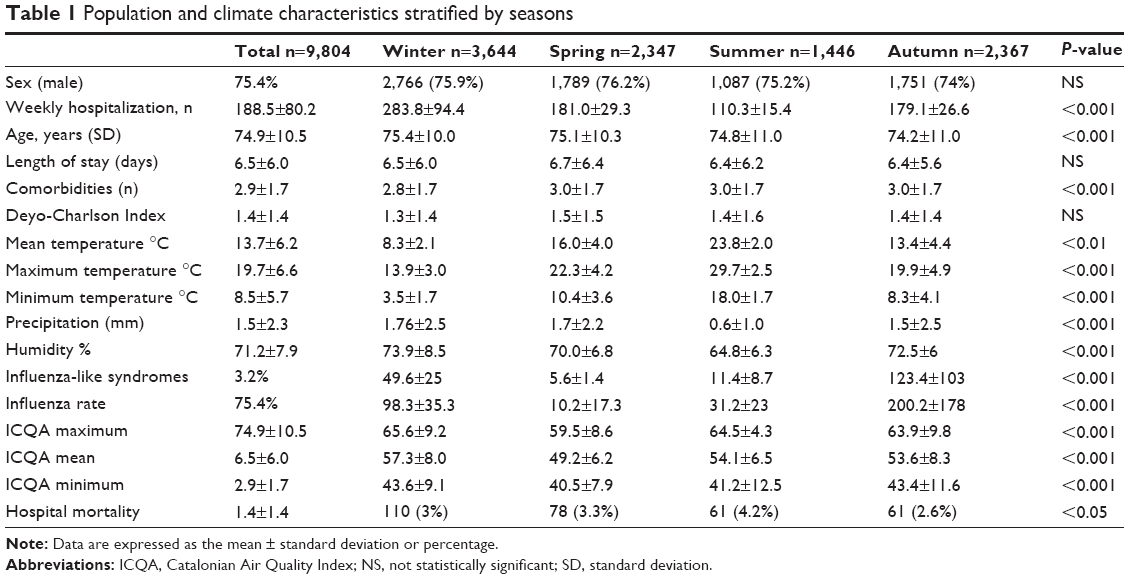 | Table 1 Population and climate characteristics stratified by seasons |
The observed mortality during hospitalization was 3.2%, being higher in the summer months (P=0.050). The most frequent comorbidities recorded were hypertension (43.6%), psychiatric disorders including anxiety and/or depression (42.0%), heart failure (32.8%), ischemic heart disease (28.3%), and diabetes mellitus (28.0%). The total number of comorbidities was lower during the winter months than in the rest of the year (P<0.001), although no difference was seen in the Deyo-Charlson Index (Table 1).
The mean annual maximum temperature was 19.7°C±6.6°C with a maximum of 34.5°C, while the mean of the minimum temperatures was 8.5°C±5.7°C with a minimum of 0.0°C. The values of the mean daily temperatures ranged between 3.8°C and 27°C, with a mean value of 13.7°C±6.2°C and an interquartile range (25%–75%) between 9.6°C and 19.2°C. The maximum, minimum, and mean temperatures were closely and similarly related with the number of hospitalizations (Figure 2). On average, in an unadjusted model we found that for each Celsius degree decrease in mean weekly temperature, hospital admissions increased by 5.04% (r2=0.591, P<0.001, see Figures 3 and 4).
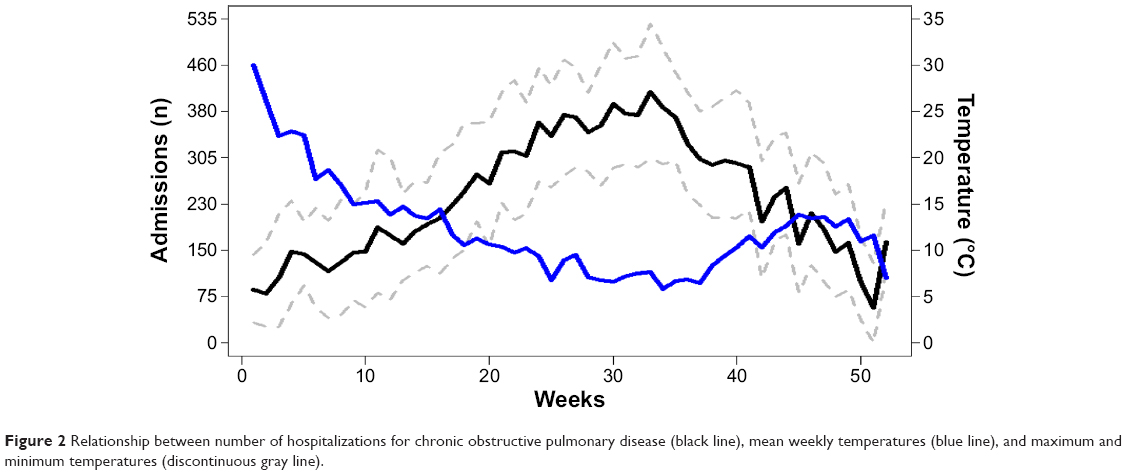 | Figure 2 Relationship between number of hospitalizations for chronic obstructive pulmonary disease (black line), mean weekly temperatures (blue line), and maximum and minimum temperatures (discontinuous gray line). |
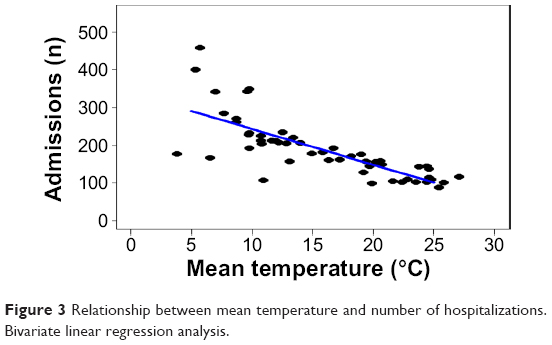 | Figure 3 Relationship between mean temperature and number of hospitalizations. Bivariate linear regression analysis. |
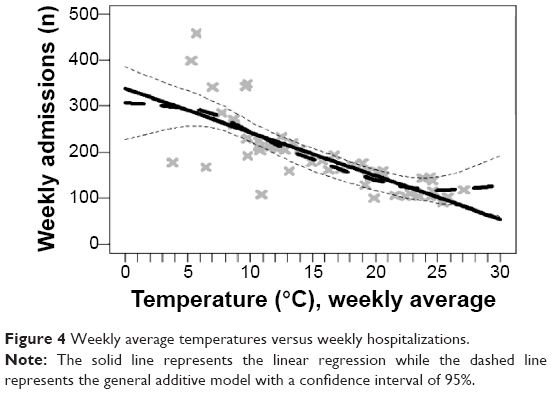 | Figure 4 Weekly average temperatures versus weekly hospitalizations. |
Despite being located in the same geographic area, as with other densely populated cities, temperatures in Barcelona were slightly higher than in the metropolitan area (urban heat island effect), varying a few degrees depending on the location of the meteorological station. However, we did not find differences between the pattern of temperature and hospitalizations between Barcelona city and its metropolitan area (P=0.08, Figure 5).
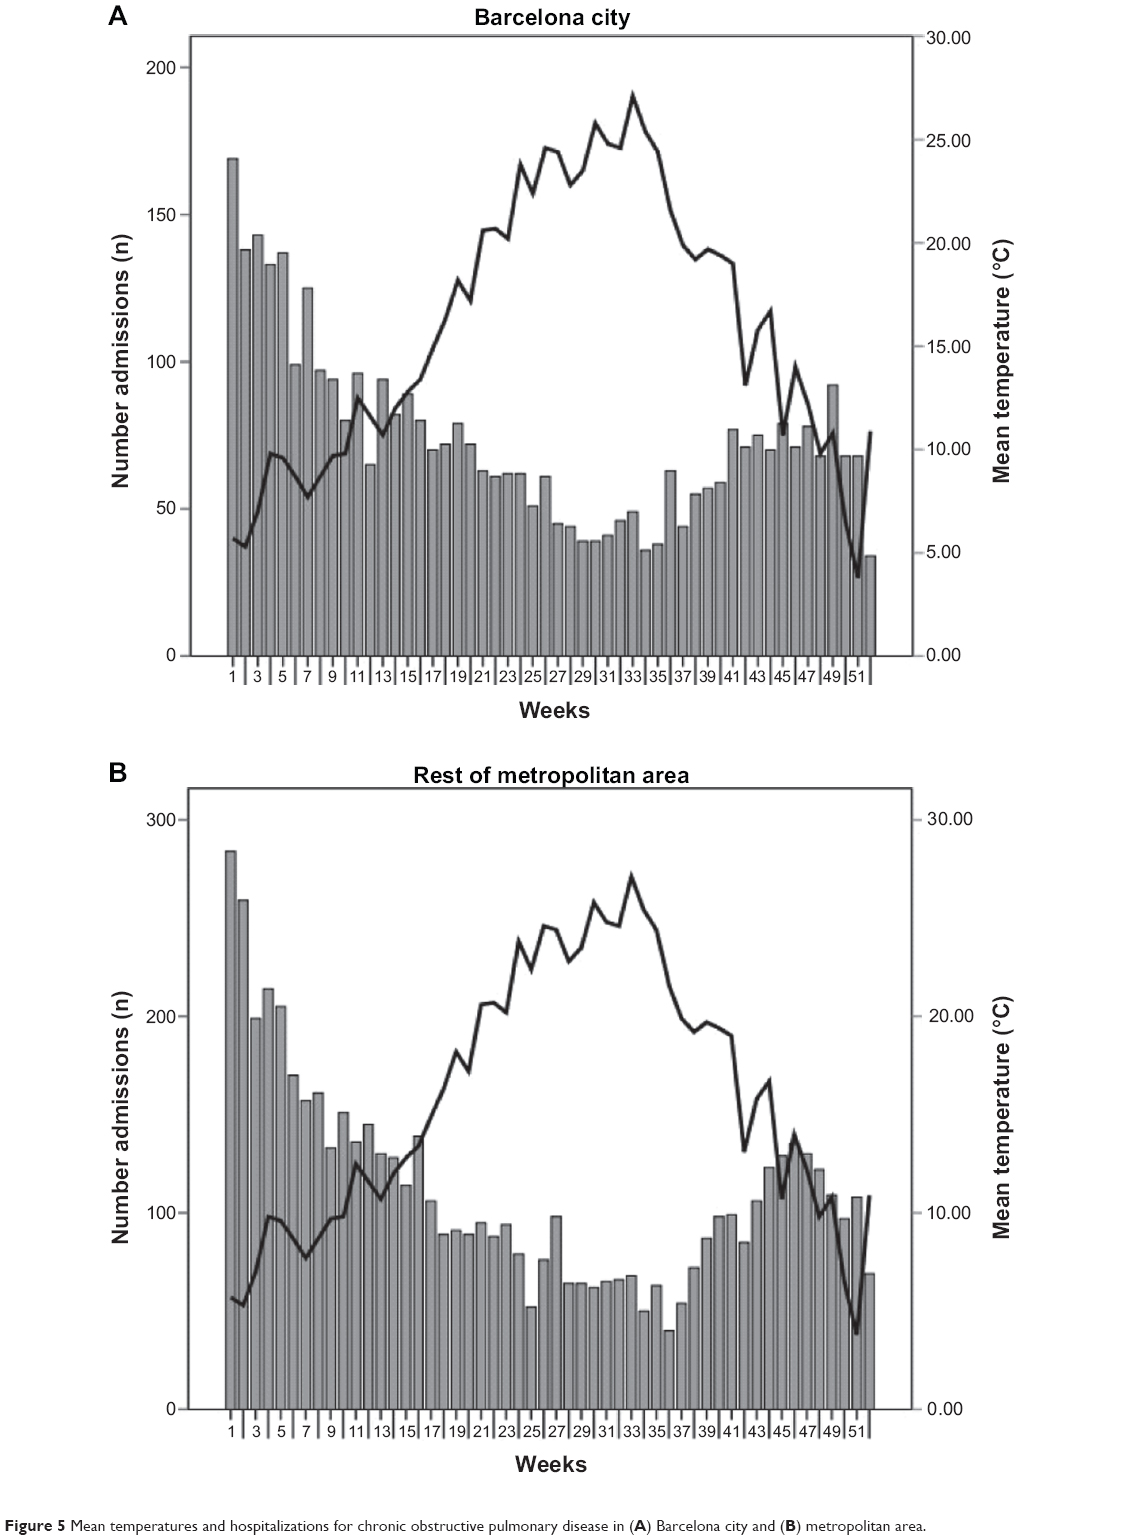 | Figure 5 Mean temperatures and hospitalizations for chronic obstructive pulmonary disease in (A) Barcelona city and (B) metropolitan area. |
The percent humidity was also significantly associated with the number of hospital admissions (P=0.002), although this effect disappeared after adjustment in the multivariate model (P=0.723).
During 2009, the new influenza virus A (H1N1) pandemic was present, with two peaks of incidence in the influenza rate between the first and third week and later between weeks 41 and 47 of the year. The number of outpatient consultations and home visits for influenza-like illness increased in the same weeks, so both were significantly more frequent in the autumn than in the other seasons (P<0.001, see Table 1). Overall, the influenza rate slightly increased the number of admissions but without statistical significance (P=0.052), even after adjusting for temperature (P=0.444).
To study the possible relationship between air pollution and number of hospital admissions, the highest level of pollution, expressed by mean weekly values (Catalonian Air Quality Index) was used. Over the year, the mean score obtained on the Catalonian Air Quality Index scale was 42.5±10.2, which, according to the scale detailed in the methods, corresponded to an acceptable air quality. When stratifying according to the air quality scale, 858 (8.8%) admissions occurred in weeks in which air quality was considered low (more pollution), 6,481 (66.1%) during weeks when it was estimated as acceptable, and 2,645 (26.1%) during periods when it was rated as satisfactory (less pollution). Weeks of pollution coincided with higher temperatures, although no significant differences were found between air pollution and number of hospital admissions (P=0.887).
In multivariate analysis, after adjustment for humidity, comorbidity, air pollution, and influenza rate, only mean temperatures retained statistical significance, with a mean increase of 4.70% weekly admissions for each Celsius degree decrease (r2=0.599, P<0.001, see Tables 2 and 3).
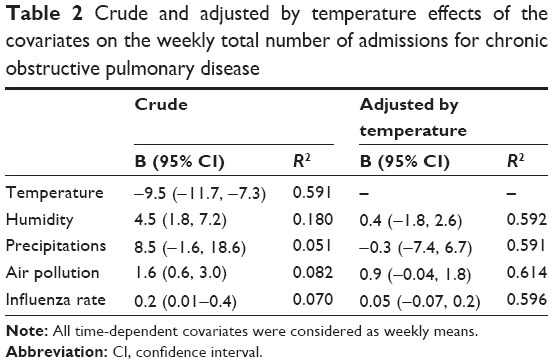 | Table 2 Crude and adjusted by temperature effects of the covariates on the weekly total number of admissions for chronic obstructive pulmonary disease |
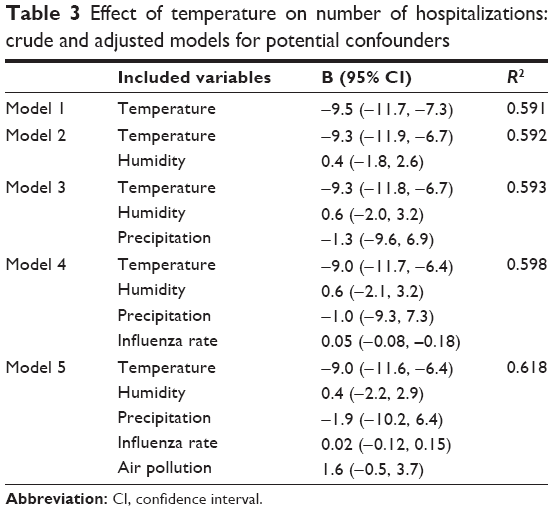 | Table 3 Effect of temperature on number of hospitalizations: crude and adjusted models for potential confounders |
Discussion
The main conclusion of our study is the independent relationship between ambient temperature and number of hospital admissions for exacerbation of COPD, regardless of humidity, influenza rate, comorbidity, or environmental pollution. Although the increase in COPD exacerbations and the higher number of hospital admissions during the winter season have been well known for years, the relationship with ambient temperature has scarcely been studied, and with contradictory conclusions.18 To the best of our knowledge, direct evidence of the relationship between temperature and hospitalizations is scarce.
Most epidemiological studies exploring the influence of temperature on cardiorespiratory diseases have focused mainly on the effect of heat. For example, a recent meta-analysis concerning the relationship between climate and cardiorespiratory morbidity found only three studies that examined the effect of cold in these pathologies.19 In another study performed in Copenhagen, the authors found a higher prevalence of hospitalizations for respiratory causes in the warmest months.20 These data are similar to a Canadian study that found an association between colder temperatures and cardiovascular diseases but not with respiratory diseases.21
In contrast, studies that have specifically analyzed COPD exacerbations show that numbers increase in the winter months, including the number of hospitalizations for exacerbation of COPD.22 Recently, two publications based on the TORCH and POET trials indicated that the numbers of COPD exacerbations and hospitalizations in winter were almost double those in summer, which is in agreement with our study. Regrettably, both studies were only able to perform the analysis stratified by month and seasonality, and therefore only indirectly considered ambient temperature, due to a lack of climate data analysis.12,13
There are very few studies about the role of temperature in the number and severity of COPD exacerbations. A study performed in Bavaria, Germany, showed an increase of 1% in outpatient visits for COPD for each Fahrenheit degree decrease.23 These results are similar to those of two other studies done in Taiwan, which found an increase of 0.8% in outpatient consultations for COPD exacerbations for each 1°C decrease in temperature and an increment of emergency room consultations in the colder months.24,25 Our data yield similar conclusions in a different climate and with more severe exacerbations, since it is centered on hospital admissions. Finally, a population-based study in Scotland confirmed an increase in hospital admissions for COPD with a decrease in monthly temperatures, especially in groups of lower socioeconomic status.26 Other studies link diurnal temperature range with emergency room visits for cardiovascular disease or mortality from COPD.27–30
The reasons for the increase in exacerbations with cold temperatures are complex and not entirely elucidated. The most plausible explanation is that the increase in viral infections acts as a trigger for exacerbation. It is well known that virus alone or associated with bacterial infection is present in around two thirds of COPD exacerbations. The most common virus is the human rhinovirus causing the common cold, which can be found in more than 50% of exacerbations, followed by respiratory syncytial virus, coronavirus, adenovirus, and others.30,31 Viral infections lead to increased basal inflammation being present in the airways of patients with COPD.34
Most respiratory viral infections in the northern and southern regions of the world have a seasonal pattern not observed in the tropics, and they have been associated with low temperatures, humidity, variations in patient physiology, and changes in social behavior.30 These respiratory infections are more common in winter, both in COPD patients and in the general population, and occur in a wide range of climates, being more closely related to temperature variations than to absolute temperatures. Recent research suggests that human rhinovirus infections, at least in children, are more severe in winter.34 Another possible explanation for the increased number of hospitalizations for COPD in winter is the decline in lung function with the cold, and the increased airway inflammation and longer duration of exacerbation experienced by COPD patients with decreasing temperatures.35–38
Our study confirms the low impact of the influenza A (H1N1) pandemic in 2009 on the number of hospitalizations for COPD. The pandemic in 2009 affected predominantly the young population, probably because of residual immunity in the elderly from previous antigenically similar virus exposure.39 Only 10% of patients hospitalized for influenza A in Catalonia in 2009 had a diagnosis of COPD.15
Other factors associated with an increase in COPD exacerbations in some studies are low humidity and higher air pollution levels, although their role appears less relevant than that of falling temperatures, and in our study their significance disappeared after adjustment for temperature.23,30,31,40–42
Our study has some limitations. First, the collected data about the number of COPD admissions were based on hospital discharge codes, so we cannot rule out errors inherent in coding or data not collected with the etiology of the exacerbation. The definition of discharge codes based on ICD-9 is used in all previous studies using this methodology and their accuracy has been validated in several studies.43,44 This limitation is common to all studies performed with the same methodology, and is partially compensated for by the large sample size.5 Additionally, our population was very similar in terms of sex, age, and length of stay to that reported in prospective cohort studies conducted in the same area.10,45
In conclusion, our study demonstrates an independent relationship between ambient temperature and the number of hospital admissions for COPD exacerbation even after adjustment for humidity, comorbidity, influenza syndromes, and air pollution.
Acknowledgment
We thank Tom Yohannan for his editorial assistance with this paper.
Disclosure
The authors report no conflicts of interest in this work.
References
World Health Organization. Global surveillance, prevention and control of chronic respiratory diseases: a comprehensive approach. Geneva, Switzerland: World Health Organization; 2007. Available from: http://whqlibdoc.who.int/publications/2007/9789241563468_eng.pdf. Accessed June 20, 2014. | ||
Lozano R, Naghavi M, Foreman K, et al. Global and regional mortality from 235 causes of death for 20 age groups in 1990 and 2010: a systematic analysis for the Global Burden of Disease Study 2010. Lancet. 2012;380:2095–2128. | ||
Vos T, Flaxman AD, Naghavi M, et al. Years lived with disability (YLDs) for 1160 sequelae of 289 diseases and injuries 1990–2010: a systematic analysis for the Global Burden of Disease Study 2010. Lancet. 2012;380:2163–2196. | ||
Almagro P, Calbo E, Ochoa de Echagüen A, et al. Mortality after hospitalization for COPD. Chest. 2002;121:1441–1448. | ||
Suissa S, Dell’Aniello S, Ernst P. Long-term natural history of chronic obstructive pulmonary disease: severe exacerbations and mortality. Thorax. 2012;67:957–963. | ||
Müllerova H, Maselli DJ, Locantore N, et al. Hospitalized exacerbations of chronic obstructive pulmonary disease: risk factors and outcomes in the ECLIPSE cohort. Chest. October 30, 2014. [Epub ahead of print]. | ||
Toy EL, Gallagher KF, Stanley EL, Swensen AR, Duh MS. The economic impact of exacerbations of chronic obstructive pulmonary disease and exacerbation definition: a review. COPD. 2010;7:214–228. | ||
Burtin C, Decramer M, Gosselink R, Janssens W, Troosters T. Rehabilitation and acute exacerbations. Eur Respir J. 2011;38:702–712. | ||
Fan VS, Ramsey SD, Make BJ, Martinez FJ. Physiologic variables and functional status independently predict COPD hospitalizations and emergency department visits in patients with severe COPD. COPD. 2007;4:29–39. | ||
Almagro P, Barreiro B, Ochoa de Echaguen A, et al. Risk factors for hospital readmission in patients with chronic obstructive pulmonary disease. Respiration. 2006;73:311–317. | ||
Almagro P, Cabrera FJ, Diez J, et al. Comorbidities and short-term prognosis in patients hospitalized for acute exacerbation of COPD: the EPOC en Servicios de Medicina Interna (ESMI) study. Chest. 2012;142:1126–1133. | ||
Jenkins CR, Celli B, Anderson JA, et al. Seasonality and determinants of moderate and severe COPD exacerbations in the TORCH study. Eur Respir J. 2012;39:38–45. | ||
Rabe KF, Fabbri LM, Vogelmeier C, et al. Seasonal distribution of COPD exacerbations in the prevention of exacerbations with tiotropium in COPD trial. Chest. 2013;143:711–719. | ||
Deyo RA, Cherkin DC, Ciol MA. Adapting a clinical comorbidity index for use with ICD-9 CM administrative databases. J Clin Epidemiol. 1992;45:613–619. | ||
Generalitat de Catalunya. Available from: http://www.gencat.cat/salut/depsalut/html/ca/dir3157/plapidirac.pdf. Accessed June 20, 2014. | ||
European Centre for Disease Prevention and Control. Available from: http://ecdc.europa.eu. Accessed June 20, 2014. | ||
Generalitat de Catalunya. Available from: http://www20.gencat.cat/portal/site/mediambient/menuitem. Accessed June 20, 2014. | ||
Ye X, Wolff R, Yu W, Vaneckova P, Pan X, Tong S. Ambient temperature and morbidity: a review of epidemiological evidence. Environ Health Perspect. 2012;120:19–28. | ||
Turner LR, Barnett AG, Connell D, Tong S. Ambient temperature and cardiorespiratory morbidity: a systematic review and meta-analysis. Epidemiology. 2012;23:594–606. | ||
Wichmann J, Andersen Z, Ketzel M, Ellermann T, Loft S. Apparent temperature and cause-specific emergency hospital admissions in Greater Copenhagen, Denmark. PLoS One. 2011;6:e22904. | ||
Lavigne E, Gasparrini A, Wang X, et al. Extreme ambient temperatures and cardiorespiratory emergency room visits: assessing risk by comorbid health conditions in a time series study. Environ Health. 2014;13:5. | ||
Otero González I, Blanco Aparicio M, Montero Martínez C, Valiño López P, Verea Hernando H. The epidemiology of COPD and asthma exacerbations in a general hospital. Arch Bronconeumol. 2002;38:256–262. | ||
Ferrari U, Exner T, Wanka ER, et al. Influence of air pressure, humidity, solar radiation, temperature, and wind speed on ambulatory visits due to chronic obstructive pulmonary disease in Bavaria, Germany. Int J Biometeorol. 2012;56:137–143. | ||
Tseng CM, Chen YT, Ou SM, et al. The effect of cold temperature on increased exacerbation of chronic obstructive pulmonary disease: a nationwide study. PLoS One. 2013;8:e57066. | ||
Kurai D, Saraya T, Ishii H, Takizawa H. Virus-induced exacerbations in asthma and COPD. Front Microbiol. 2013;4:293. | ||
Lim YH, Hong YC, Kim H. Effects of diurnal temperature range on cardiovascular and respiratory hospital admissions in Korea. Sci Total Environ. 2012;417:55–60. | ||
George SN, Garcha DS, Mackay AJ, et al. Human rhinovirus infection during naturally occurring COPD exacerbations. Eur Respir J. 2014;44:87–96. | ||
Liang WM, Liu WP, Kuo HW. Diurnal temperature range and emergency room admissions for chronic obstructive pulmonary disease in Taiwan. Int J Biometeorol. 2009;53:17–23. | ||
McAllister DA, Morling JR, Fischbacher CM, MacNee W, Wild SH. Socioeconomic deprivation increases the effect of winter on admissions to hospital with COPD: retrospective analysis of 10 years of national hospitalisation data. Prim Care Respir J. 2013;22:296–299. | ||
Song G, Chen G, Jiang L, et al. Diurnal temperature range as a novel risk factor for COPD death. Respirology. 2008;13:1066–1069. | ||
Wedzicha JA, Singh R, Mackay AJ. Acute COPD exacerbations. Clin Chest Med. 2014;35:157–163. | ||
Sloan C, Moore ML, Hartert T. Impact of pollution, climate, and sociodemographic factors on spatiotemporal dynamics of seasonal respiratory viruses. Clin Transl Sci. 2011;4:48–54. | ||
Mäkinen TM, Juvonen R, Jokelainen J, et al. Cold temperature and low humidity are associated with increased occurrence of respiratory tract infections. Respir Med. 2009;103:456–462. | ||
Lee WM, Lemanske RF Jr, Evans MD, et al. Human rhinovirus species and season of infection determine illness severity. Am J Respir Crit Care Med. 2012;186:886–891. | ||
Donaldson GC, Seemungal T, Jeffries DJ, Wedzicha JA. Effect of temperature on lung function and symptoms in chronic obstructive pulmonary disease. Eur Respir J. 1999;13:844–849. | ||
Bhowmik A, Seemungal TA, Donaldson GC, Wedzicha JA. Effects of exacerbations and seasonality on exhaled nitric oxide in COPD. Eur Respir J. 2005;26:1009–1015. | ||
Donaldson GC, Wedzicha JA. The causes and consequences of seasonal variation in COPD exacerbations. COPD. 2014;9:1101–1110. | ||
Donaldson GC, Goldring JJ, Wedzicha JA. Influence of season on exacerbation characteristics in patients with COPD. Chest. 2012;141:94–100. | ||
Bautista E, Chotpitayasunondh T, Gao Z, et al; Writing Committee of the WHO Consultation on Clinical Aspects of Pandemic (H1N1) 2009 Influenza. Clinical aspects of pandemic 2009 influenza A (H1N1) virus infection. N Engl J Med. 2010;362:1708–1719. | ||
Peacock JL, Anderson HR, Bremner SA, et al. Outdoor air pollution and respiratory health in patients with COPD. Thorax. 2011;66:591–596. | ||
Sunyer J, Sáez M, Murillo C, et al. Air pollution and emergency room admissions for chronic obstructive pulmonary disease: a 5-year study. Am J Epidemiol. 1993;137:701–705. | ||
Gan WQ, FitzGerald JM, Carlsten C, et al. Associations of ambient air pollution with chronic obstructive pulmonary disease hospitalization and mortality. Am J Respir Crit Care Med. 2013;187:721–727. | ||
Ford EA. Hospital discharges, readmissions, and emergency department visits for chronic obstructive pulmonary disease or bronchiectasis among US adults: findings from the Nationwide Inpatient Sample 2001–2012 and Nationwide Emergency Department Sample 2006–2011. Chest. November 6, 2014. [Epub ahead of print]. | ||
Lacasse Y, Daigle JM, Martin S, Maltais F. Validity of chronic obstructive pulmonary disease diagnoses in a large administrative database. Can Respir J. 2012;19:e5–e9. | ||
Escarrabill J, Torrente E, Esquinas C, et al. Clinical audit of patients hospitalized due to COPD exacerbation. MAG-1 Study. Arch Bronconeumol. November 3, 2014. [Epub ahead of print]. |
Supplementary materials
Method for calculating ICQA
Based on the concentration of pollutants listed in Table S1, the lowest level (worst air quality) of O3, PM10, CO, SO2, and NO2 was selected. The mean average of all the pollutants is considered the daily ICQA.
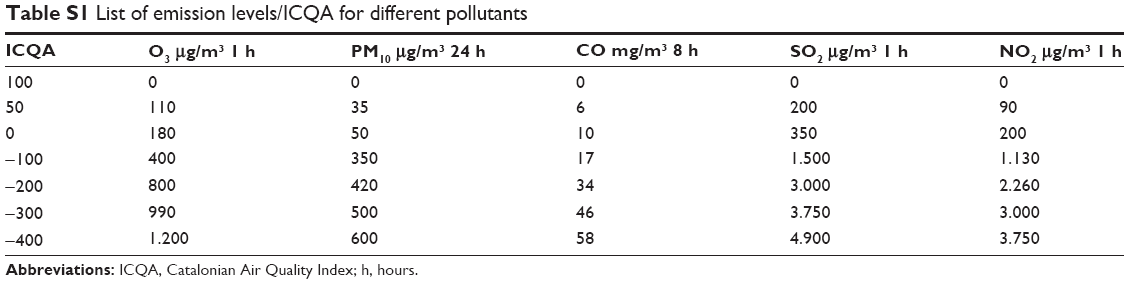 | Table S1 List of emission levels/ICQA for different pollutants |
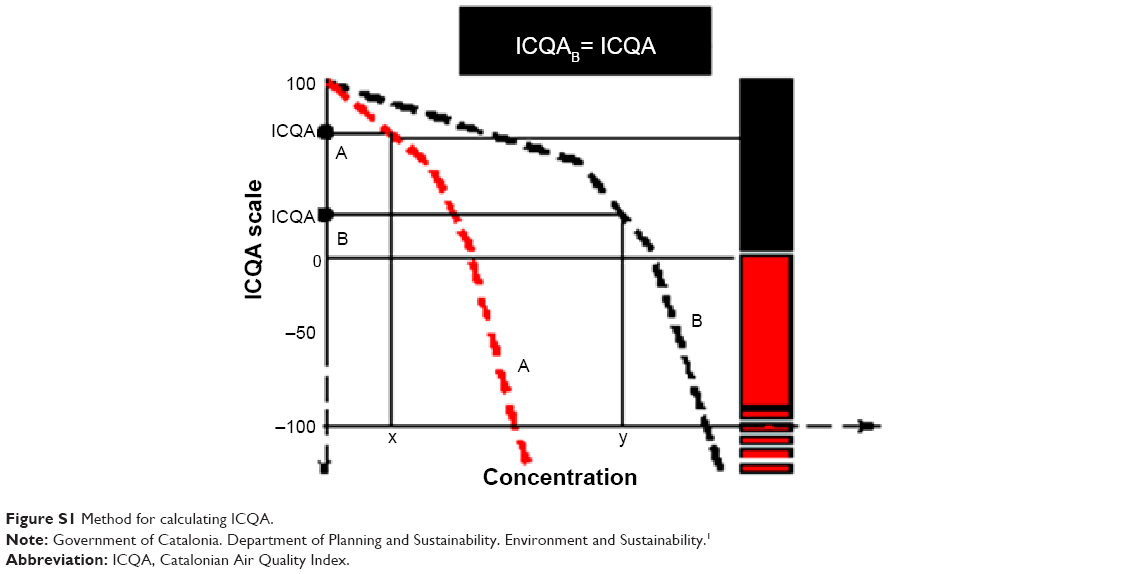 | Figure S1 Method for calculating ICQA. |
Reference
What is the Index Catalan Air Quality? [webpage on the website] Government of Catalonia (Generalitat de Catalunya), [updated 2013]. Available from: http://mediambient.gencat.cat/ca/05_ambits_dactuacio/atmosfera/qualitat_de_laire/avaluacio/icqa/que_es_lindex_catala_de_qualitat_de_laire/. Accessed June 20, 2014. |
 © 2015 The Author(s). This work is published and licensed by Dove Medical Press Limited. The full terms of this license are available at https://www.dovepress.com/terms.php and incorporate the Creative Commons Attribution - Non Commercial (unported, v3.0) License.
By accessing the work you hereby accept the Terms. Non-commercial uses of the work are permitted without any further permission from Dove Medical Press Limited, provided the work is properly attributed. For permission for commercial use of this work, please see paragraphs 4.2 and 5 of our Terms.
© 2015 The Author(s). This work is published and licensed by Dove Medical Press Limited. The full terms of this license are available at https://www.dovepress.com/terms.php and incorporate the Creative Commons Attribution - Non Commercial (unported, v3.0) License.
By accessing the work you hereby accept the Terms. Non-commercial uses of the work are permitted without any further permission from Dove Medical Press Limited, provided the work is properly attributed. For permission for commercial use of this work, please see paragraphs 4.2 and 5 of our Terms.