")
Back to Journals » International Journal of General Medicine » Volume 15
Screening of Potential Key Biomarkers for Ewing Sarcoma: Evidence from Gene Array Analysis
Authors Zhong D , Chen D, Zhang G, Lin S , Mei R, Yu X
Received 11 November 2021
Accepted for publication 2 February 2022
Published 5 March 2022 Volume 2022:15 Pages 2575—2588
DOI https://doi.org/10.2147/IJGM.S346251
Checked for plagiarism Yes
Review by Single anonymous peer review
Peer reviewer comments 2
Editor who approved publication: Dr Scott Fraser
Duming Zhong, Dan Chen, Guangquan Zhang, Shaobai Lin, Runhong Mei, Xuefeng Yu
Department of Orthopedics, The Fourth Affiliated Hospital of Nanchang University, Nanchang, People’s Republic of China
Correspondence: Xuefeng Yu; Runhong Mei, Email [email protected]; [email protected]
Background: Ewing’s sarcoma (ES) is a common bone cancer in children and adolescents. There are ethnic differences in the incidence and treatment effects. People have made great efforts to clarify the cause; however, the molecular mechanism of ES is still poorly understood.
Methods: We download the microarray datasets GSE68776, GSE45544 and GSE17674 from the Gene Expression Omnibus (GEO) database. The differentially expressed genes (DEGs) of the three datasets were screened and enrichment analysis was performed. STRING and Cytoscape were used to carry out module analysis, building a protein–protein interaction (PPI) network. Finally, a series of analyses such as survival analysis and immune infiltration analysis were performed on the selected genes.
Results: A total of 629 differentially expressed genes were screened, including 206 up-regulated genes and 423 down-regulated genes. The pathways and rich-functions of DEGs include protein activation cascade, carbohydrate binding, cell-cell adhesion junctions, mitotic cell cycle, p53 pathway, and cancer pathways. Then, a total of 10 hub genes were screened out. Biological process analysis showed that these genes were mainly enriched in mitotic nuclear division, protein kinase activity, cell division, cell cycle, and protein phosphorylation.
Conclusion: Survival analysis and multiple gene comparison analysis showed that CDCA8, MAD2L1 and FANCI may be involved in the occurrence and prognosis of ES. The purpose of our study is to clarify the DEG and key genes, which will help us know more about the molecular mechanisms of ES, provide potential pathway or targets for the diagnosis and treatment.
Keywords: Ewing sarcoma, biomarkers, microarray, differentially expressed genes, protein interaction
Introduction
ES is a poorly differentiated and aggressive tumor, which is called the three most common bone tumors together with osteosarcoma and chondrosarcoma.1–4 The origin of the tumor is not clear. Pathologically, a tumor composed of small and round cells is considered to be original in the neuroectoderm through electron microscopy and immunohistochemical analysis. Mesenchymal-stem cells, which are deemed to originate from primitive bone marrow, usually have the following features: Modified by fusion transcripts involving EWS-ERG or EWS-FLI1 genes.5–8 ES’s clinical manifestations are not specific, mainly manifested as local masses, pain, etc.; X-rays manifested as osmotic destruction of the backbone, with onion skin-like and needle-like periosteal reactions. There are ethnic differences in its incidence, that European and American populations is higher than that in Asian populations. There are also differences in treatment effects. Although researchers have worked hard to improve the treatment and diagnosis plan, people with metastases or relapses at the time of diagnosis still show poor prognosis.9 The wide application of bioinformatics analysis and microarray technology at the genomic level, especially the screening of gene heredity and variation, is conducive to our screening of functional pathways and differentially expressed genes involved in the ES mechanism. However, the independence and false positives of microarray analysis make it difficult for us to obtain reliable results. Therefore, to screen potential biomarkers of ES, we downloaded and analyzed 3 mRNA data sets from the Gene Expression Omnibus (GEO) database to obtain the DEGs between non-tumor tissue and tumor tissue. Subsequently, a series of analyses were carried out, such as protein interaction (PPI) network, gene ontology (GO), pathway enrichment analysis, immune analysis, survival analysis, etc., to help us understand the molecular mechanism of carcinogenesis. Finally, 629 DEGs and 10 hub genes were screened out.
Materials and Methods
Gene Chip Data
GEO10 is a public genomics database with a high storage capacity in the entire microarrays dataset and gene expression data. Three gene datasets were downloaded from GEO, which are GSE68776,11 GSE4554412,13 and GSE17674.14–16 Transform the platform probe information into corresponding gene symbols. The GSE68776 dataset contains 32 tumor biopsy specimens and 33 normal adult tissue samples. GSE45544 contains 8 Ewing sarcoma patient samples (MuET-x), 6 Ewing sarcoma patient samples (TUMK00XX) and 22 normal tissues (PBMC, spleen, thymus, stomach, uterus, fetal brain, fetal liver) sample. GSE17674 contains the Ewing sarcoma family from 44 tumor patients and 18 normal muscle samples.
DEG Recognition
GEO2R is an interactive web tool. Use GEO2R to compare multiple sets of samples to identify DEG across experimental conditions. The false discovery rate of Benjamini and Hochberg and the adjusted P-value (adj.P) can be used to limit false positives and find statistically significant genes. Adjust the probe set, delete the probe set without the corresponding gene symbol, and delete the gene with multiple probe sets. LogFC <-1 or logFC (fold change)> 1, adj.P <0.01, the above three conditions are considered to be statistically significant.
DEG’s GO and KEGG Enrichment Analysis
DAVID (The Database for Annotation, Visualization and Integrated Discovery) (v6.8)17 helps researchers understand the biological significance behind many genes through a comprehensive set of functional annotation tools. KEGG (https://www.kegg.jp) is a resource database, molecular data sets generated by genome sequencing and other high-throughput experimental technologies, using molecular-level large-scale information to understand biological systems.18 The gene ontology (GO) knowledge base is the world’s largest knowledge base of gene functions and information sources. The information in this knowledge base is the basis for the computational analysis of genetics and molecular biology experiments in biomedicine, that is readable by both humans and machines.19 DAVID online database was used for biological analysis of DEG, then, P<0.05 was considered statistically significant.
Network (PPI) and Module Analysis
STRING (V11.0) (http://string-db.org) is a database of predicted protein–protein interactions. The interactions include physical and functional associations, that originate from the transfer of information between predictive and computational organisms, as well as the interaction of other (main) database aggregations.20 Using STRING to analyze the function of proteins, that may provide information about the mechanism of related diseases. In our study, the STRING database was used to construct the DEG protein interaction network, and the interactions with a comprehensive score (supported by data)>0.4 were considered to be statistically significant. Cytoscape (v3.8.0) is an open-source application software used to visualize complex networks in bioinformatics and integrate network attribute data.21 Cytoscape’s plug-in MCODE (version v2.0.0) is used to cluster topology on a given network to find highly interconnected areas.22 CytoHubba (v0.1) is another plug-in in Cytoscape. It uses a variety of topology algorithms to explore and predict important nodes and subnets in the network.23 Use Cytoscape to make a protein interaction network (PPI), and then use MCODE to analyze the important modules. Select parameters: MCODE score>5, k score=2, degree cutoff=2, maximum depth=100, node score cutoff=0.2. Then filter out the key sub-networks, namely hub genes (a total of 10) through the cytoHubba in the module. Finally, use DAVID to analyze the hub genes by KEGG and GO.
Selection and Analysis of Key Genes
Oncomine is a tumor gene chip database that can be used to analyze gene expression differences and predict co-expressed genes. It can also be classified according to clinical information such as issue type, tumor stage and grade.24 Using the Oncomine database, under the Ewing’s sarcoma classification, the top ten co-expressed genes of each hub gene were selected. After being classified, a total of 85 genes including genes were obtained. Draw the co-expression network through String and Cytoscape. BiNGO (Biological Network Gene Oncology) (v3.0.3) is a web tool used to find that certain gene ontology (GO) are statistically overrepresented in a certain set of genes or biological networks.25 We used BiNGO, a plug-in of Cytoscape, to analyze the biological process of the hub gene and made a network interaction map. UCSC Xena is a multi-omics online exploration tool for clinical or phenotypic data.26 The hierarchical clusters and sample types of hub genes were constructed by UCSC Xena. TIMER is a broad resource tool for systematic analysis of cancer immune infiltration.27–29 TIMER (v2.0) was used to analyze the immune infiltration of hub genes, then, showed the correlation between gene expression and immune analysis, the correlation between gene expression and clinical. The hub gene sample code needs to be downloaded from the TCGA (The Cancer Genome Atlas) (https://portal.gdc.cancer.gov/) database for Immune infiltration analysis. OncoLnc (http://www.oncolnc.org) is a tool for interactively exploring the relevance of survival.30 Oncolnc was used to analyze the overall survival of hub genes. Seven genes were obtained through the results of survival analysis and immune correlation analysis. Then use Oncomine to analyze and compare the expression of 8 genes in different sarcoma types, and 3 key genes were screened out. Finally, analyze the correlation between the key gene’s expression and Ewing’s sarcoma tumor grade, stage, EWSR1-FLI1 fusion and TP53 mutation on Oncomine.
Results
Identify DEGs in Microarrays
After standardizing the microarray results, DEG was determined (8207 in GSE68776, 2115 in GSE45544, and 28893 in GSE17674) (Figure 1A). As is shown, the picture of Venn (Figure 1B), the overlap between these 3 datasets contains 629 genes, consisting of 423 down-regulated and 206 up-regulated genes between ES tissue and non-cancer tissue.
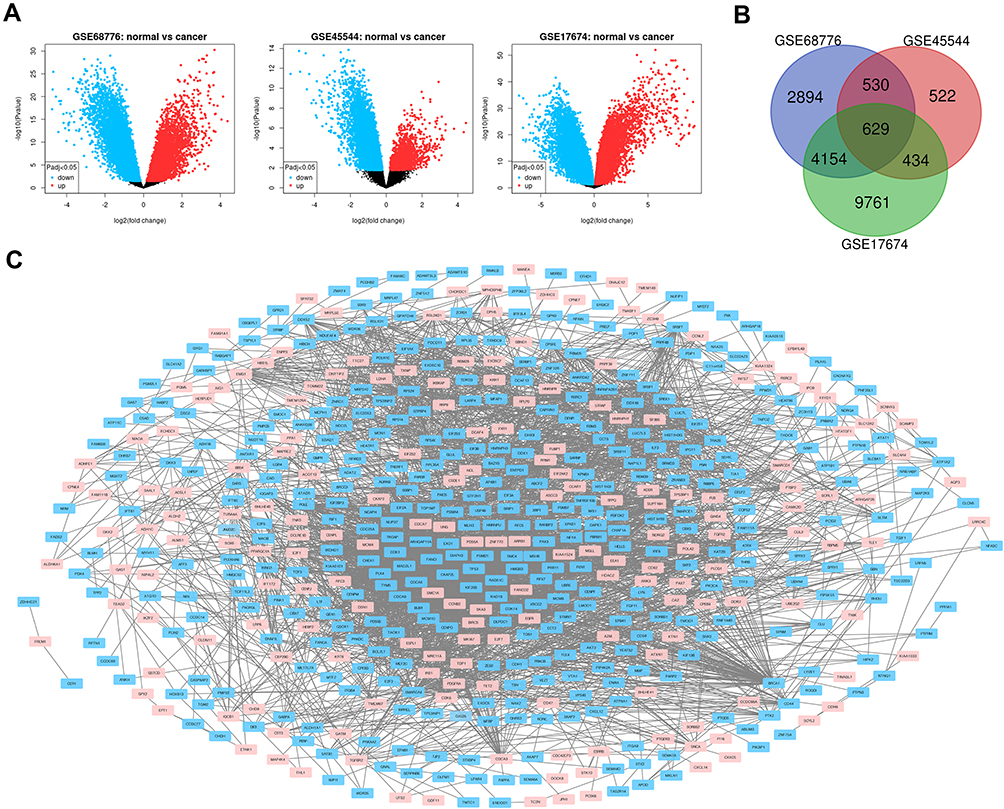 |
Figure 1 (A) The volcano plot shows the relationship between the fold change and the P value in each group of microarrays. Red is an up-regulated gene, and blue is a down-regulated gene. Adjust P value <0.05. (B) Venn diagram, select DEG fold change> 2, P value <0.01, 3 microarray data sets show that 629 genes overlap. (C) 629DEG’s PPI network. |
GO and KEGG Enrichment Analysis of DEG
The functions and pathways of DEGs were analyzed by DAVID. GO analysis results showed that the biological process (BP) changes of DEGs were significantly obvious in protein phosphorylation, regulation of related pathways by p53 mediator, intercellular adhesion, and mitotic cell cycle. The changes in molecular function (MF) mainly includes protein kinase activity, carbohydrate binding, cadherin binding involved in cell-cell adhesion, oxidoreductase activity, and protein serine/threonine kinase activity. The cell composition (CC) changes of DEGs mainly includes sarcoma, spindle pole, and cell adhesion junctions. KEGG pathway analysis shows that DEG is mainly rich in cell cycle, glioma, cancer pathway and P53 pathway (Table 1).
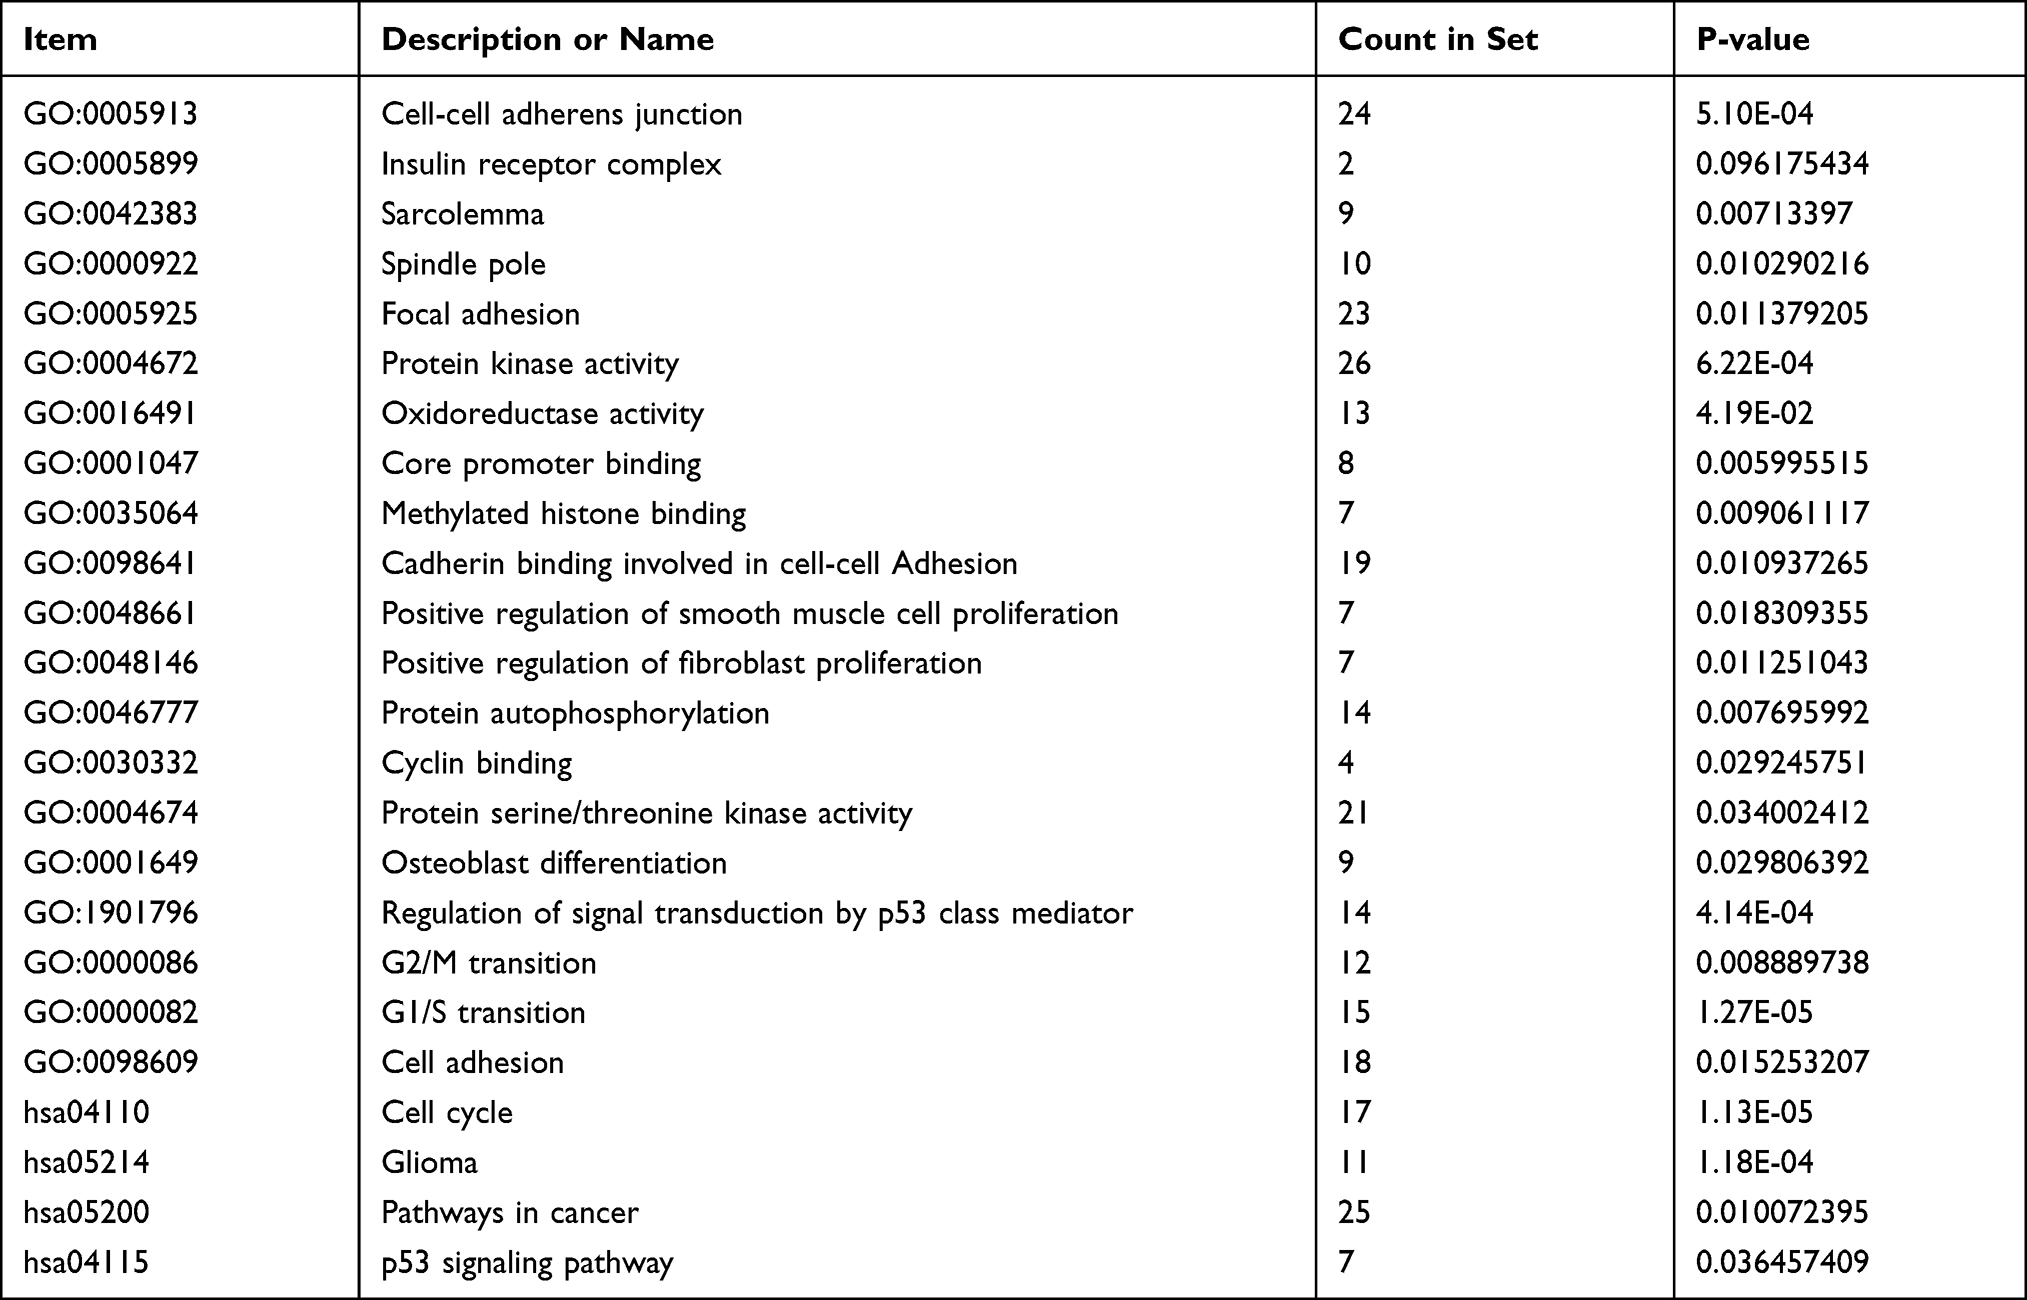 |
Table 1 Enrichment Analysis (629DEG’s) |
PPI Network and Module Construction
The PPI network (Figure 1C) and the most important modules (Figure 2A) were built through Cytoscape. CytoHubba was then used to screen out the genes (Figure 2B), of which CCNB2 is an up-regulated gene, and the rest are the down-regulated genes. The functional analysis of hub genes by DAVID showed that the up-regulated genes in this module are mainly enriched in cell division and cycle, mitosis, protein binding, etc., and the down-regulated genes are mainly enriched in protein kinase activity, protein localization to kinetochore, protein phosphorylation, chromosome centromere regions, etc. (Table 2).
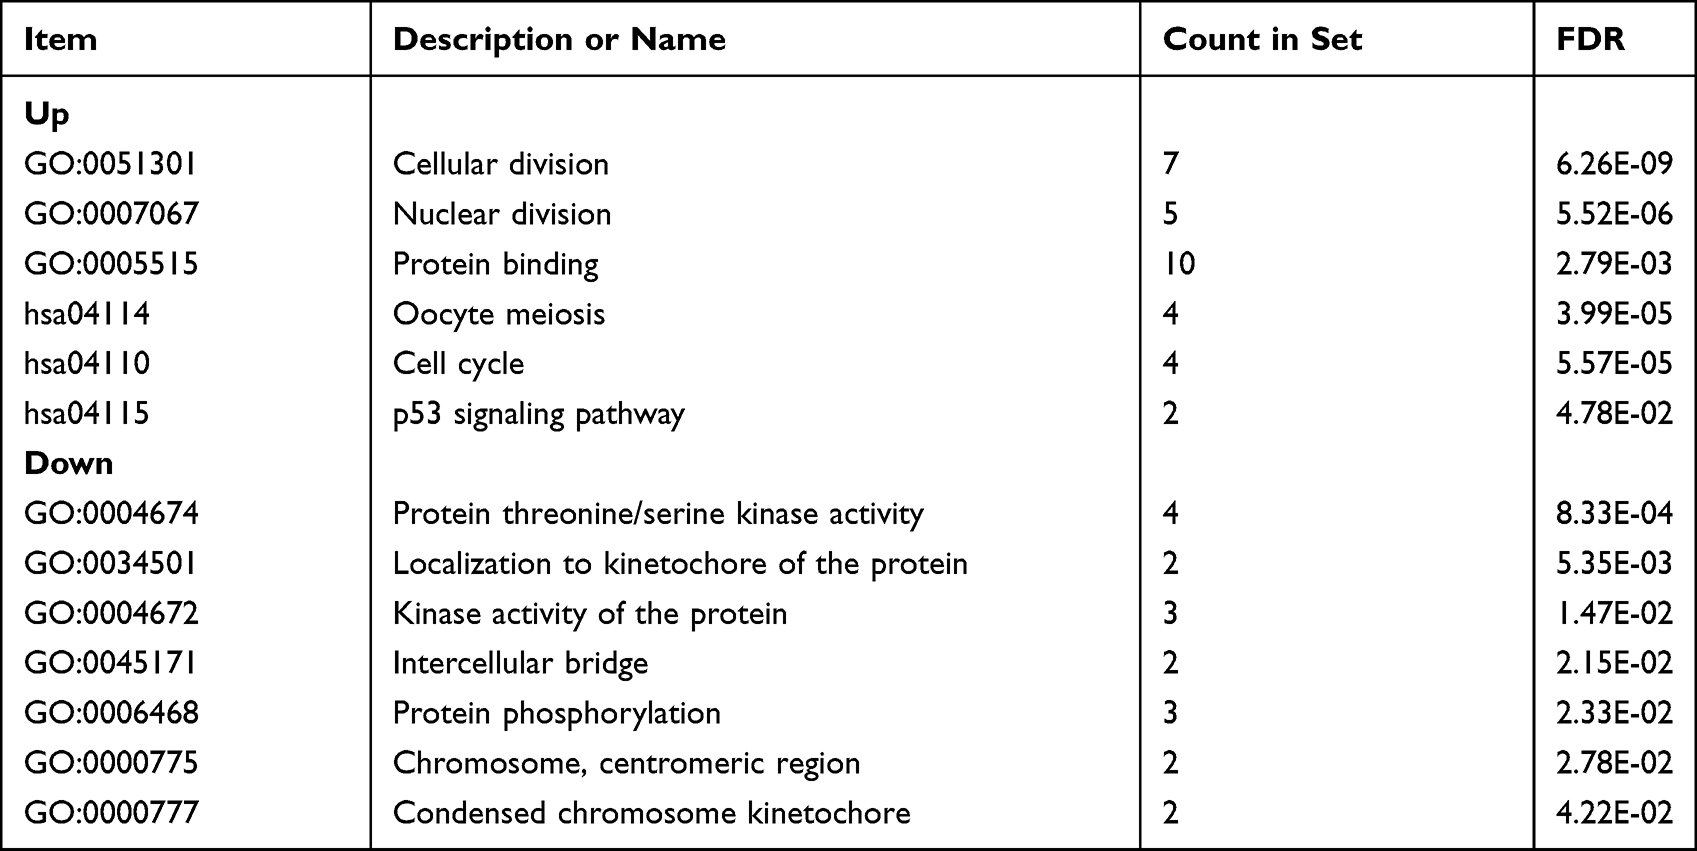 |
Table 2 Enrichment Analysis (10DEG’s) |
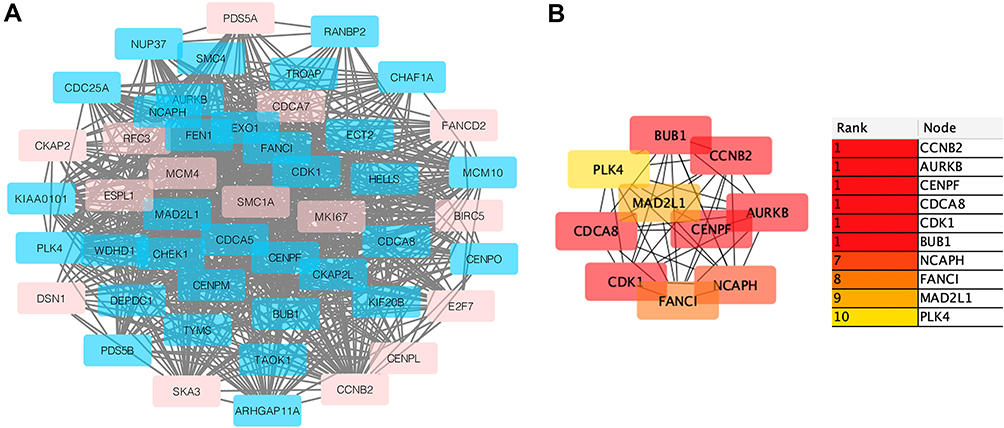 |
Figure 2 (A) The important module is obtained from a PPI network with 48 nodes and 782 edges. Red is an up-regulated gene; light blue is a down-regulated gene. (B) Using cytohubba’s MCC algorithm to screen out the top ten genes in the module, we can see the connection between them. The weight of these genes in the module network becomes higher as the color darkens. |
Selection and Analysis of Key Genes
We screened out 10 hub genes. The names and functions of these genes are shown in Table 3. Oncomine, String and Cytoscape were used to plot the co-expression network of these genes (Figure 3A) and biological process analysis diagram (Figure 3B). Through hierarchical clustering, we can see that pivot genes can basically distinguish ES samples from non-tumor samples (Figure 4A). The correlation between gene expression and clinical results (Figure 4B) showed that among 260 patients with sarcoma, the expression levels of AURKB, BUB1, CDCA8, CDK1, MAD2L1, and MCOPH were higher. The correlation between immune infiltration and gene expression is shown in Figure 5. Survival analysis showed that the overall survival rate of patients with CDCA8, NCAPH, CDK1, MAD2L1, CCNB2, and FANCI was relatively high (>30%) (Figure 6). Combining the results obtained in Figures 4B, 6 and 8 genes (AURKB, BUB1, CDCA8, CDK1, MAD2L1, FANCI, NCAPH and CCNB2) were screened out. Through the screening of 8 genes, the key genes are CDCA8, MAD2L1 and FANCI (Figure 7). Finally, the analysis lists several expression patterns of the three genes that are relatively important in ES (Figure 8). Based on the above analysis, it is suggested that CDCA8, MAD2L1 and FANCI may have a great importance in the occurrence or progression of ES.
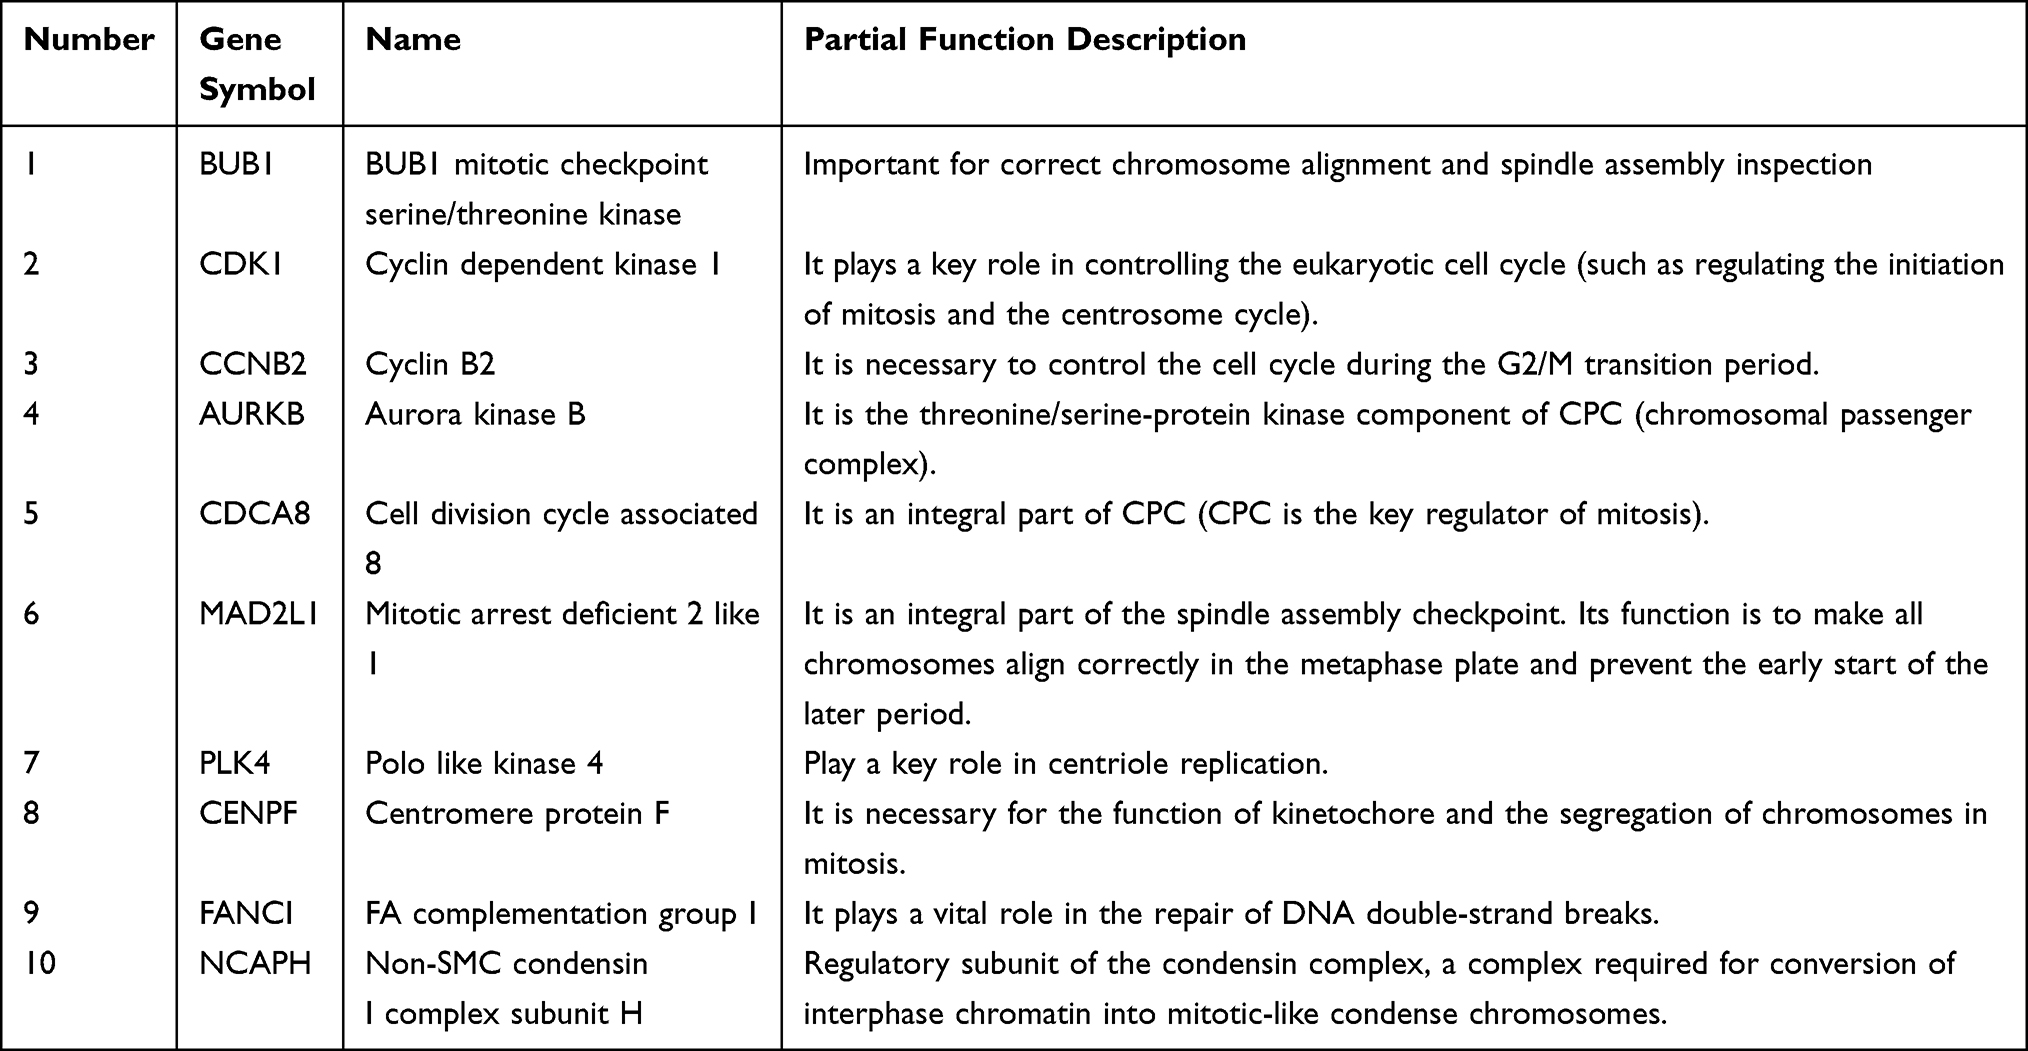 |
Table 3 Annotation (10DEG’s) |
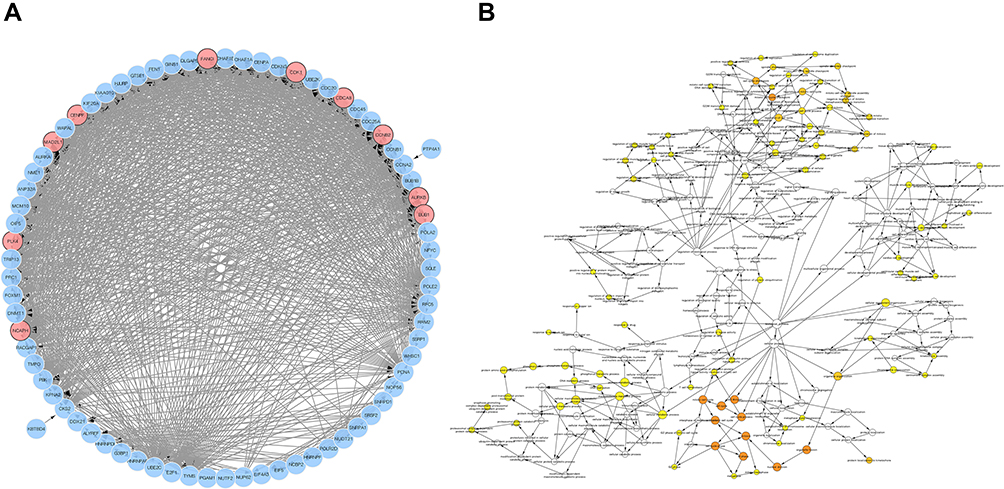 |
Figure 3 PPI-network and Bioanalysis chart. (A) Co-expression of hub genes. The blue nodes are co-expressed genes, and the red nodes are hub genes. (B) Some biological process diagrams of hub genes. The size of the node refers to the ontology of the gene. The color depth of the node refers to the adjusted P value. |
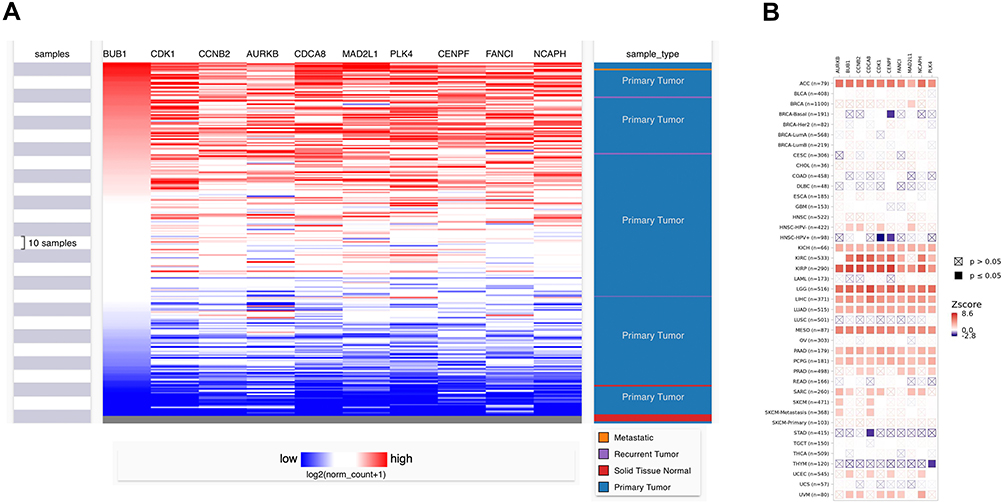 |
Figure 4 (A) Hierarchical clustering: down-regulated genes are marked in blue, and up-regulated genes are marked in red. Sample type: Different colors in the picture correspond to different sample types. The sarcoma sample data (n=271) comes from the TCGA database. P<0.05 is considered statistically significant. (B) The correlation between gene expression and clinical outcome. (SARC, n=260). |
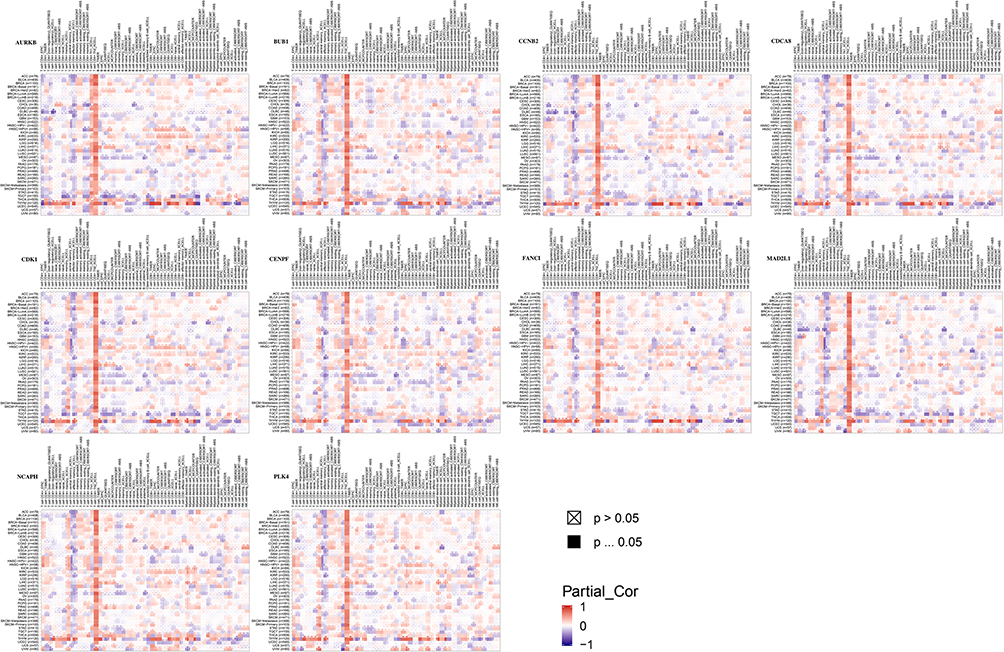 |
Figure 5 The relationship between gene expression and immune infiltration. |
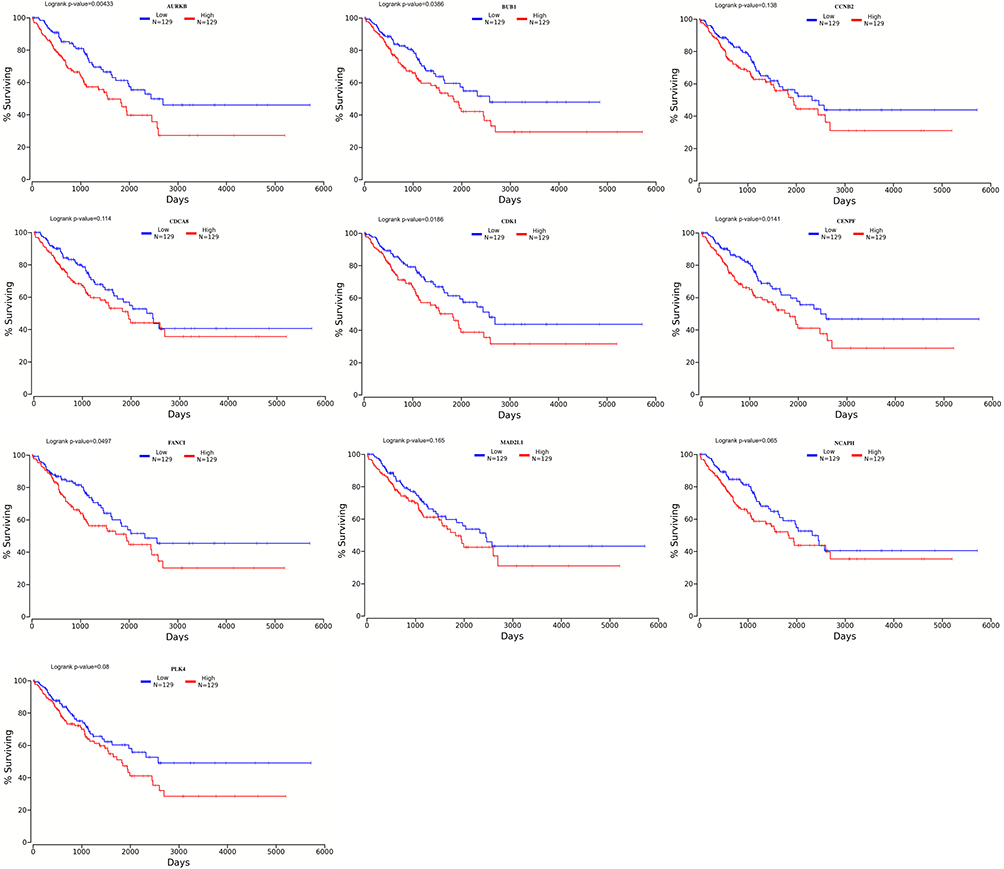 |
Figure 6 Survival analysis. CDCA8, NACPH, CDK1, MAD2L1, CCNB2 and FANCI have a relatively high overall survival rate (>30%). P<0.05 was considered statistically significant. |
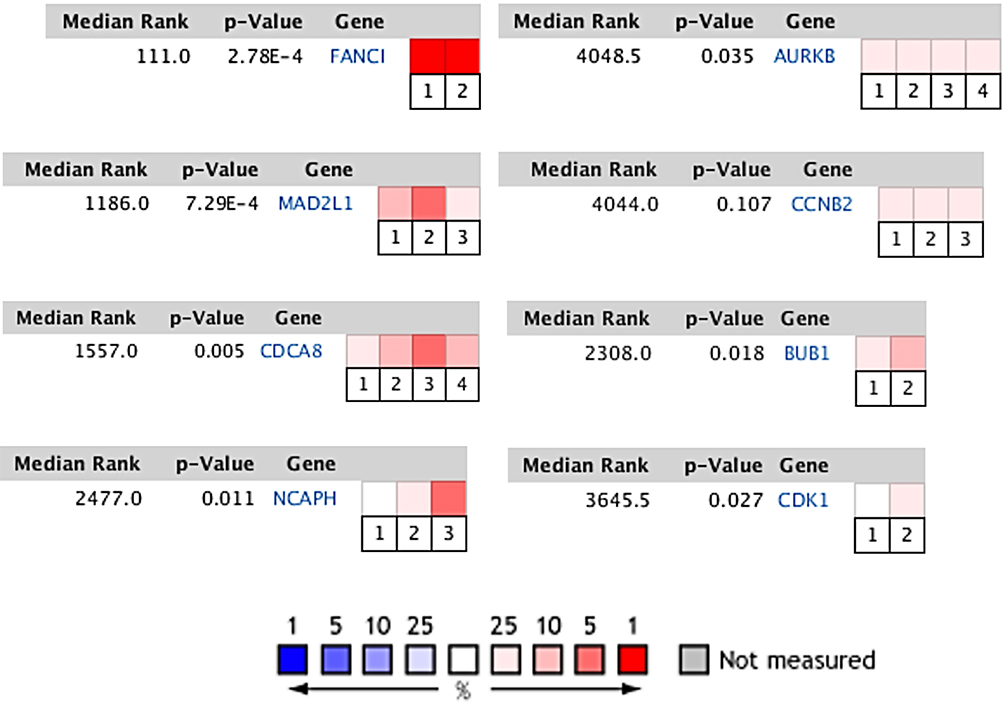 |
Figure 7 Comparison of genes in multiple analyses. FANCI: Cancer Type: Sarcoma. 1. Neale Multi-cancer. 2. Neale Multi-cancer 2; MAD2L1: Cancer Type: Sarcoma. 1. Barretina CellLine 2. 2. Neale Multi-cancer. 3. Rothenberg CellLine; CDCA8: Cancer Type: Sarcoma. 1. Barretina CellLine 2. 2. Neale Multi-cancer. 3. Neale Multi-cancer 2. 4. Rothenberg CellLine; NCAPH: Sarcoma Type: Ewing’s Sarcoma. 1. Baird Sarcoma. Cancer Type: Sarcoma. 2. Neale Multi-cancer. 3. Neale Multi-cancer 2; AURKB: Cancer Type: Sarcoma. 1. Barretina CellLine 2. 2. Bittner Multi-cancer. 3. Neale Multi-cancer. 4. Wooster CellLine; CCNB2: Sarcoma Type: Ewing’s Sarcoma. 1. Bittner Sarcoma. Cancer Type: Sarcoma. 2. Neale Multi-cancer. 3. Rothenberg CellLine; BUB1: Cancer Type: Sarcoma. 1. Bittner Multi-cancer. Sarcoma Type: Ewing’s Sarcoma. 2. Henderson Sarcoma; CDK1: Sarcoma Type: Ewing’s Sarcoma. 1. Baird Sarcoma. Cancer Type: Sarcoma. 2. Barretina CellLine 2. The rank for a gene is the median rank for that gene across each of the analyses. The p-value for a gene is its p-value for the median-ranked analysis. In the heat map of 8 genes, CDCA8, MAD2L1 and FANCI have more or higher expressions. |
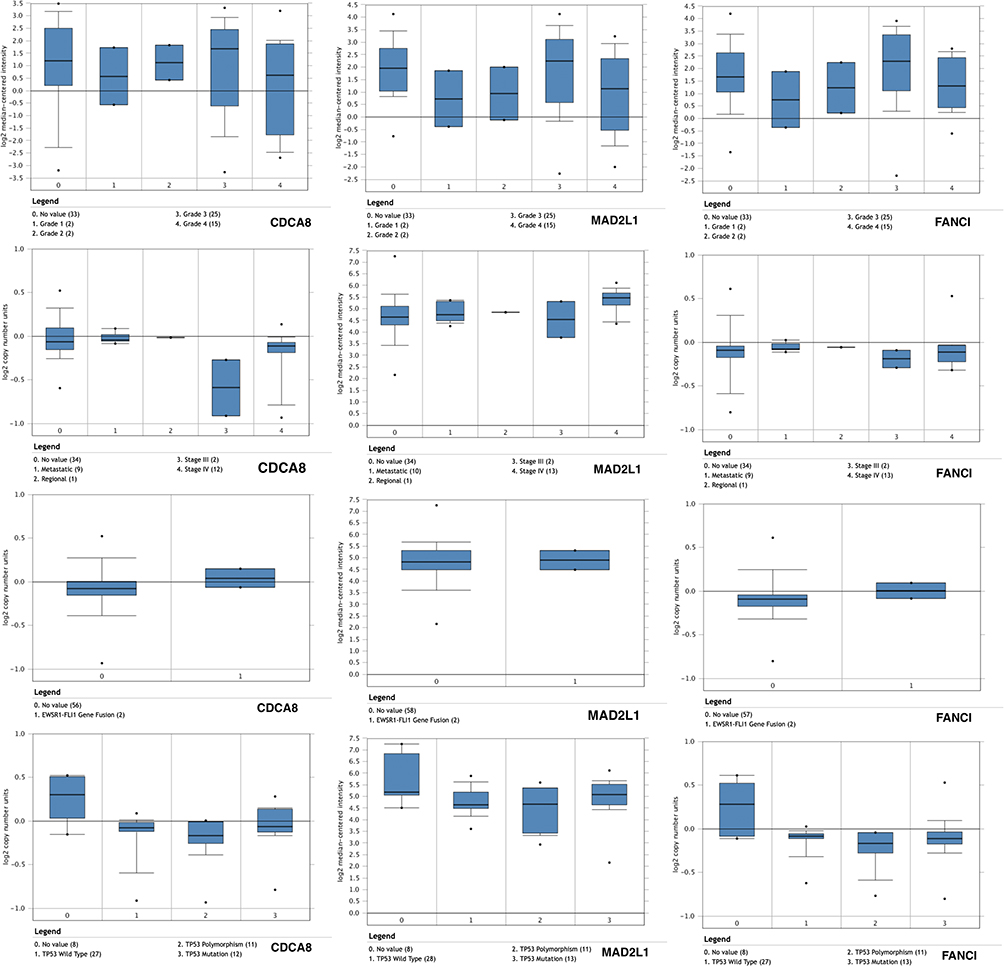 |
Figure 8 The relationship between the expression of genes (CDCA8, MAD2L1 and FANCI) and clinical Ewing’s sarcoma grade, staging, EWSR1-FLI1 pathway and tp53 mutation pathway. MAD2L1 has higher expression in the four cases, while CDCA8 and FANCI have higher expression in the grades of ES. |
Discussion
In the past few years, constantly updated technologies have made contributions to obtain more accurate diagnosis and finer classification of diseases, that have highlighted the importance of molecular heterogeneity between and within tumors and secondary genetic changes. Some new large-scale sequencing technologies have helped exploration the genomic pattern of Ewing’s sarcoma, proving that ES is a cancer related to gene fusion, and belongs to the transcription factor family of EWSR1 and ETS (especially FLI1) repeated translocations.31–33 Similar to other cancers caused by gene fusions, ESFT has a low somatic mutation load, indicating that the fusion of EWSR1-ETS has an advantage as a driver. We also need to pay attention to mutations that lead to cancer recurrence, including several tumor suppressors such as STAG2, TP53 and CDKN2A. More notably, ESFT shows obvious mutations in genes involved in the kinase signaling pathway.34 Targeted fusion is achieved through changes in the related transcriptome or epigenome, It has always been an active and challenging field.
In this study, we analyzed 3 mRNA microarray data sets and screened out 629 differentially expressed genes (423 down-regulated and 206 up-regulated genes). Then the hub gene was identified for functional enrichment analysis to explore the interaction between DEGs. The down-regulated genes are mainly enriched in kinase activity, protein localization to kinetochore, protein phosphorylation, chromosome centromeric regions, etc. The up-regulated genes are mainly enriched in protein binding, cell cycle and cell division, etc. We all know that mitosis and cell cycle processes have a great influence on tumor dysregulation.35–37 Many tumor processes also involve protein kinases. For instance, in various human malignant tumors, it is very common for Protein kinases to facilitate signal transduction of MAPK/ERK, making it the key molecule in the dysregulation of this pathway. Consequently, the MAPK becomes a key signaling pathway involved in tumorigenesis and regulating the uptake of glucose by malignant cells.38 Phosphorylation is a relatively common post-translational modification (PTM), which regulates many cell functions under healthy conditions. However, changes in the phosphorylation pathway can lead to serious diseases, especially cancer.39 The instability of chromosomes is considered a portent of bad tumors; and the strict regulation of the region where the kinetochore and chromosome centromere are combined also reveals the possible role of RNA on the centromere.44 In short, these theories and our results finally coincide.
Among the 10 genes we screened, CDCA8, MAD2L1 and FANCI are of great significance. Some studies have shown that overexpression of CDCA8 contributes to the proliferation of tumor cells, such as colorectal cancer and lung cancer cells.40,41 In addition, high CDCA8 expression has also been found to indicate a poor prognosis for gastric cancer.42 However, there is currently no evidence suggesting that CDCA8 is a specific marker for the above tumors. Based on RNA sequencing, bioinformatics analysis, and protein levels, CDCA8 silencing can down-regulate the levels of cyclin B1 and p-cdc2 and explain how it induces G2/M arrest.43 Selective suppression of the CDCA8-AURKB pathway may also become an effective way to treat cancer.40 According to our research, CDCA8 may be a potential treatment target for ES, but it has yet to be confirmed. MAD2L is associated with mitochondrial checkpoints. Defects in the control of mitotic checkpoints are thought to contribute to chromosomal instability and aneuploidy.44 Some studies suggest that MAD2L1 is associated with endometrial cancer, gastric cancer, and liver cancer. In the case of endometrial cancer with lymphatic metastasis, MAD2L1 is significantly overexpressed.45 In gastric cancer, the up-regulation of miR-30a-3p can reduce the expression of MAD2L1, which in turn inhibits its cell proliferation.46 In addition, certain changes in HCC cells (such as proliferation and migration)47 can be controlled by restraining MAD2L1 and miR-200c-5p. Therefore, defects in mitotic checkpoints may help to increase the sensitivity of certain tumor cells to mitotic spindle inhibitors. We highly suspect that MAD2L may affect the mitosis process of ES cells, according to the analysis of MAD2L1 in Figure 8. In the study of FANCI gene expression, most of them are related to malignant hematological diseases of children, but reports related to lung cancer and breast cancer are also not rare. Children’s FANCI gene was detected in 94 genes related to hematological malignancies. The sequence analysis and testing of this gene was done by the US INVITAE laboratory.48 In lung adenocarcinoma tissues, compared with neighboring normal tissues, the mRNA and protein of FANCI are overexpressed.49 According to a recent study, FANCI may promote cell metabolism when DNA repair is not required.50 Importantly, a study verified that there is a certain relationship between FANCI and sarcoma. They observed that 9 of 66 patients (13.6%) had 10 types (including FANCI and TP53) cancer-related genes contain at least one germline mutation gene that can predict disease. They also successfully verified that the two variants (FANCE and FANCI) did not show a loss of heterozygosity, but structural data indicated that the positions of these two genes were related to important protein interactions.51–53 This finding further supports our belief that FANCI may be one of the potential key biomarkers of Ewing’s sarcoma.
Document retrieval results indicate that the interaction between Ewing’s sarcoma and hub genes (BUB1, CDK1, CCNB2, AURKB, PLK4, CENPF, and NCAPH) has not been widely reported. Overexpression of BUB1 plays an important role in breast cancer.54 Dysregulated mitotic kinases are often associated with cancer. In addition, miR-10b, which is highly related to the BUB1 gene, was down-regulated in osteosarcoma samples.55 Some scholars proposed that CDK1 may be related to breast cancer and explained that circMETTL3 affects breast cancer through the circMETTL3/miR-31-5p/CDK1 axis.56 In pancreatic cancer cells driven by K-Ras, knocking out cell cycle regulators CDK1 (or CDK2) or transcription regulators CDK7 (or CDK9) is as effective as knocking out K-Ras.57 The high expression of CCNB2 has some effects on bladder cancer, lung cancer and colorectal cancer.58,59 The expression of AURKB is often associated with lung cancer and liver cancer. They believe that the interaction between RB1 and AURKB may be related to the small cell lung cancer driver.60 PLK4 is associated with lung cancer and tumors of the reproductive system, nervous system, digestive system, etc. According to data, Plk4 is widely over-expressed in tumor samples from cancer patients.61 The abnormal expression of CENPF is related to many malignant tumors, including liver cancer and breast cancer.62–65 Studies have shown that the interaction between LANA and CENPF has an impact on the genome of Kaposi’s sarcoma-associated herpes virus (KSHV).66 The expression of NCAPH is related to breast cancer, lung cancer and colon cancer. In patients with hormone receptor-related breast cancer, the upregulation of NCAPH indicates a poor prognosis.67 The expression of NCAPH and Mcl-1 suggests that patients with non-small cell lung cancer may have a poor prognosis.68 Many NCAPH mutations have been found in patients with colon cancer.69
In summary, this study aims to screen and identify DEGs that may be involved in the carcinogenesis or progression of ES. 629 DEGs and 10 hub genes were screened using the public gene expression comprehensive dataset. Furthermore, survival analysis suggested that CDCA8, NACPH, CDK1, MAD2L1, CCNB2 and FANCI were significantly associated with patient prognosis. Especially CDCA8, MAD2L1 and FANCI which may provide new clues for studying the mechanism of ES from the perspective of bioinformatics. However, further experiments and exploration are still needed to verify these results.
Ethics Statement
All the original data in this study are derived from public databases. Among them, human-related data is based on the Ministry of Health’s “Measures for the Ethical Review of Biomedical Research Involving People (Trial) (2016)”, WMA “Declaration of Helsinki” and CIOMS “Human Biomedical Research” The ethical principles of the International Ethics Guide have been reviewed by the Ethics Committee of the Fourth Affiliated Hospital of Nanchang University and agreed to be used.
Acknowledgment
We would like to thank Ms. Yuhan Wang for facilitating manuscript structure and text editing.
Author Contributions
All authors made a significant contribution to the work reported, whether that is in the conception, study design, execution, acquisition of data, analysis and interpretation, or in all these areas; took part in drafting, revising or critically reviewing the article; gave final approval of the version to be published; have agreed on the journal to which the article has been submitted; and agree to be accountable for all aspects of the work.
Funding
This study was supported by the Special Innovation Fund for Postgraduates of Jiangxi Province (YC2020-B044).
Disclosure
The authors of this article declare that they have no conflicts of interest related to this work.
References
1. Esiashvili N, Goodman M, Marcus RB
2. Ward E, DeSantis C, Robbins A, Kohler B, Jemal A. Childhood and adolescent cancer statistics, 2014. CA Cancer J Clin. 2014;64(2):83–103. PMID: 24488779. doi:10.3322/caac.21219
3. Biermann JS, Chow W, Reed DR, et al. NCCN guidelines insights: bone cancer, version 2.2017. J Natl Compr Canc Netw. 2017;15(2):155–167. PMID: 28188186. doi:10.6004/jnccn.2017.0017
4. Mirabello L, Troisi RJ, Savage SA. Osteosarcoma incidence and survival rates from 1973 to 2004: data from the surveillance, epidemiology, and end results program. Cancer. 2009;115(7):1531–1543. PMID: 19197972; PMCID: PMCPMC2813207. doi:10.1002/cncr.24121
5. Delattre O, Zucman J, Melot T, et al. The Ewing family of tumors–a subgroup of small-round-cell tumors defined by specific chimeric transcripts. N Engl J Med. 1994;331(5):294–299. PMID: 8022439. doi:10.1056/nejm199408043310503
6. Jaffe R, Santamaria M, Yunis EJ, et al. The neuroectodermal tumor of bone. Am J Surg Pathol. 1984;8(12):885–898. PMID: 6083729. doi:10.1097/00000478-198412000-00001
7. Carlei F, Polak JM, Ceccamea A, et al. Neuronal and glial markers in tumours of neuroblastic origin. Virchows Arch a Pathol Anat Histopathol. 1984;404(3):313–324. PMID: 6149650. doi:10.1007/bf00694896
8. Hashimoto H, Enjoji M, Nakajima T, Kiryu H, Daimaru Y. Malignant neuroepithelioma (peripheral neuroblastoma). A clinicopathologic study of 15 cases. Am J Surg Pathol. 1983;7(4):309–318. PMID: 6869663. doi:10.1097/00000478-198306000-00002
9. Bellan DG, Filho RJ, Garcia JG, et al. Ewing’s sarcoma: epidemiology and prognosis for patients treated at the pediatric oncology institute, iop-graacc-unifesP. Rev Bras Ortop. 2012;47(4):446–450. PMID: 27047848; PMCID: PMCPMC4799471. doi:10.1016/s2255-4971(15)30126-9
10. Barrett T, Troup DB, Wilhite SE, et al. NCBI GEO: mining tens of millions of expression profiles–database and tools update. Nucleic Acids Res. 2007;35:D760–D765. PMID: 17099226; PMCID: PMCPMC1669752. doi:10.1093/nar/gkl887
11. Svoboda LK, Harris A, Bailey NJ, et al. Overexpression of HOX genes is prevalent in Ewing sarcoma and is associated with altered epigenetic regulation of developmental transcription programs. Epigenetics. 2014;9(12):1613–1625. PMID: 25625846; PMCID: PMCPMC4622732. doi:10.4161/15592294.2014.988048
12. Specht K, Sung YS, Zhang L, Richter GH, Fletcher CD, Antonescu CR. Distinct transcriptional signature and immunoprofile of CIC-DUX4 fusion-positive round cell tumors compared to EWSR1-rearranged Ewing sarcomas: further evidence toward distinct pathologic entities. Genes Chromosom Cancer. 2014;53(7):622–633. PMID: 24723486; PMCID: PMCPMC4108073. doi:10.1002/gcc.22172
13. Agelopoulos K, Richter GH, Schmidt E, et al. Deep sequencing in conjunction with expression and functional analyses reveals activation of FGFR1 in Ewing sarcoma. Clin Cancer Res. 2015;21(21):4935–4946. PMID: 26179511. doi:10.1158/1078-0432.Ccr-14-2744
14. Savola S, Klami A, Myllykangas S, et al. High expression of complement component 5 (C5) at tumor site associates with superior survival in Ewing’s sarcoma family of tumour patients. ISRN Oncol. 2011;2011:168712. PMID: 22084725; PMCID: PMCPMC3196920. doi:10.5402/2011/168712
15. Skov V, Glintborg D, Knudsen S, et al. Reduced expression of nuclear-encoded genes involved in mitochondrial oxidative metabolism in skeletal muscle of insulin-resistant women with polycystic ovary syndrome. Diabetes. 2007;56(9):2349–2355. PMID: 17563058. doi:10.2337/db07-0275
16. Roth RB, Hevezi P, Lee J, et al. Gene expression analyses reveal molecular relationships among 20 regions of the human CNS. Neurogenetics. 2006;7(2):67–80. PMID: 16572319. doi:10.1007/s10048-006-0032-6
17. Huang DW, Sherman BT, Tan Q, et al. The DAVID gene functional classification tool: a novel biological module-centric algorithm to functionally analyze large gene lists. Genome Biol. 2007;8(9):R183. PMID: 17784955; PMCID: PMCPMC2375021. doi:10.1186/gb-2007-8-9-r183
18. Kanehisa M. The KEGG database. Novartis Found Symp. 2002;247:
19. Ashburner M, Ball CA, Blake JA, et al. Gene ontology: tool for the unification of biology. The gene ontology consortium. Nat Genet. 2000;25(1):25–29. PMID: 10802651; PMCID: PMCPMC3037419. doi:10.1038/75556
20. Franceschini A, Szklarczyk D, Frankild S, et al. STRING v9.1: protein-protein interaction networks, with increased coverage and integration. Nucleic Acids Res. 2013;41:D808–D815. PMID: 23203871; PMCID: PMCPMC3531103. doi:10.1093/nar/gks1094
21. Smoot ME, Ono K, Ruscheinski J, Wang PL, Ideker T. Cytoscape 2.8: new features for data integration and network visualization. Bioinformatics. 2011;27(3):431–432. PMID: 21149340; PMCID: PMCPMC3031041. doi:10.1093/bioinformatics/btq675
22. Bader GD, Hogue CW. An automated method for finding molecular complexes in large protein interaction networks. BMC Bioinform. 2003;4:2. PMID: 12525261; PMCID: PMCPMC149346. doi:10.1186/1471-2105-4-2
23. Chin CH, Chen SH, Wu HH, Ho CW, Ko MT, Lin CY. cytoHubba: identifying hub objects and sub-networks from complex interactome. BMC Syst Biol. 2014;8(Suppl4):S11. PMID: 25521941; PMCID: PMCPMC4290687. doi:10.1186/1752-0509-8-s4-s11
24. Rhodes DR, Yu J, Shanker K, et al. ONCOMINE: a cancer microarray database and integrated data-mining platform. Neoplasia. 2004;6(1):1–6. PMID: 15068665; PMCID: PMCPMC1635162. doi:10.1016/s1476-5586(04)80047-2
25. Maere S, Heymans K, Kuiper M. BiNGO: a Cytoscape plugin to assess overrepresentation of gene ontology categories in biological networks. Bioinformatics. 2005;21(16):3448–3449. PMID: 15972284. doi:10.1093/bioinformatics/bti551
26. Goldman MJ, Craft B, Hastie M, et al. Visualizing and interpreting cancer genomics data via the Xena platform. Nat Biotechnol. 2020;38(6):675–678. PMID: 32444850; PMCID: PMCPMC7386072. doi:10.1038/s41587-020-0546-8
27. Li T, Fu J, Zeng Z, et al. TIMER2.0 for analysis of tumor-infiltrating immune cells. Nucleic Acids Res. 2020;48(W1):W509–w14. PMID: 32442275; PMCID: PMCPMC7319575. doi:10.1093/nar/gkaa407
28. Li T, Fan J, Wang B, et al. TIMER: a web server for comprehensive analysis of tumor-infiltrating immune cells. Cancer Res. 2017;77(21):e108–e10. PMID: 29092952; PMCID: PMCPMC6042652. doi:10.1158/0008-5472.Can-17-0307
29. Li B, Severson E, Pignon JC, et al. Comprehensive analyses of tumor immunity: implications for cancer immunotherapy. Genome Biol. 2016;17(1):174. PMID: 27549193; PMCID: PMCPMC4993001. doi:10.1186/s13059-016-1028-7
30. Anaya J. OncoLnc: linking TCGA survival data to mRNAs, miRNAs, and lncRNAs. PeerJ Comput Sci. 2016;2:e67. doi:10.7717/peerj-cs.67
31. Brohl AS, Solomon DA, Chang W, et al. The genomic landscape of the Ewing sarcoma family of tumors reveals recurrent STAG2 mutation. PLoS Genet. 2014;10(7):e1004475. PMID: 25010205; PMCID: PMCPMC4091782. doi:10.1371/journal.pgen.1004475
32. Crompton BD, Stewart C, Taylor-Weiner A, et al. The genomic landscape of pediatric Ewing sarcoma. Cancer Discov. 2014;4(11):1326–1341. PMID: 25186949. doi:10.1158/2159-8290.Cd-13-1037
33. Tirode F, Surdez D, Ma X, et al. Genomic landscape of Ewing sarcoma defines an aggressive subtype with co-association of STAG2 and TP53 mutations. Cancer Discov. 2014;4(11):1342–1353. PMID: 25223734; PMCID: PMCPMC4264969. doi:10.1158/2159-8290.Cd-14-0622
34. Rizk VT, Walko CM, Brohl AS. Precision medicine approaches for the management of Ewing sarcoma: current perspectives. Pharmgenomics Pers Med. 2019;12:9–14. PMID: 30697061; PMCID: PMCPMC6340366. doi:10.2147/pgpm.S170612
35. Wang Y, Cheng J, Xu C, et al. Quantitative methylation analysis reveals gender and age differences in p16INK4a hypermethylation in hepatitis B virus-related hepatocellular carcinoma. Liver Int. 2012;32(3):420–428. PMID: 22192146. doi:10.1111/j.1478-3231.2011.02696.x
36. Choi YL, Park SH, Jang JJ, Park CK. Expression of the G1-S modulators in hepatitis B virus-related hepatocellular carcinoma and dysplastic nodule: association of cyclin D1 and p53 proteins with the progression of hepatocellular carcinoma. J Korean Med Sci. 2001;16(4):424–432. PMID: 11511787; PMCID: PMCPMC3054763. doi:10.3346/jkms.2001.16.4.424
37. Tripathi V, Shen Z, Chakraborty A, et al. Long noncoding RNA MALAT1 controls cell cycle progression by regulating the expression of oncogenic transcription factor B-MYB. PLoS Genet. 2013;9(3):e1003368. PMID: 23555285; PMCID: PMCPMC3605280. doi:10.1371/journal.pgen.1003368
38. Asl ER, Amini M, Najafi S, et al. Interplay between MAPK/ERK signaling pathway and MicroRNAs: a crucial mechanism regulating cancer cell metabolism and tumor progression. Life Sci. 2021;278:119499. PMID: 33865878. doi:10.1016/j.lfs.2021.119499
39. Singh V, Ram M, Kumar R, Prasad R, Roy BK, Singh KK. Phosphorylation: implications in cancer. Protein J. 2017;36(1):1–6. PMID: 28108801. doi:10.1007/s10930-017-9696-z
40. Hayama S, Daigo Y, Yamabuki T, et al. Phosphorylation and activation of cell division cycle associated 8 by Aurora kinase B plays a significant role in human lung carcinogenesis. Cancer Res. 2007;67(9):4113–4122. PMID: 17483322. doi:10.1158/0008-5472.Can-06-4705
41. Wang Y, Zhao Z, Bao X, et al. Borealin/Dasra B is overexpressed in colorectal cancers and contributes to proliferation of cancer cells. Med Oncol. 2014;31(11):248. PMID: 25260804. doi:10.1007/s12032-014-0248-5
42. Chang JL, Chen TH, Wang CF, et al. Borealin/Dasra B is a cell cycle-regulated chromosomal passenger protein and its nuclear accumulation is linked to poor prognosis for human gastric cancer. Exp Cell Res. 2006;312(7):962–973. PMID: 16427043. doi:10.1016/j.yexcr.2005.12.015
43. Jeon T, Ko MJ, Seo YR, et al. Silencing CDCA8 suppresses hepatocellular carcinoma growth and stemness via restoration of ATF3 tumor suppressor and inactivation of AKT/β-catenin signaling. Cancers. 2021;13(5):1055. PMID: 33801424; PMCID: PMCPMC7958635. doi:10.3390/cancers13051055
44. Li Y, Benezra R. Identification of a human mitotic checkpoint gene: hsMAD2. Science. 1996;274(5285):246–248. PMID: 8824189. doi:10.1126/science.274.5285.246
45. Bidus MA, Risinger JI, Chandramouli GV, et al. Prediction of lymph node metastasis in patients with endometrioid endometrial cancer using expression microarray. Clin Cancer Res. 2006;12(1):83–88. PMID: 16397028. doi:10.1158/1078-0432.Ccr-05-0835
46. Wang Y, Wang F, He J, et al. miR-30a-3p targets MAD2L1 and regulates proliferation of gastric cancer cells. Onco Targets Ther. 2019;12:11313–11324. PMID: 31908496; PMCID: PMCPMC6927793. doi:10.2147/ott.S222854
47. Li Y, Bai W, Zhang J. MiR-200c-5p suppresses proliferation and metastasis of human hepatocellular carcinoma (HCC) via suppressing MAD2L1. Biomed Pharmacother. 2017;92:1038–1044. PMID: 28609841. doi:10.1016/j.biopha.2017.05.092
48. Kitsera N, Dorosh O, Makukh H. Woman with Turner syndrome and her child with acute leukemia (a case report). Exp Oncol. 2020;42(4):333–336. PMID: 33355873. doi:10.32471/exp-oncology.2312-8852.vol-42-no-4.15275
49. Zheng P, Li L. FANCI cooperates with IMPDH2 to promote lung adenocarcinoma tumor growth via a MEK/ERK/MMPs pathway. Onco Targets Ther. 2020;13:451–463. PMID: 32021289; PMCID: PMCPMC6970268. doi:10.2147/ott.S230333
50. Sondalle SB, Longerich S, Ogawa LM, Sung P, Baserga SJ. Fanconi anemia protein FANCI functions in ribosome biogenesis. Proc Natl Acad Sci USA. 2019;116(7):2561–2570.PMID: 30692263; PMCID: PMCPMC6377447. doi:10.1073/pnas.1811557116
51. Chan SH, Lim WK, Ishak NDB, et al. Germline mutations in cancer predisposition genes are frequent in sporadic sarcomas. Sci Rep. 2017;7(1):10660. PMID: 28878254; PMCID: PMCPMC5587568. doi:10.1038/s41598-017-10333-x
52. Joo W, Xu G, Persky NS, et al. Structure of the FANCI-FANCD2 complex: insights into the Fanconi anemia DNA repair pathway. Science. 2011;333(6040):312–316. PMID: 21764741; PMCID: PMCPMC3310437. doi:10.1126/science.1205805
53. Nookala RK, Hussain S, Pellegrini L. Insights into Fanconi Anaemia from the structure of human FANCE. Nucleic Acids Res. 2007;35(5):1638–1648. PMID: 17308347; PMCID: PMCPMC1865054. doi:10.1093/nar/gkm033
54. Wang Z, Katsaros D, Shen Y, et al. Biological and clinical significance of MAD2L1 and BUB1, genes frequently appearing in expression signatures for breast cancer prognosis. PLoS One. 2015;10(8):e0136246. PMID: 26287798; PMCID: PMCPMC4546117. doi:10.1371/journal.pone.0136246
55. Roberto GM, Engel EE, Scrideli CA, Tone LG, Brassesco MS. Downregulation of miR-10B* is correlated with altered expression of mitotic kinases in osteosarcoma. Pathol Res Pract. 2018;214(2):213–216. PMID: 29254787. doi:10.1016/j.prp.2017.11.020
56. Li Z, Yang HY, Dai XY, et al. CircMETTL3, upregulated in a m6A-dependent manner, promotes breast cancer progression. Int J Biol Sci. 2021;17(5):1178–1190. PMID: 33867838; PMCID: PMCPMC8040468. doi:10.7150/ijbs.57783
57. Kazi A, Chen L, Xiang S, et al. Global phosphoproteomics reveal CDK suppression as a vulnerability to KRAS addiction in pancreatic cancer. Clin Cancer Res. 2021;27(14):4012–4024. PMID: 33879459. doi:10.1158/1078-0432.Ccr-20-4781
58. Takashima S, Saito H, Takahashi N, et al. Strong expression of cyclin B2 mRNA correlates with a poor prognosis in patients with non-small cell lung cancer. Tumour Biol. 2014;35(5):4257–4265. PMID: 24375198. doi:10.1007/s13277-013-1556-7
59. Lei CY, Wang W, Zhu YT, Fang WY, Tan WL. The decrease of cyclin B2 expression inhibits invasion and metastasis of bladder cancer. Urol Oncol. 2016;34(5):
60. Oser MG, Fonseca R, Chakraborty AA, et al. Cells lacking the RB1 tumor suppressor gene are hyperdependent on Aurora B kinase for survival. Cancer Discov. 2019;9(2):230–247. PMID: 30373918; PMCID: PMCPMC6368871. doi:10.1158/2159-8290.Cd-18-0389
61. Zhang X, Wei C, Liang H, Han L. Polo-like kinase 4ʹs critical role in cancer development and strategies for Plk4-targeted therapy. Front Oncol. 2021;11:587554. PMID: 33777739; PMCID: PMCPMC7994899. doi:10.3389/fonc.2021.587554
62. Dai Y, Liu L, Zeng T, et al. Characterization of the oncogenic function of centromere protein F in hepatocellular carcinoma. Biochem Biophys Res Commun. 2013;436(4):711–718. PMID: 23791740. doi:10.1016/j.bbrc.2013.06.021
63. Yang X, Miao BS, Wei CY, et al. Lymphoid-specific helicase promotes the growth and invasion of hepatocellular carcinoma by transcriptional regulation of centromere protein F expression. Cancer Sci. 2019;110(7):2133–2144. PMID: 31066149; PMCID: PMCPMC6609811. doi:10.1111/cas.14037
64. Sun J, Huang J, Lan J, et al. Overexpression of CENPF correlates with poor prognosis and tumor bone metastasis in breast cancer. Cancer Cell Int. 2019;19:264. PMID: 31632198; PMCID: PMCPMC6788011. doi:10.1186/s12935-019-0986-8
65. Varis A, Salmela AL, Kallio MJ. Cenp-F (mitosin) is more than a mitotic marker. Chromosoma. 2006;115(4):288–295. PMID: 16565862. doi:10.1007/s00412-005-0046-0
66. Xiao B, Verma SC, Cai Q, et al. Bub1 and CENP-F can contribute to Kaposi’s sarcoma-associated herpesvirus genome persistence by targeting LANA to kinetochores. J Virol. 2010;84(19):9718–9732. PMID: 20660191; PMCID: PMCPMC2937805. doi:10.1128/jvi.00713-10
67. Lu H, Shi C, Wang S, et al. Identification of NCAPH as a biomarker for prognosis of breast cancer. Mol Biol Rep. 2020;47(10):7831–7842. PMID: 33009967. doi:10.1007/s11033-020-05859-9
68. Xiong Q, Fan S, Duan L, et al. NCAPH is negatively associated with Mcl‑1 in non‑small cell lung cancer. Mol Med Rep. 2020;22(4):2916–2924. PMID: 32945371; PMCID: PMCPMC7453632. doi:10.3892/mmr.2020.11359
69. Yin L, Jiang LP, Shen QS, et al. NCAPH plays important roles in human colon cancer. Cell Death Dis. 2017;8(3):e2680. PMID: 28300828; PMCID: PMCPMC5386579. doi:10.1038/cddis.2017.88
 © 2022 The Author(s). This work is published and licensed by Dove Medical Press Limited. The full terms of this license are available at https://www.dovepress.com/terms.php and incorporate the Creative Commons Attribution - Non Commercial (unported, v3.0) License.
By accessing the work you hereby accept the Terms. Non-commercial uses of the work are permitted without any further permission from Dove Medical Press Limited, provided the work is properly attributed. For permission for commercial use of this work, please see paragraphs 4.2 and 5 of our Terms.
© 2022 The Author(s). This work is published and licensed by Dove Medical Press Limited. The full terms of this license are available at https://www.dovepress.com/terms.php and incorporate the Creative Commons Attribution - Non Commercial (unported, v3.0) License.
By accessing the work you hereby accept the Terms. Non-commercial uses of the work are permitted without any further permission from Dove Medical Press Limited, provided the work is properly attributed. For permission for commercial use of this work, please see paragraphs 4.2 and 5 of our Terms.