")
Back to Journals » OncoTargets and Therapy » Volume 8
Screening of feature genes in distinguishing different types of breast cancer using support vector machine
Received 23 March 2015
Accepted for publication 20 July 2015
Published 27 August 2015 Volume 2015:8 Pages 2311—2317
DOI https://doi.org/10.2147/OTT.S85271
Checked for plagiarism Yes
Review by Single anonymous peer review
Peer reviewer comments 3
Editor who approved publication: Professor Daniele Santini
Qi Wang, Xudong Liu
Department of Emergency Surgery, Affiliated Hospital of Inner Mongolia Medical University, Hohhot, People’s Republic of China
Objective: To screen the feature genes in estrogen receptor-positive (ER+) breast cancer in comparison with estrogen receptor-negative (ER-) breast cancer.
Methods: Nine microarray data of ER+ and ER- breast cancer samples were collected from Gene Expression Omnibus database. After preprocessing, data in five training sets were analyzed using significance analysis of microarrays to screen the differentially expressed genes (DEGs). The DEGs were further analyzed via support vector machine (SVM) function in e1071 package of R to construct a SVM classifier, the efficacy of which was verified by four testing sets and its combination with training sets using a leave-one-out cross-validation. Feature genes obtained by SVM classifier were subjected to function- and pathway-enrichment via the Database for Annotation, Visualization and Integrated Discovery and KEGG Orthology Based Annotation System, respectively.
Results: A total of 526 DEGs were screened between ER+ and ER- breast cancer. The SVM classifier demonstrated that these genes could distinguish different subtype samples with high accuracy of larger than 90%, and also showed good sensitivity, specificity, positive/negative predictive value, and area under receiver operating characteristic curve. The inflammatory and hormone biological processes were the common enriched results for two different function analyses, indicating that the inflammatory (ie, IL8) and hormone regulation (ie, CGA) genes may be the involved feature genes to distinguish ER+ and ER- types of breast cancer.
Conclusion: The gene-expression profile data can provide feature genes to distinguish ER+ and ER- samples, and the identified genes can be used for biomarkers for ER+ samples.
Keywords: classification, differentially expressed genes, biomarker
Introduction
Breast cancer is the most common invasive cancer in females worldwide, with an estimated 232,670 newly diagnosed cases and approximately 40,000 deaths in 2014 in the USA.1 Breast cancer is a hormone-dependent malignancy. At their primary diagnosis, approximately 75%–80% of breast cancer patients present as estrogen receptor-positive (ER+), while 20%–30% are estrogen-negative (ER−).2 It is reported that ER− breast cancer is related with poor prognosis, whereas breast cancer patients who are ER+ have a favorable outcome.3 This indicates the importance to distinguish between these two different subtypes of breast cancer, with the aim to provide prognosis and guide targeted treatment.
Traditional classification based on the histochemical analysis of ER expression is often limited, and does not have the ability to discern subtle differences in different subtypes of breast cancer.4 Thus, molecular identification is advocated. For example, Lim et al demonstrated that the lysine-specific demethylase 1 is highly expressed in ER− breast cancer,5 while Mehta et al showed that the forkhead box protein A1 is an independent prognostic marker for ER+ breast cancer.6 However, the research on the genes that could distinguish the different subtypes of breast cancer is so limited and needs further study.
Recent studies have shown that gene-expression profile generated by high-throughput platforms may provide comprehensive molecular characteristics of the tumors and may be informative for tumor classifications.4,7 For example, Parker et al have identified a 50-gene transcriptional signature and demonstrated that they have a good prognosis performance for “intrinsic” subtypes of breast cancer (luminal A, luminal B, HER2−enriched, and basal-like).8 Haibe-Kains et al reported a three-gene-expression model to classify tumors into four molecular entities (ER+/HER2−/low proliferative, ER+/HER2−/high proliferative, HER2+, and ER−/HER2−),9 which displays relatively less prognosis ability compared to the 50-gene transcriptional signature.10 However, a gene model to specifically distinguish ER+ and ER− breast cancer remains poorly investigated.
Several data-mining technologies have recently been developed to accomplish feature gene extraction and selection, among which the support vector machine (SVM) algorithm performs at a higher power in two categories of classification.11–10 In the present study, we used the SVM to analyze the biomarkers for two subtypes of breast cancer: ER− and ER+ utilizing gene-expression profiling data.
Materials and methods
Microarray data and data preprocessing
Gene-expression data of breast cancer were downloaded from Gene Expression Omnibus (http://www.ncbi.nlm.nih.gov/geo).14 The following criteria were used to screen out the appropriate gene-expression data: 1) samples were not treated by any medicines; 2) all samples were breast cancer samples; and 3) samples were classified by ER status. Nine datasets were finally included, consisting of 1,289 samples, in which five expression profiles (626 samples, 425 ER+ and 201 ER−) were randomly assigned to training sets and the other four expression profiles (663 samples, 492 ER+ and 171 ER−) were used for testing sets (Table 1). The raw downloaded data first underwent background correction,15 log2 transformation, and then quantiles normalization16 using Affy package in R.
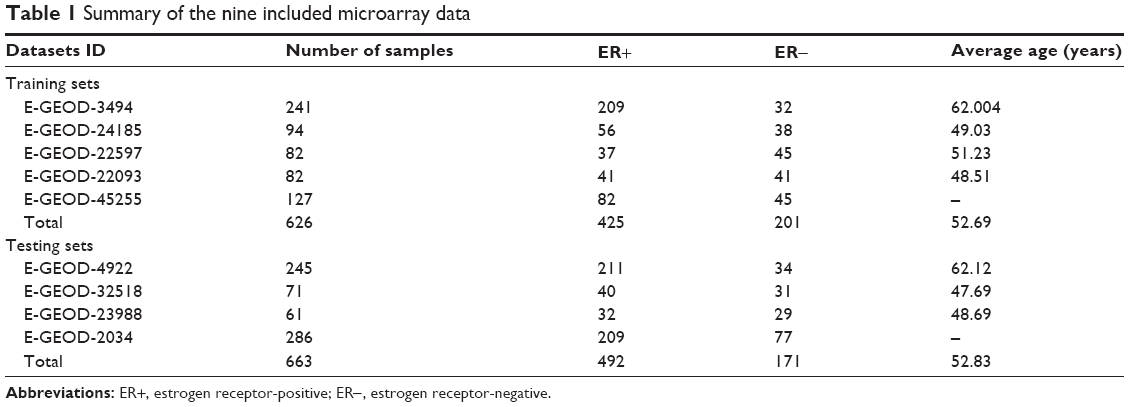 | Table 1 Summary of the nine included microarray data |
Screening of differentially expressed genes
To select the differentially expressed genes (DEGs) in ER+ samples compared with ER− samples after data preprocessing, significance analysis of microarrays package in R (www.r-project.org) was utilized.17 Genes with false discovery rates (FDRs) estimated by permutation method18 to be less than 0.05 and log2 fold change (FC) >1 were considered as DEGs.
Sample classification using SVM classifier
It was not certain whether the selected DEGs could distinguish the two types of breast cancers well; thus, SVM was used for this determination to build models based on “training” data and search for similar patterns in “testing” data. Based on the normalized expression values of 526 DEGs identified using training data, a SVM classifier was constructed via SVM function in e1071 package of R (www.r-project.org) with the nonlinear radial basis function as the kernel and penalty functions set at 1,000. The predicative results of the SVM model for the training set itself were evaluated by a leave-one-out cross-validation method,19 where one sample in n samples was randomly selected as the testing set, and the other n−1 samples were regarded as the training set. The error rate (1− accuracy), when every single sample in the training sets has been used in the testing set, is the accuracy reference of the SVM classifier. The lower the error rate is, the more accurate the classifier is. Besides accuracy, another five indices were also utilized: sensitivity (Se), specificity (Sp), positive predictive value, negative predictive value, and area under receiver operating characteristic curve. For Se and Sp, P=0.5 was the cutoff criteria; while area under the curve was a comprehensive assessment criteria. Subsequently, the accuracy of the SVM classifier was further verified using testing sets and the combined datasets according to the leave-one-out cross-validation method. If all of the earlier mentioned results suggest that the construed SVM classifier exhibits high reliability, DEGs collected from the training sets will be regarded as the feature genes to distinguish the two subtypes of breast cancer.
Function- and pathway-enrichment of feature genes
The feature genes were subjected to enrichment analysis to identify their roles in breast cancer. The Database for Annotation, Visualization and Integrated Discovery was used for function enrichment,20 while KEGG Orthology Based Annotation System was applied for pathway-enrichment using hypergeometric distribution algorithm.21 P<0.05 was the threshold for the enriched terms.
Results
Screening for DEGs
A total of 526 DEGs, consisting of 239 upregulated ones and 287 downregulated ones, were identified in ER+ samples, comparing with ER− samples in the five training datasets.
Sample classification using SVM classifier
Using the normalized expression values of DEGs, a SVM classifier was constructed (Figure 1). After that, the accuracy of this classifier was detected. For training, testing, and the combined datasets, two (one ER− and one ER+), 29 (16 ER− and 13 ER+), and 22 (seven ER− and 15 ER+) samples were wrongly classified by the SVM classifier, respectively. However, the accuracies were all larger than 90% (99.7% [99.5% for ER− and 99.8% for ER+], 95.6% [90.6% for ER− and 97.3% for ER+], and 98.2% [98.1% for ER− and 98.4% for ER+], respectively), indicating the reliability of the classifier. Moreover, the results of Se, Sp, positive predictive value, negative predictive value, and area under receiver operating characteristic curve of the SVM classifier showed that it could not only distinguish training datasets, but also testing datasets well (Table 2; Figure 2).
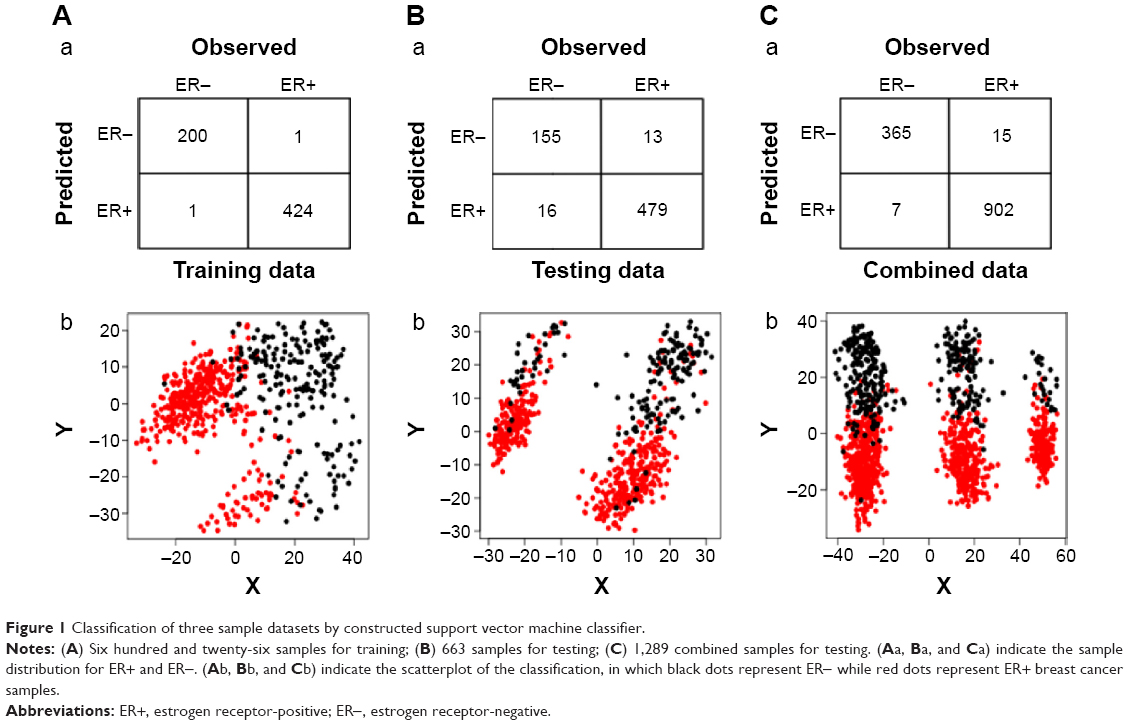 | Figure 1 Classification of three sample datasets by constructed support vector machine classifier. |
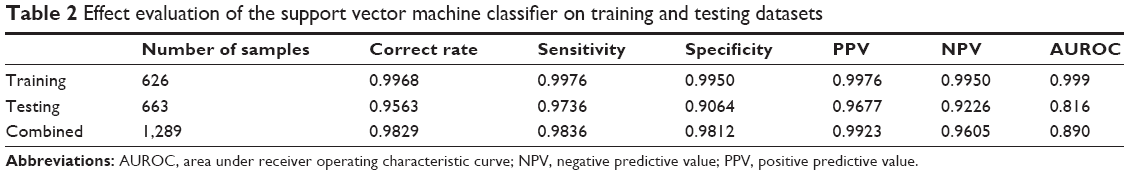 | Table 2 Effect evaluation of the support vector machine classifier on training and testing datasets |
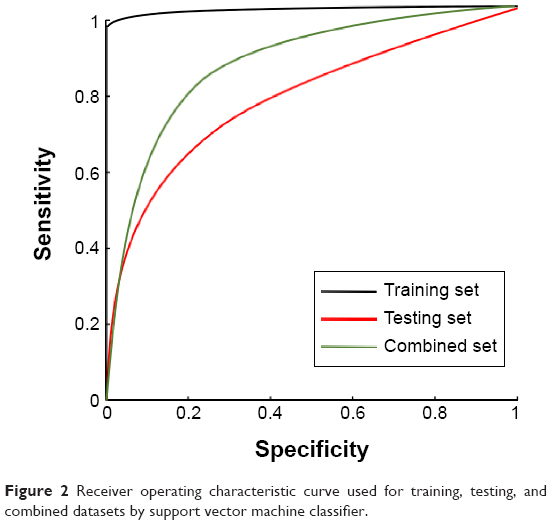 | Figure 2 Receiver operating characteristic curve used for training, testing, and combined datasets by support vector machine classifier. |
Significantly related functions of feature genes
A total of eight biological functions were enriched by the feature genes (Table 3), among which the response to inorganic substance was the most significant. Furthermore, the majority of features genes were collected in several biological functions, including response to organic substance, cell–cell signaling, response to wounding, behavior, and inflammatory response, each of which accounting for larger than 10%.
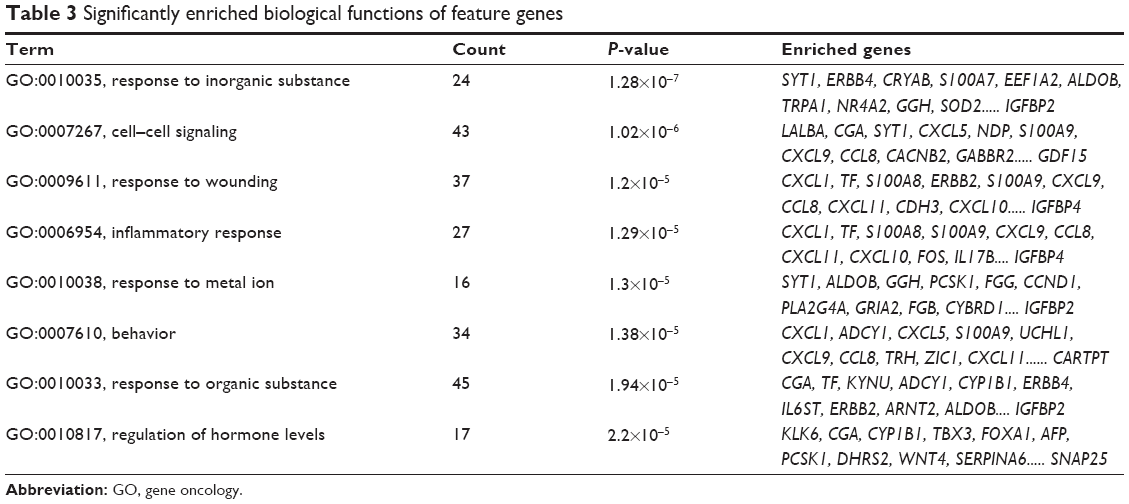 | Table 3 Significantly enriched biological functions of feature genes |
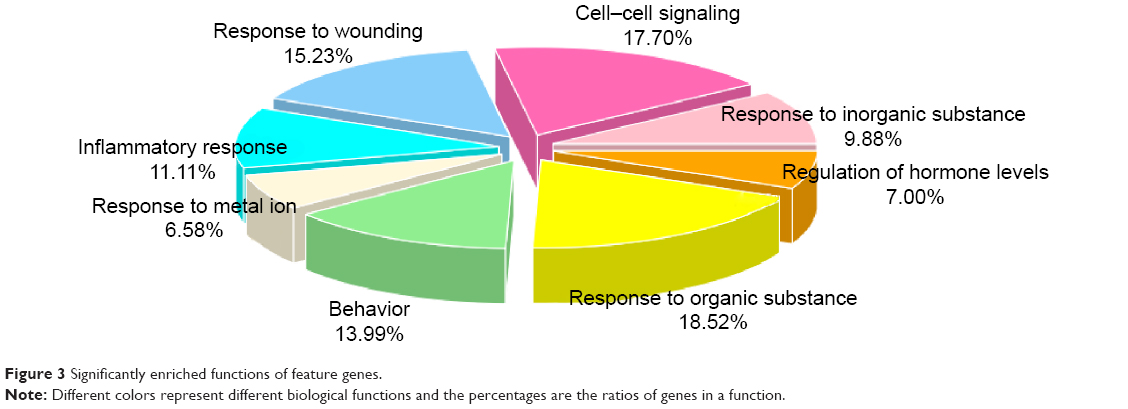 | Figure 3 Significantly enriched functions of feature genes. |
Significantly related pathways of feature genes
Eight pathways of the feature genes were enriched, of which, cytokine–cytokine receptor interaction was the most significant one, involving 17 genes. The other pathways included drug metabolism, GnRH signaling pathway, etc (Table 4).
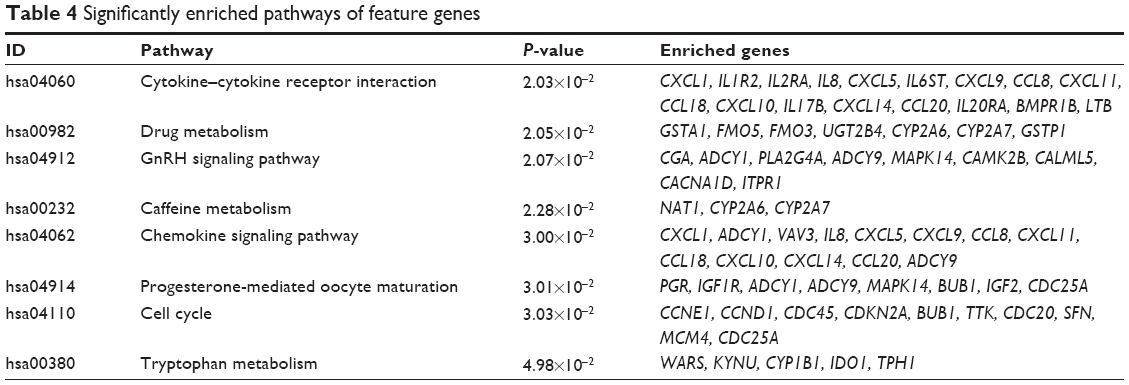 | Table 4 Significantly enriched pathways of feature genes |
Discussion
In present study, ER+ and ER− types of breast cancer samples were investigated to screen the DEGs, which were further used for SVM classifier training. The SVM classifier could not only distinguish the training dataset, but could also distinguish the testing and combined datasets well, with accuracy higher than 90%. Thus, the DEGs could be considered as feature genes for ER+ and ER− types of breast cancer. Subsequently, function- and pathway-enrichment analyses were conducted, in which the inflammatory- and hormone-related biological process were the common results for these two different analyses, indicating these inflammatory (ie, interleukin-8 [IL8]) and hormone regulation (ie, glycoprotein hormones, alpha polypeptide, CGA) genes may be important for distinguishing ER+ and ER− types of breast cancer.
It is well reported that cytokine IL8 plays an important role in malignant tumor progression. IL8 is highly expressed in breast cancer and is associated with an accelerated clinical course, a higher tumor load, and the presence of distant metastasis, ultimately leading to poor survival.22,23 The depletion of IL8 expression may promote the cell cycle arrest and inhibit migration and invasion in breast cancer cells, causing high response to chemotherapy.24,25 Thus, IL8 may be a biomarker for distinguishing subtypes of breast cancer because of the lower survival in ER− type of breast cancer. This hypothesis has been demonstrated by several studies.26,27 For example, Lin et al showed that IL8 is lowly expressed in ER+ whereas highly expressed in ER− cells.28 Specifically, knockdown of IL8 significantly reduces the cell invasion by suppressing the PI3K/Akt/NF-κB/integrin β3 pathway in ER− breast cancer cell lines,29,30 and the microvessel density and neutrophil infiltration into the tumors in vivo.29 Furthermore, exogenous addition of ERα in ER− cells may also achieve the goal of downregulating IL8 expression.31 These findings all suggest the negative relationship between IL8 and ER status, which was also proved in our study (IL8 was downregulated in ER+ samples, log2 FC =−2.25, FDR =1.04×10−70).
CGA codes for the common alpha subunit of four glycoprotein hormones (chorionic gonadotropin, luteinizing hormone, follicle stimulating hormone, and thyroid stimulating hormone) that have a cystine knot motif formed by three of the five disulfide bonds.32,33 This cystine knot motif is known to be a characteristic feature of growth factor and, thus, the expression of CGA may be related with the development of cancer, which was also demonstrated in previous studies.34,35 However, compared with the beta subunit of glycoprotein hormones,36 the alpha subunit may be a marker of tumors with low aggressiveness, eg, ER+ but not ER− cancer cells.37,38 In this study, we also found the upregulated expression of CGA in ER+ breast cancer patients (log2 FC =2.63, FDR =2.82×10⁻³⁴).
Despite the ideal classification of different types of breast cancer samples and satisfactory accuracy, the SVM classifier showed decreased recognizing ability. The potential reasons for this are: 1) breast cancer is one of the tumors which vary between individuals, and this variation among samples will affect gene expressions; and 2) samples used for training and testing were obtained from different experiments, which allows for some personal error. This kind of error can hardly be eliminated by normalization of the data. However, all the other indices showed reliability of our classifier by SVM method.
Conclusion
Based on a set of gene-expression profiles, 526 DEGs were identified in ER+ samples in comparison with ER− samples, which were further used for SVM classifier construction. After being tested using the other microarray data, the SVM classifier showed satisfactory efficacy. The selected feature genes (such as IL8 and CGA) could well distinguish those two subtypes of breast cancer. However, further experimental studies are needed to confirm the values of other involved genes.
Disclosure
The authors report no conflicts of interest in this work.
References
Siegel R, Ma J, Zou Z, Jemal A. Cancer statistics, 2014. CA Cancer J Clin. 2014;64(1):9–29. | ||
Suzuki R, Orsini N, Saji S, Key TJ, Wolk A. Body weight and incidence of breast cancer defined by estrogen and progesterone receptor status – a metaanalysis. Int J Cancer. 2009;124(3):698–712. | ||
Yamashita H, Iwase H, Toyama T, et al. Estrogen receptor-positive breast cancer in Japanese women: trends in incidence, characteristics, and prognosis. Ann Oncol. 2011;22(6):1318–1325. | ||
West M, Blanchette C, Dressman H, et al. Predicting the clinical status of human breast cancer by using gene expression profiles. Proc Natl Acad Sci U S A. 2001;98(20):11462–11467. | ||
Lim S, Janzer A, Becker A, et al. Lysine-specific demethylase 1 (LSD1) is highly expressed in ER−negative breast cancers and a biomarker predicting aggressive biology. Carcinogenesis. 2010;31(3):512–520. | ||
Mehta RJ, Jain RK, Leung S, et al. FOXA1 is an independent prognostic marker for ER−positive breast cancer. Breast Cancer Res Treat. 2012;131(3):881–890. | ||
Reis-Filho JS, Pusztai L. Gene expression profiling in breast cancer: classification, prognostication, and prediction. Lancet. 2011;378(9805):1812–1823. | ||
Parker JS, Mullins M, Cheang MC, et al. Supervised risk predictor of breast cancer based on intrinsic subtypes. J Clin Oncol. 2009;27(8):1160–1167. | ||
Haibe-Kains B, Desmedt C, Loi S, et al. A three-gene model to robustly identify breast cancer molecular subtypes. J Natl Cancer Inst. 2012;104(4):311–325. | ||
Prat A, Parker JS, Fan C, Perou CM. PAM50 assay and the three-gene model for identifying the major and clinically relevant molecular subtypes of breast cancer. Breast Cancer Res Treat. 2012;135(1):301–306. | ||
Li T, Zhang C, Ogihara M. A comparative study of feature selection and multiclass classification methods for tissue classification based on gene expression. Bioinformatics. 2004;20(15):2429–2437. | ||
Fan XJ, Wan XB, Huang Y, et al. Epithelial–mesenchymal transition biomarkers and support vector machine guided model in preoperatively predicting regional lymph node metastasis for rectal cancer. Br J Cancer. 2012;106(11):1735–1741. | ||
Upstill-Goddard R, Eccles D, Ennis S, et al. Support Vector Machine classifier for estrogen receptor positive and negative early-onset breast cancer. PLoS One. 2013;8(7):e68606. | ||
Barrett T, Suzek TO, Troup DB, et al. NCBI GEO: mining millions of expression profiles – database and tools. Nucleic Acids Res. 2005;33(Database issue):D562–D566. | ||
Liu WM, Mei R, Di X, et al. Analysis of high density expression microarrays with signed–rank call algorithms. Bioinformatics. 2002;18(12):1593–1599. | ||
Smyth GK, Speed T. Normalization of cDNA microarray data. Methods. 2003;31(4):265–273. | ||
Zhang S. A comprehensive evaluation of SAM, the SAM R–package and a simple modification to improve its performance. BMC Bioinformatics. 2007;8:230. | ||
Xie Y, Pan W, Khodursky AB. A note on using permutation–based false discovery rate estimates to compare different analysis methods for microarray data. Bioinformatics. 2005;21(23):4280–4288. | ||
Cawley GC, Talbot NLC. Efficient leave-one-out cross-validation of kernel fisher discriminant classifiers. Pattern Recognit. 2003;36(11):2585–2592. | ||
Huang da W, Sherman BT, Lempicki RA. Bioinformatics enrichment tools: Paths toward the comprehensive functional analysis of large gene lists. Nucleic Acids Res. 2009;37(1):1–13. | ||
Wu J, Mao X, Cai T, Luo J, Wei L. KOBAS server: a web-based platform for automated annotation and pathway identification. Nucleic Acids Res. 2006;34(Web Server issue):W720–W724. | ||
Benoy IH, Salgado R, Van Dam P, et al. Increased serum interleukin-8 in patients with early and metastatic breast cancer correlates with early dissemination and survival. Clin Cancer Res. 2004;10(21):7157–7162. | ||
Zuccari DA, Leonel C, Castro R, et al. An immunohistochemical study of interleukin-8 (IL-8) in breast cancer. Acta Histochemica. 2012;114(6):571–576. | ||
Shao N, Chen LH, Ye RY, Lin Y, Wang SM. The depletion of interleukin-8 causes cell cycle arrest and increases the efficacy of docetaxel in breast cancer cells. Biochem Biophys Res Commun. 2013;431(3):535–541. | ||
Wu K, Katiyar S, Li A, et al. Dachshund inhibits oncogene-induced breast cancer cellular migration and invasion through suppression of interleukin-8. Proc Natl Acad Sci U S A. 2008;105(19):6924–6929. | ||
Ghoneim HM, Maher S, Abdel-Aty A, Saad A, Kazem A, Demian SR. Tumor-derived CCL-2 and CXCL-8 as possible prognostic markers of breast cancer: CORRELATION with estrogen and progestrone receptor phenotyping. Egypt J Immunol. 2009;16(2):37–48. | ||
Todorovic-Rakovic N, Milovanovic J. Interleukin-8 in breast cancer progression. J Interferon Cytokine Res. 2013;33(10):563–570. | ||
Lin Y, Huang R, Chen L, et al. Identification of interleukin-8 as estrogen receptor-regulated factor involved in breast cancer invasion and angiogenesis by protein arrays. Int J Cancer. 2004;109(4):507–515. | ||
Yao C, Lin Y, Chua MS, et al. Interleukin-8 modulates growth and invasiveness of estrogen receptor-negative breast cancer cells. Int J Cancer. 2007;121(9):1949–1957. | ||
Shao N, Lu Z, Zhang Y, et al. Interleukin-8 upregulates integrin β3 expression and promotes estrogen receptor-negative breast cancer cell invasion by activating the PI3K/Akt/NF-κB pathway. Cancer Lett. 2015;364(2):165–172. | ||
Freund A, Chauveau C, Brouillet J-P, et al. IL-8 expression and its possible relationship with estrogen-receptor-negative status of breast cancer cells. Oncogene. 2003;22(2):256–265. | ||
Darling RJ, Wilken JA, Ruddon RW, Bedows E. Intracellular folding pathway of the cystine knot-containing glycoprotein hormone alpha-subunit. Biochemistry. 2001;40(2):577–585. | ||
Alvarez E, Cahoreau C, Combarnous Y. Comparative structure analyses of cystine knot-containing molecules with eight aminoacyl ring including glycoprotein hormones (GPH) alpha and beta subunits and GPH-related A2 (GPA2) and B5 (GPB5) molecules. Reprod Biol Endocrinol. 2009;7:90. | ||
Abbud RA, Takumi I, Barker EM, et al. Early multipotential pituitary focal hyperplasia in the alpha-subunit of glycoprotein hormone-driven pituitary tumor-transforming gene transgenic mice. Mol Endocrinol. 2005;19(5):1383–1391. | ||
Beck-Peccoz P, Persani L, Faglia G. Glycoprotein hormone alpha-subunit in pituitary adenomas. Trends Endocrinol Metab. 1992;3(2):41–45. | ||
Iles RK. Ectopic hCGbeta expression by epithelial cancer: Malignant behaviour, metastasis and inhibition of tumor cell apoptosis. Mol Cell Endocrinol. 2007;260–262:264–270. | ||
Bieche I, Parfait B, Le Doussal V, et al. Identification of CGA as a novel estrogen receptor-responsive gene in breast cancer: an outstanding candidate marker to predict the response to endocrine therapy. Cancer Res. 2001;61(4):1652–1658. | ||
Bièche I, Latil A, Parfait B, et al. CGA gene (coding for the alpha subunit of glycoprotein hormones) overexpression in ER alpha-positive prostate tumors. Eur Urol. 2002;41(3):335–341. |
 © 2015 The Author(s). This work is published and licensed by Dove Medical Press Limited. The full terms of this license are available at https://www.dovepress.com/terms.php and incorporate the Creative Commons Attribution - Non Commercial (unported, v3.0) License.
By accessing the work you hereby accept the Terms. Non-commercial uses of the work are permitted without any further permission from Dove Medical Press Limited, provided the work is properly attributed. For permission for commercial use of this work, please see paragraphs 4.2 and 5 of our Terms.
© 2015 The Author(s). This work is published and licensed by Dove Medical Press Limited. The full terms of this license are available at https://www.dovepress.com/terms.php and incorporate the Creative Commons Attribution - Non Commercial (unported, v3.0) License.
By accessing the work you hereby accept the Terms. Non-commercial uses of the work are permitted without any further permission from Dove Medical Press Limited, provided the work is properly attributed. For permission for commercial use of this work, please see paragraphs 4.2 and 5 of our Terms.