")
Back to Journals » OncoTargets and Therapy » Volume 9
Screening of biomarkers for prediction of response to and prognosis after chemotherapy for breast cancers
Received 14 July 2015
Accepted for publication 12 February 2016
Published 2 May 2016 Volume 2016:9 Pages 2593—2600
DOI https://doi.org/10.2147/OTT.S92350
Checked for plagiarism Yes
Review by Single anonymous peer review
Peer reviewer comments 3
Editor who approved publication: Dr Faris Farassati
Feng Bing, Yu Zhao
Department of Vascular Surgery, The First Affiliated Hospital of Chongqing Medical University, Chongqing, People’s Republic of China
Objective: To screen the biomarkers having the ability to predict prognosis after chemotherapy for breast cancers.
Methods: Three microarray data of breast cancer patients undergoing chemotherapy were collected from Gene Expression Omnibus database. After preprocessing, data in GSE41112 were analyzed using significance analysis of microarrays to screen the differentially expressed genes (DEGs). The DEGs were further analyzed by Differentially Coexpressed Genes and Links to construct a function module, the prognosis efficacy of which was verified by the other two datasets (GSE22226 and GSE58644) using Kaplan–Meier plots. The involved genes in function module were subjected to a univariate Cox regression analysis to confirm whether the expression of each prognostic gene was associated with survival.
Results: A total of 511 DEGs between breast cancer patients who received chemotherapy or not were obtained, consisting of 421 upregulated and 90 downregulated genes. Using the Differentially Coexpressed Genes and Links package, 1,244 differentially coexpressed genes (DCGs) were identified, among which 36 DCGs were regulated by the transcription factor complex NFY (NFYA, NFYB, NFYC). These 39 genes constructed a gene module to classify the samples in GSE22226 and GSE58644 into three subtypes and these subtypes exhibited significantly different survival rates. Furthermore, several genes of the 39 DCGs were shown to be significantly associated with good (such as CDC20) and poor (such as ARID4A) prognoses following chemotherapy.
Conclusion: Our present study provided a serial of biomarkers for predicting the prognosis of chemotherapy or targets for development of alternative treatment (ie, CDC20 and ARID4A) in breast cancer patients.
Keywords: breast cancer, differentially coexpressed expressed genes, prognosis, chemotherapy
Introduction
Breast cancer is the most frequently diagnosed cancer and the leading cause of cancer death among females, with an estimated 232,670 newly diagnosed cases and approximately 40,000 deaths in the US in 2014.1 Chemotherapy regimens are commonly used in the management of breast cancer patients to reduce the risk of recurrence and mortality. However, it is reported that approximately 50% of patients do not show a clinical response and, thus, may not benefit from the chemotherapy regimens, presenting poor prognosis.2–4 Thus, it is essential to identify biomarkers that can aid in differentiating the patients with different responses and prognoses after chemotherapy for the purpose of treatment selection.
Several studies have demonstrated a series of biomarkers associated with chemotherapy response. For example, Sun et al5 reported that phosphoglycerate kinase-1 (PGK1) is significantly upregulated in breast cancer tissues at both mRNA and protein levels, compared with that in normal breast tissues. Also, patients with high levels of PGK1 expression exhibit shorter overall survival even if the paclitaxel chemotherapy regimen is scheduled, indicating PGK1 may be an independent prognostic biomarker for chemoresistance to paclitaxel.5 Ataseven et al reported that patients with high expression of protein tyrosine kinase 7 exhibited a significantly poorer 3-year disease-free survival increase. However, when receiving taxane-based chemotherapy, they showed significantly better disease-free survival than those receiving no chemotherapy, suggesting protein tyrosine kinase 7 may be a prognostic marker associated with the sensitivity to taxane.6
Furthermore, recent studies have also used the gene expression profile generated by high-throughput platforms to subclassify the patients with different responses to chemotherapy. For instance, Parker et al7 have identified a 50-gene transcriptional signature (PAM50) and demonstrated they have a 94% sensitivity to predict the response to neoadjuvant chemotherapy. Tsunashima et al8 screened 155 probes to distinguish low and high chemosensitive patients, with a diagnostic sensitivity of 88.0%. However, the molecular signatures that have the ability to classify the patients with different prognoses after chemotherapy remain limited and need further study. The purpose of this study is to further identify molecular biomarkers for assessing chemotherapy effectiveness via computational bioinformatics analysis of three gene expression profile data.
Materials and methods
Gene expression data
Gene expression datasets of breast cancer, with the accession number of GSE41112, GSE2222, and GSE58644, were downloaded from Gene Expression Omnibus (http://www.ncbi.nlm.nih.gov/geo). Illumina HumanHT-12 V4.0 array (Illumina Inc., San Diego, CA, USA) was the platform used for analysis of the dataset of GSE41112, which contained the gene expression profile in peripheral blood mononuclear cells of clinically confirmed stage 0–III cases of breast cancer that were treated with (n=24) or without chemotherapy (n=37).
Dataset GSE222269 was used to measure the whole genome changes in 130 breast cancer samples undergoing chemotherapy, including an initial anthracycline-based regimen. Then patients would undergo surgery or receive a taxane-based regimen prior to surgery. Total RNA of the sample tissues was hybridized to Agilent-012391 Oligo Microarray G4112A (Agilent Technologies, Santa Clara, CA, USA). All patients had histologically confirmed invasive breast cancer by clinical examination or imaging, and without distant metastatic disease. The clinical stage I was determined as tumor size >3 cm.
To detect different prognoses at a molecular level, GSE58644 expression profile analysis10 was performed for tissue samples of 123 invasive breast cancer patients who received chemotherapy using the Affymetrix Human Gene 1.0 ST Array (Affymetrix, Santa Clara, CA, USA) platform. The subtypes of the breast cancer were classified based on the output from naive Bayes’ classifier.
Data preprocessing and differential analysis of GSE41112
According to the annotation files available from Gene Expression Omnibus, probe IDs were mapped to gene symbols. The intensities of multiple probes mapping to the same gene were averaged as the final expression value of the gene.11 After quantile normalization and log2 transformation,12 differential analysis of GSE41112 dataset was performed with significance analysis of microarray method based on t-test and analysis of variance.13 To reduce the false positives caused by the large gene number, the P-value was adjusted to false discovery rate (FDR) via multiple testing. Fold-change >1.5 and FDR <0.05 were set as the cut-off points to screen the differentially expressed genes (DEGs) between breast cancer samples with and without chemotherapy. Principal component analysis was performed to confirm the differential functions of DEGs.
Functional enrichment analysis
To further investigate the function of the DEGs, the uploaded expression data were mapped onto three selected reference databases of cellular pathways, including the Kyoto Encyclopedia of Genes and Genomes (http://www.genome.jp/kegg), BioCarta (http://www.biocarta.com), and Reactome (http://www.reactome.org), using online tools from the Database for Annotation, Visualization, and Integrated Discovery (http://david.abcc.ncifcrf.gov).14 P-values were calculated using the hypergeometric distribution and P<0.05 was set as the cut-off criterion.
Differential coexpression and regulatory relationships analysis
From the perspective of systems biology, functionally related genes are frequently coexpressed, and thus, the identification of differentially coexpressed genes (DCGs) from gene expression microarray data is essential. The Differentially Coexpressed Genes and Links (DCGL) in R package (v2.0)15 was used to screen DCGs and links between breast cancer patients with and without chemotherapy, based on differential coexpression profile and differential coexpression enrichment methods, followed by DCsum function to summarize the final set of DCGs and links. In addition, DRrank function in DCGL package, a novel module in DCGL v2.0, was also utilized to identify the transcription factors that significantly regulate the DCGs according to the Targets Enrichment Density (TED) and Targets DCL Density (TDD) scores.15 The human gene regulatory relationships were collected from the cGRNB (combinatorial Gene Regulatory Networks Builder; http://www.scbit.org/cgrnb/) database, which contains 214 transcription factors and 16,831 target genes to form 210,637 pairs of regulatory relationships. To evaluate the statistical significance of TED and TDD scores, a permutation test with 100 permutations was implemented to provide P-values as well as FDR. The FDR <0.05 was set as the threshold value.
Survival curves analysis
Based on the significant transcription factors and their regulatory DCGs, the breast cancer samples with chemotherapy were further subtyped using the GSE22226 and GSE58644 datasets. The patient prognoses with different subtypes were estimated using Kaplan–Meier plots. To further test whether the expression of each prognostic gene was associated with survival, a univariate Cox regression analysis was performed, by which the regression coefficient was estimated. A regression coefficient >0 indicates poor prognosis, but <0 suggests good prognosis.
Results
DEGs screening and function enrichment analysis
After preprocessing, a total of 31,317, 18,831, and 20,200 genes were included in GSE41112 (Figure 1A), GSE22226 (Figure 1B), and GSE58644 (Figure 1C) datasets, respectively. The box plots revealed the homogeneous distribution of the genes across samples.
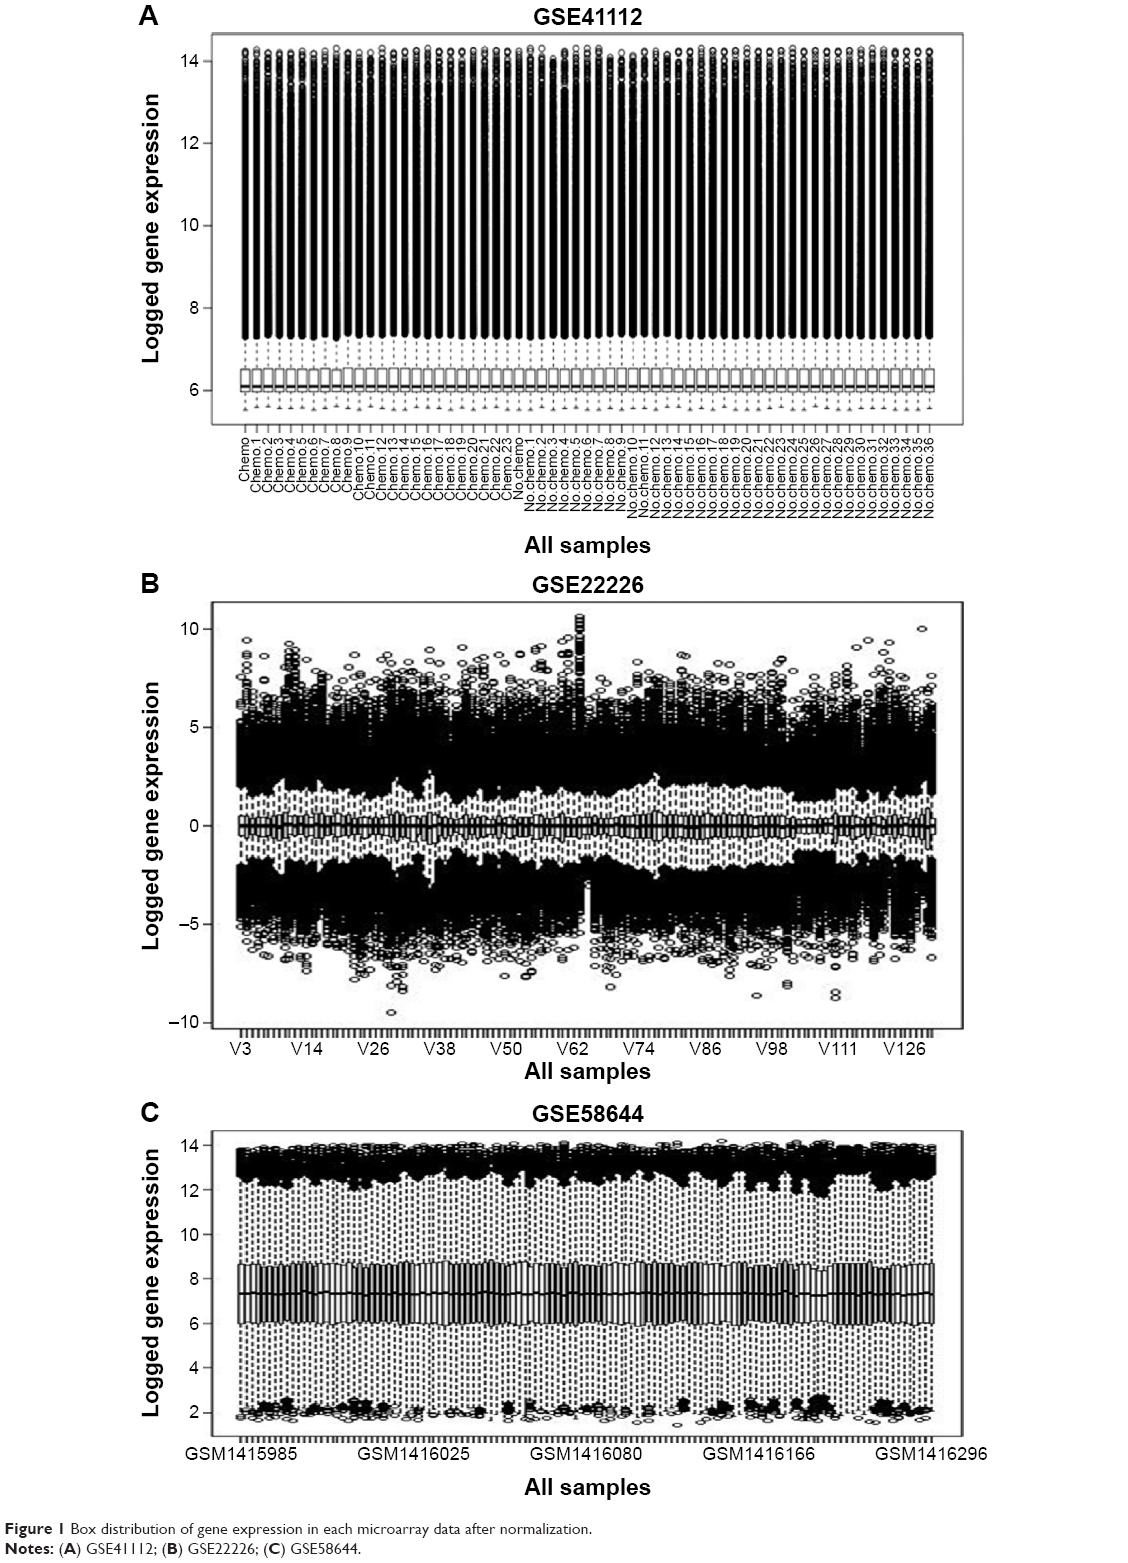 | Figure 1 Box distribution of gene expression in each microarray data after normalization. |
Using the significance analysis of microarray method, the 511 DEGs between breast cancer patients who received chemotherapy or not were obtained, consisting of 421 upregulated and 90 downregulated genes. Principal component analysis showed that these 511 DEGs could well distinguish the samples treated with or without chemotherapy (Figure 2), suggesting the reliability of gene expression profile analysis. Furthermore, functional enrichment analysis indicated that chemotherapy may be effective for treatment of breast cancer by altering the genes involved in apoptosis and immune-related signaling pathways (Table 1).
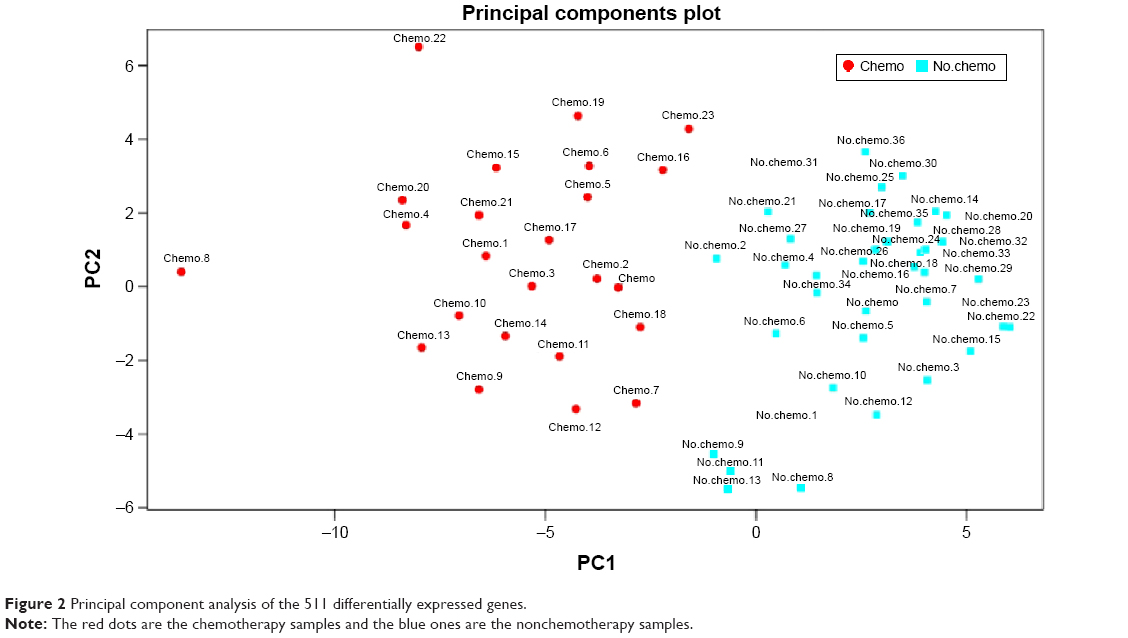 | Figure 2 Principal component analysis of the 511 differentially expressed genes. |
 | Table 1 Enriched pathways of upregulated and downregulated differentially expressed genes (top ten) |
Identification of chemotherapy-related transcription factors
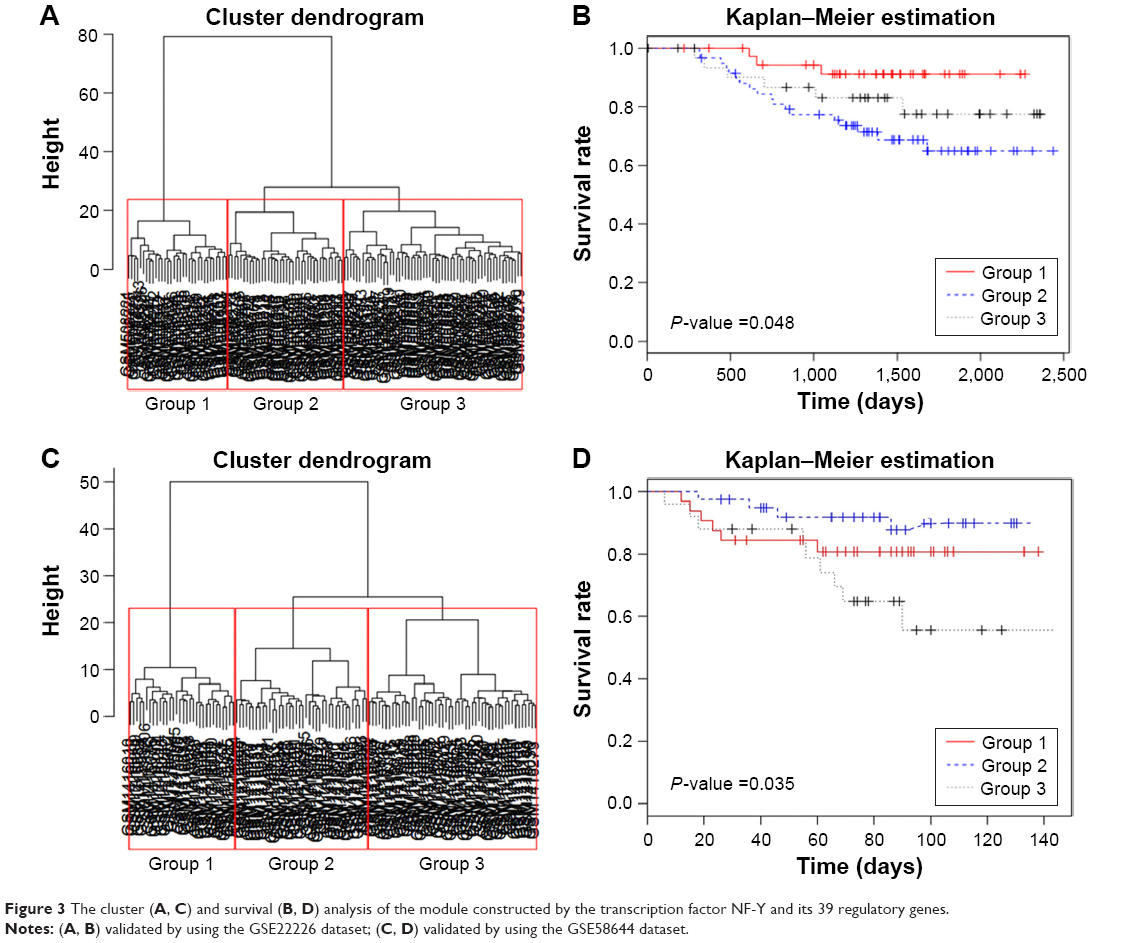
Using the differential coexpression profile, differential coexpression enrichment, and DCsum algorithms of DCGL package, 1,244 DCGs were identified. We then matched the 1,244 DCGs to the known regulatory data between transcription factors and target genes, and used the DRrank function to screen the transcription factors that can significantly regulate the DCGs. As a result, three transcription factors (NFY, CP1C, and NFYC) were obtained by TDD method, but only one was collected by TED method (NFY). To improve the reliability, only the common complex transcription factor NFY (NFYA, NFYB, and NFYC), which corresponded to 1,608 target genes (but only 36 were DCGs) was used for further analysis. NFY and its differential target genes (39 genes in total) were regarded as gene modules to perform the hierarchical cluster analysis. As shown in Figure 3A, these 39 genes can classify the 130 samples in GSE22226 dataset into three subtypes, which exhibited significantly different survival according to the Kaplan–Meier plots (P=0.0485) (Figure 3B). Furthermore, the same conclusion was also validated by using the 123 samples of GSE58644 dataset (Figure 3C, D).
 | Figure 3 The cluster (A, C) and survival (B, D) analysis of the module constructed by the transcription factor NF-Y and its 39 regulatory genes. |
A univariate Cox regression analysis was performed to further test whether the expression of each prognostic gene was associated with survival. As a result, a total of 22 and 15 genes were found to be significantly associated with poor and good prognosis, respectively, in the GSE22226 dataset, while in the GSE58644 dataset, nine genes were found to be significantly associated with both poor and good prognoses. The common eight genes (PNOC, STAG3, CDC20, CNBP, WARS, CNN3, NUSAP1, YARS) relevant to good prognosis were regulated by NFYA (Figure 4A), but the genes (HOOK1, ANKRD12, FKBP14, DICER1, C7orf23, ZMYM2, H3F3B, ARID4A) correlated to poor prognosis were regulated by NFYB (Figure 4B). It is to be noted that except for four genes, CDC20, NUSAP1, YARS, and WARS, expressions of the prognosis-related genes were upregulated (data not shown).
 | Figure 4 Two regulatory modules associated with poor (A) and good (B) prognoses after chemotherapy. |
Discussion
By using the DCGL package, we found that the 39 DCGs regulated by the transcription factor NFY can classify the patients who received chemotherapy into different subtypes with different survival rates. Further study showed several of the 39 DCGs were significantly associated with good (such as CDC20) and poor (such as ARID4A) prognoses following chemotherapy. The good prognosis genes may be underlying biomarkers for scheduling the treatment scheme, while the poor prognosis genes may be potential targets for further therapy.
Recent studies have indicated the roles of some of the above genes in cancer and the relationship between their expression and prognosis. For example, the cell division cycle 20 homolog (CDC20) is an important spindle assembly checkpoint protein that activates the anaphase-promoting complex/cyclosome for anaphase initiation and mitosis exit. Abnormalities in CDC20 expression may abolish mitotic arrest and promote cell cycle progression, leading to the development of cancer. Recently, CDC20 was found to be overexpressed in many types of human cancers and predictive of poor prognosis of cancers, including oral cancer,16 non-small-cell lung cancer,17 urothelial bladder cancer,18 gastric cancer,19 and breast cancer.20,21 Thus, targeting CDC20 may be a novel cancer therapeutic strategy.22 Furthermore, Jiang et al23 found that the downregulation of CDC20 by ganodermanontriol significantly inhibits the growth and invasiveness of human breast cancer cells. Consistent with these studies, we also found that decreased expression of CDC20 was associated with good prognosis after chemotherapy, suggesting that chemotherapy might reduce the expression of CDC20; thus, CDC20 could serve as a biomarker for the therapy of breast cancer. Interestingly, CDC20 is involved in the regulation of immune system.24 In our present study, CDC20 was significantly enriched in immune system-related pathways, implying that CDC20 might affect the prognosis of breast cancer via the involvement of immune system pathway after chemotherapy.
The AT-rich interactive domain 4A (ARID4A) encodes a protein that was previously known as retinoblastoma-binding protein 1. ARID4A can be recruited by the retinoblastoma gene to repress the E2F-dependent transcription and leads to cell cycle arrest.25 In addition, ARID4A is shown to interact with the breast cancer metastasis suppressor 1 (BRMS1), which has the ability to reduce the metastatic activity of cancer cells.26 Thus, ARID4A is implied to play protective roles in the development and progression of cancer, which was demonstrated by the study of Wu et al27 who reported that ARID4A-deficient mice may easily progress to acute myeloid leukemia and have rapid further increases of leukocyte counts. Moreover, downregulation of ARID4A results in the suppression of metastasis in human breast cancer cells.28,29 In line with these studies, our findings indicated that the high expression of ARID4A is related to the poor prognosis after chemotherapy, implying that chemotherapy might cause the upregulation of ARID4A, and this gene might be the potential target for breast cancer therapy. ARID4A was also reported displaying a partial selectivity for FASL and dulanermin over TNF-mediated apoptosis,30 which was consistent with our results. These collectively suggest that ARID4A might exert its roles in the regulation of breast cancer metastasis through the influence on apoptosis. However, more expression validations are needed. Furthermore, the NF-Y transcription factor was found to regulate the prognosis-related genes, indicating it may also play significant roles in breast cancer. NF-Y is a heterotrimer transcription factor (including NF-YA, NF-YB, and NF-YC subunits) that specifically binds to the CCAAT consensus site of target genes and regulates the gene expression. Pj and Leaner31 showed that NFY can activate the promoter activity of the nuclear exporter protein, Crm1, and promote its high expression in cancer. The upregulation of Crm1 is markedly associated with larger tumor size (P=0.01), liver metastasis (P=0.003), and poor progression-free survival, as well as overall survival (95% confidence interval, 1.27–5.39).32 Garipov et al33 also report that NFYA is upregulated in human epithelial ovarian cancer cells (EOC). Further study indicated that NFYA can bind to two CCAAT sites at the proximal region of the human EZH2 gene promoter and upregulate EZH2 transcription, predicting poor overall survival in EOC patients. Knockdown of NFYA triggers apoptosis of human EOC cells and, thus, may achieve the goal of treatment for EOC. Therefore, we believe NF-Y gene may be the underlying target gene for breast cancer. However, there are no experimental studies to investigate the regulatory relationship between NFY and our prognosis-related genes (ie, CDC20 and ARID4A), suggesting further research is needed to confirm our results.
In conclusion, this study provided a series of biomarkers for predicting the prognosis of chemotherapy or targets for development of alternative treatment (ie, CDC20 and ARID4A) in breast cancer patients. Furthermore, these genes may be regulated by the transcription factor NFY, also suggesting the potential therapeutic target of NFY in breast cancer. However, more experimental validations are needed in future studies.
Disclosure
The authors report no conflicts of interest in this work.
References
Siegel R, Ma J, Zou Z, Jemal A. Cancer statistics, 2014. CA Cancer J Clin. 2014;64(1):9–29. | ||
McVeigh TP, Al-Azawi D, Kearney DE, et al. Assessing the impact of neoadjuvant chemotherapy on the management of the breast and axilla in breast cancer. Clin Breast Cancer. 2014;14(1):20–25. | ||
Loibl S, Volz C, Mau C, et al. Response and prognosis after neoadjuvant chemotherapy in 1,051 patients with infiltrating lobular breast carcinoma. Breast Cancer Res Treat. 2014;144(1):153–162. | ||
Loibl S, Jackisch C, Lederer B, et al. Outcome after neoadjuvant chemotherapy in young breast cancer patients: a pooled analysis of individual patient data from eight prospectively randomized controlled trials. Breast Cancer Res Treat. 2015;152(2):377–387. | ||
Sun S, Liang X, Zhang X, et al. Phosphoglycerate kinase-1 is a predictor of poor survival and a novel prognostic biomarker of chemoresistance to paclitaxel treatment in breast cancer. Br J Cancer. 2015;112(8):1332–1339. | ||
Ataseven B, Gunesch A, Eiermann W, et al. PTK7 as a potential prognostic and predictive marker of response to adjuvant chemotherapy in breast cancer patients, and resistance to anthracycline drugs. Onco Targets Ther. 2014;7:1723–1731. | ||
Parker JS, Mullins M, Cheang MC, et al. Supervised risk predictor of breast cancer based on intrinsic subtypes. J Clin Oncol. 2009;27(8):1160–1167. | ||
Tsunashima R, Naoi Y, Kagara N, et al. Construction of multi-gene classifier for prediction of response to and prognosis after neoadjuvant chemotherapy for estrogen receptor positive breast cancers. Cancer Lett. 2015;365(2):166–173. | ||
Esserman LJ, Berry DA, Cheang MC, et al. Chemotherapy response and recurrence-free survival in neoadjuvant breast cancer depends on biomarker profiles: results from the I-SPY 1 TRIAL (CALGB 150007/150012; ACRIN 6657). Breast Cancer Res Treat. 2012;132(3):1049–1062. | ||
Tofigh A, Suderman M, Paquet ER, et al. The prognostic ease and difficulty of invasive breast carcinoma. Cell Rep. 2014;9(1):129–142. | ||
Ma H, Schadt EE, Kaplan LM, Zhao H. COSINE: COndition-SpecIfic sub-NEtwork identification using a global optimization method. Bioinformatics. 2011;27(9):1290–1298. | ||
Ferrari F, Bortoluzzi S, Coppe A, et al. Novel definition files for human GeneChips based on GeneAnnot. BMC Bioinformatics. 2007;8:446. | ||
Larsson O, Wahlestedt C, Timmons JA. Considerations when using the significance analysis of microarrays (SAM) algorithm. BMC Bioinformatics. 2005;6:129. | ||
Dennis G Jr., Sherman BT, Hosack DA, et al. DAVID: database for annotation, visualization, and integrated discovery. Genome Biol. 2003;4(5):P3. | ||
Yang J, Yu H, Liu B-H, et al. DCGL v2. 0: an R package for unveiling differential regulation from differential co-expression. PLoS One. 2013;8(11):e79729. | ||
Mondal G, Sengupta S, Panda CK, Gollin SM, Saunders WS, Roychoudhury S. Overexpression of Cdc20 leads to impairment of the spindle assembly checkpoint and aneuploidization in oral cancer. Carcinogenesis. 2006;28(1):81–92. | ||
Kato T, Daigo Y, Aragaki M, Ishikawa K, Sato M, Kaji M. Overexpression of CDC20 predicts poor prognosis in primary non-small cell lung cancer patients. J Surg Oncol. 2012;106(4):423–430. | ||
Choi J-W, Kim Y, Lee J-H, Kim Y-S. High expression of spindle assembly checkpoint proteins CDC20 and MAD2 is associated with poor prognosis in urothelial bladder cancer. Virchows Arch. 2013;463(5):681–687. | ||
Ding Z-Y, Wu H-R, Zhang J-M, Huang G-R, Ji D-D. Expression characteristics of CDC20 in gastric cancer and its correlation with poor prognosis. Int J Clin Exp Pathol. 2014;7(2):722–727. | ||
Krishnamurthy S. Cdc20 and securin overexpression predict short-term breast cancer survival. Breast Diseases: a YB Quarterly. 2015;26(2):140–142. | ||
Karra H, Repo H, Ahonen I, et al. Cdc20 and securin overexpression predict short-term breast cancer survival. Br J Cancer. 2014;110(12):2905–2913. | ||
Wang L, Zhang J, Wan L, Zhou X, Wang Z, Wei W. Targeting Cdc20 as a novel cancer therapeutic strategy. Pharmacol Ther. 2015;151:141–151. | ||
Jiang J, Jedinak A, Sliva D. Ganodermanontriol (GDNT) exerts its effect on growth and invasiveness of breast cancer cells through the down-regulation of CDC20 and uPA. Biochem Biophys Res Commun. 2011;415(2):325–329. | ||
Barbano PE, Spivak M, Feng J, Antoniotti M, Mishra B. A coherent framework for multiresolution analysis of biological networks with “memory”: Ras pathway, cell cycle, and immune system. Proc Natl Acad Sci U S A. 2005;102(18):6245–6250. | ||
Lai A, Kennedy BK, Barbie DA, et al. RBP1 recruits the mSIN3-histone deacetylase complex to the pocket of retinoblastoma tumor suppressor family proteins found in limited discrete regions of the nucleus at growth arrest. Mol Cell Biol. 2001;21(8):2918–2932. | ||
Seraj MJ, Samant RS, Verderame MF, Welch DR. Functional evidence for a novel human breast carcinoma metastasis suppressor, BRMS1, encoded at chromosome 11q13. Cancer Res. 2000;60(11):2764–2769. | ||
Wu MY, Eldin KW, Beaudet AL. Identification of chromatin remodeling genes Arid4a and Arid4b as leukemia suppressor genes. J Natl Cancer Inst. 2008;100(17):1247–1259. | ||
Hurst DR, Xie Y, Vaidya KS, et al. Alterations of BRMS1-ARID4A interaction modify gene expression but still suppress metastasis in human breast cancer cells. J Biol Chem. 2008;283(12):7438–7444. | ||
Hurst DR, Edmonds MD, Scott GK, Benz CC, Vaidya KS, Welch DR. Breast cancer metastasis suppressor 1 up-regulates miR-146, which suppresses breast cancer metastasis. Cancer Res. 2009;69(4):1279–1283. | ||
Dompe N, Rivers CS, Li L, et al. A whole-genome RNAi screen identifies an 8q22 gene cluster that inhibits death receptor-mediated apoptosis. Proc Natl Acad Sci. 2011;108(43):E943–E951. | ||
van der Watt PJ, Leaner VD. The nuclear exporter, Crm1, is regulated by NFY and Sp1 in cancer cells and repressed by p53 in response to DNA damage. Biochim Biophys Acta. 2011;1809(7):316–326. | ||
Huang WY, Yue L, Qiu WS, Wang LW, Zhou XH, Sun Y. Prognostic value of CRM1 in pancreas cancer. Clin Invest Med. 2009;32(6):E315. | ||
Garipov A, Li H, Bitler BG, Thapa RJ, Balachandran S, Zhang R. NF-YA underlies EZH2 upregulation and is essential for proliferation of human epithelial ovarian cancer cells. Mol Cancer Res. 2013;11(4):360–369. |
 © 2016 The Author(s). This work is published and licensed by Dove Medical Press Limited. The full terms of this license are available at https://www.dovepress.com/terms.php and incorporate the Creative Commons Attribution - Non Commercial (unported, v3.0) License.
By accessing the work you hereby accept the Terms. Non-commercial uses of the work are permitted without any further permission from Dove Medical Press Limited, provided the work is properly attributed. For permission for commercial use of this work, please see paragraphs 4.2 and 5 of our Terms.
© 2016 The Author(s). This work is published and licensed by Dove Medical Press Limited. The full terms of this license are available at https://www.dovepress.com/terms.php and incorporate the Creative Commons Attribution - Non Commercial (unported, v3.0) License.
By accessing the work you hereby accept the Terms. Non-commercial uses of the work are permitted without any further permission from Dove Medical Press Limited, provided the work is properly attributed. For permission for commercial use of this work, please see paragraphs 4.2 and 5 of our Terms.