")
Back to Journals » Diabetes, Metabolic Syndrome and Obesity » Volume 13
Screening for Metabolic Syndrome Using an Integrated Continuous Index Consisting of Waist Circumference and Triglyceride: A Preliminary Cross-sectional Study
Authors Liu PJ , Lou HP, Zhu YN
Received 24 April 2020
Accepted for publication 29 July 2020
Published 18 August 2020 Volume 2020:13 Pages 2899—2907
DOI https://doi.org/10.2147/DMSO.S259770
Checked for plagiarism Yes
Review by Single anonymous peer review
Peer reviewer comments 3
Editor who approved publication: Prof. Dr. Muthuswamy Balasubramanyam
Peng Ju Liu,1 Hui Ping Lou,2 Yan Ning Zhu3
1Department of Clinical Nutrition, Peking Union Medical College Hospital, China Academic Medical Science and Peking Union Medical College, Beijing, People’s Republic of China; 2Department of Medical Examination Center, Peking Union Medical College Hospital, China Academic Medical Science and Peking Union Medical College, Beijing, People’s Republic of China; 3Department of Obstetrics and Gynecology, Peking Union Medical College Hospital, China Academic Medical Science and Peking Union Medical College, Beijing, People’s Republic of China
Correspondence: Peng Ju Liu Tel +86-10-69155550
Fax +86-10-69155551
Email [email protected]
Background: It has been suggested that hypertriglyceridemic waist (HW) phenotype is strongly associated with metabolic syndrome (MetS); however, there are very limited studies integrating triglyceride (TG) and waist circumference (WC) into a continuous variable to investigate the predictive power of this phenotype. Inspired from the triglyceride glucose index (TyG), we developed an integrated continuous index termed waist-triglyceride index (WTI) which was calculated as Ln [TG (mg/dl) WC (cm)/2].
Objective: We aimed to examine the potential of WTI in screening for MetS by comparing this quantitative index with the qualitative HW phenotype and other frequently used indices.
Methods: A cross-sectional study was conducted in a total of 3460 non-diabetic adults who participated in an annual health checkup. MetS was defined by the update National Cholesterol Education Program/Adult Treatment Panel ш criteria for Asian Americans. Receiving operating characteristic (ROC) curve and areas under the curve (AUC) were employed to evaluate the performance of the involved indices in screening for MetS. Statistical differences among the AUC values of the indices were compared.
Results: In both genders, the AUC value of WTI, TyG or HW phenotype was markedly larger than that of each anthropometric index alone. In men, there were no statistical differences in the AUC values among WTI, TyG and HW phenotype, whereas in women, the AUC value of WTI was significantly larger than that of HW phenotype [difference between area (DBA): 0.042, 95% CI: 0.0224– 0.0617, P < 0.0001] and was nominally and significantly smaller than that of TyG (DBA: 0.00646, 95% CI: 0.000903– 0.012, P = 0.0227).
Conclusion: Our results suggest that there are discriminatory performance between the WTI and HW phenotype in the detection of MetS in women rather than in men. Appropriate markers for screening MetS in population study should be considered according to the genders.
Keywords: metabolic syndrome, hypertriglyceridemic, waist circumference, triglyceride glucose index, hypertriglyceridemic waist phenotype
Introduction
Metabolic syndrome (MetS), not a disease per se, is a cluster of abnormalities that including abdominal obesity, hypertriglyceridemia, low high-density lipoprotein cholesterol (HDL-c), hyperglycemia and elevated blood pressure.1–3 The National Cholesterol Education Program’s Adult Treatment Panel ш (NCEP: ATP ш), World Health Organization (WHO) and International Diabetes Federation (IDF) employ this syndrome to highlight the risk of individuals developing cardiovascular disease (CVD) and type 2 diabetes (T2DM).1,4 Moreover, MetS increases mortality due to CVD,1,5,6 and is associated with the risk of certain types of cancers,7 such as colorectal cancer,8 pancreatic cancer,9 and breast cancer.10 Although different countries or organizations have recommended different criteria for the definition of MetS, abdominal obesity and insulin resistance are believed to be at the core of most cases of MetS.3 Along with the rising obesity rates, the nationwide prevalence of MetS among Chinese adults has remarkably increased from 9.8% to 24.2% within one decade,11,12 which poses a large health threat to the Chinese population.
The diagnosis of MetS is based on several components of metabolic abnormalities. However, numerous epidemiological and public health studies have been conducted in order to predict MetS using anthropometric indices because of their simple measurements. Anthropometric measurements, such as waist circumference (WC), waist-to-hip ratio (WHR), waist-to-height ratio (WHtR), and body mass index (BMI), have been reported to be strongly associated with MetS,13–15 but the majority of these studies focused on the analysis of only one or several anthropometric measurements suitable for the screening of MetS. Furthermore, the index that best predicts MetS remains controversial, despite the fact that WC is one of the components of MetS.16
Recently, a large number of studies have suggested using the hypertriglyceridemic waist (HW) phenotype, due to its simple and cost-effective measurement, as an alternative indicator of chronic disease or metabolic disorder, including prediabetes or diabetes,17–21 CVD,22,23 and MetS.16,24,25 However, whether the HW phenotype has a better discriminative power to identify individuals with cardiometabolic risk factors or metabolic diseases is still controversial. Some studies suggested that the concurrent use of WC and triglyceride (TG) levels could be more useful in prevalence studies of T2DM and CVD compared with the use of WC or TG alone.20–23 According to Blackburn et al,25 HW may be as discriminative as the NCEP-ATP III or the IDF criteria and could be used as an initial screening approach to identify individuals with deteriorated cardiometabolic risk markers. Conversely, von Bibra et al have reported that HW phenotype is not superior or even inferior to other indicators in predicting the concomitant presence of MetS and insulin resistance.26 Although the populations of those studies were different, this may not fully explain their inconsistent results. HW phenotype is a qualitative indicator of metabolic abnormality, while anthropometric indices and TG are both continuous variables. Thus, we hypothesized that another possible reason is the qualitative nature of HW phenotype itself. According to Yang et al, the waist circumference-triglyceride (WT) index, a continuous index calculated as WC (cm)×TG (mmol/L), is a good predictor for the development of coronary artery disease.27 However, Adejumo et al used anthropometric indices including WT index to predict MetS and reported that WT index was not superior to WC alone.28 Thus, by imitating the triglyceride glucose index (TyG) index, which is a continuous index indicating insulin resistance,29,30 we developed another form of WT index consisting of TG levels and WC and was calculated as Ln [TG (mg/dl) WC (cm)/2], termed waist-triglyceride index (WTI), in order to investigate whether this form of the index could identify the presence of MetS better than its qualitative form or other indicators of MetS.
Subjects and Methods
Study Population
From July to December 2015, a total of 3460 community-dwelling adults (1465 women and 1995 men) were recruited from the annual health checkup held at the Department of Health Medical Center, Peking Union Medical College Hospital, China Academic Medical Science and Peking Union Medical College (Beijing, People’s Republic of China). The participants in this study are distributed in multiple communities in Beijing. This study was approved by the Ethics Committee of Peking Union Medical College Hospital, China Academic Medical Science. All subjects participated in the study voluntarily. Written informed consent was obtained from all participants. This study was conducted according to the standards of the International Committee on Harmonization on Good Clinical Practice and the revised version of the Declaration of Helsinki.
To select the sample, the following inclusion criteria were applied: subjects who (1) participated in the study voluntarily and provided written informed consent; (2) were aged 20–79 years; and (3) were Chinese residing in the People’s Republic of China. The exclusion criteria were as follows: (1) those . with a BMI <18.5 kg/m2 or >30 kg/m2; (2) those with a history of type 1 or 2 diabetes mellitus or currently using hypoglycemic medications or latest lab-testing fasting glucose ≥7.0 mmol/L; (3) with a suspected liver or renal insufficiency: alanine aminotransferase (ALT) level higher than 120 U/L or serum total bilirubin concentration ≥1.5 mg/L or an estimated glomerular filtration rate (eGFR) less than 60 mL/minute/1.73 m2; (4) with a progressive malignancy currently undergoing radiotherapy or chemotherapy; (5) those with a definite family history of hypertriglyceridemia or with a serum TG concentration ≥10.0 mmol/L or those currently using lipid-lowering medications (bezafibrate or fenofibrate, etc); (6) those with a current hyperthyroidism or hypothyroidism; (7) those with an ongoing weight loss program or who are on a diet; (8) those with a history of weight-loss surgery; (9) those with a mean alcohol consumption more than 30 g per day;31 and (10) those with a confirmed coronary heart disease (participant flowchart is in the Supplemental Figure 1). By using a continuous sampling method, we recruited the participants who met the inclusion criteria and had none of the exclusion criteria.
A standard questionnaire was used by trained physicians to collect information including age, smoking status, drinking status, medical history, and medication use. Routine physical examinations were then performed on all participants. Two blood pressure recordings were obtained from the right arm of the participants in sitting position after 30 min of rest. The average of these two records was used.
Anthropometric Measurements
The participants were requested to wear light clothing and to take off their shoes when the well-trained examiners measured their anthropometric characteristics, with the participants in the standing position. Height was measured to the nearest 0.1 cm with a portable stadiometer. Weight was measured to the nearest 0.1 kg with a calibrated scale. WC to the nearest 0.1 cm was measured at the end of normal expiration by measuring from midway between the lower borders of the rib cage and the iliac crest. Hip circumference was measured at the widest point between the hip and the buttocks. The height, weight, WC, and hip circumference of each participant were measured twice, and then the average value was calculated. BMI was calculated by dividing weight (kg) by height squared (m2). WHR was calculated by dividing WC (cm) by hip circumference (cm); WHtR were calculated by dividing WC (cm) by height (cm).
Biochemical Measurements
Following an overnight fast (≥10 h), participants’ blood samples were drawn for assessing fasting lipid including total cholesterol (TC), TG, HDL-c and low-density lipoprotein cholesterol (LDL-c), fasting plasma glucose (FPG), ALT, aspartate aminotransferase (AST), total bilirubin, creatinine, serum uric acid (SUA), and high-sensitivity C-reactive protein (hs-CRP), using an automated analyzer (Olympus AU5800, Japan); as well as free triiodothyronine, free thyroxine, thyroid-stimulating hormone, using an automatic direct chemiluminescence analyzer (Siemens ADVIA Centaur XP, Germany). eGFR was calculated from serum creatinine using the abbreviated Modification of Diet in Renal Disease (MDRD) study formula:32 eGFR=186×(serum creatinine in mg/dL)−1.154×(age in years)−0.203×(0.742 if female).
Definition
MetS was defined using the updated National Cholesterol Education Program/Adult Treatment Panel ш criteria (NCEP-ATP ш) for Asian Americans as three or more of the following components:6 waist circumference ≥90 cm for men or ≥80 cm for women; triglycerides ≥1.7 mmol/L; HDL cholesterol <1.03 mmol/L for men or <1.30 mmol/L for women; blood pressure ≥130/85 mmHg or current of antihypertensive medications; or fasting glucose ≥5.6 mmol/L.
To determine HW phenotype, we considered the definition of the HW phenotype reported in recent studies.16,18,33,34 The HW phenotype was defined as follows: TG ≥1.5 mmol/L and WC ≥85 cm in women and TG ≥2.0 mmol/L and WC ≥90 cm in men. Therefore, men with TG <2.0 mmol/L and/or WC <90 cm and women with TG <1.5 mmol/L and/or WC <85 cm were considered normal participants.
Referring to the triglyceride-glucose index (TyG),29 we developed a continuous index-WTI, consisting of WC (cm) and TG (mg/dl). Therefore, the WTI was calculated as follows: WTI=Ln [TG (mg/dl) WC (cm)/2]
Statistical Analysis
Statistical analysis was performed using the Statistical Package Social Science (SPSS version 16.0, Chicago, IL, USA). In order to determine if the quantitative data conforms to a normal distribution, we used the Kolmogorov–Smirnov test. Normally distributed variables were described as mean (standard deviation, SD), whereas skewed variables were presented as median (interquartile ranges, 25–75%). The independent-sample t-test or the Mann–Whitney U-test, when appropriate, was used to compare continuous variables between MetS group and non-MetS group. Categorical variables were presented by frequency or percentage and examined by the chi-squared test. A logistic regression analysis was performed to determine the odds ratio (ORs) and 95% confidence intervals (CI) of MetS according to the values of WTI as well as the classification of HW phenotype (0=without any component of HW phenotype; 1=with only one component; 2=with two components) with adjustments for potential confounding factors. Receiving-operating characteristic (ROC) curves and areas under the curve (AUC) were used to calculate the AUC values of WTI and other indices for the screening of MetS. The values of BMI, WC, WHR, WHtR, WTI, and TyG that maximized the Youden index (sensitivity+specificity–1) were defined as optimal. Comparisons between the AUC values of WTI and other indices were conducted by the method described by DeLong et al.35 All reported P values were two-tailed, and a significant level of <0.05 was used.
Results
Basic Characteristics of the Participants
The overall prevalence of MetS was 20.9% in women and 29.5% in men, respectively. Basic characteristics of the participants are presented in Table 1. Compared with women without Mets, women with MetS were older (P<0.001) and had higher BMI, WC, WHR, WHtR, TyG, WTI, TC, TG, LDL-c, FPG, SUA, and hs-CRP (all P<0.001), but lower HDL-c concentrations (P<0.001). The proportion of women with hypertension was higher in MetS group than that in non-MetS group (P<0.001). In men, compared with men without MetS, men with MetS had higher BMI, WC, WHR, WHtR, TyG, WTI, TC, TG, FPG, SUA, and hs-CRP (all P<0.001), but lower HDL-c concentrations (P<0.001). The proportion of men with hypertension was higher in MetS group than that in non-MetS group (P<0.001). No significant differences in age and LDL-c were found between the two groups.
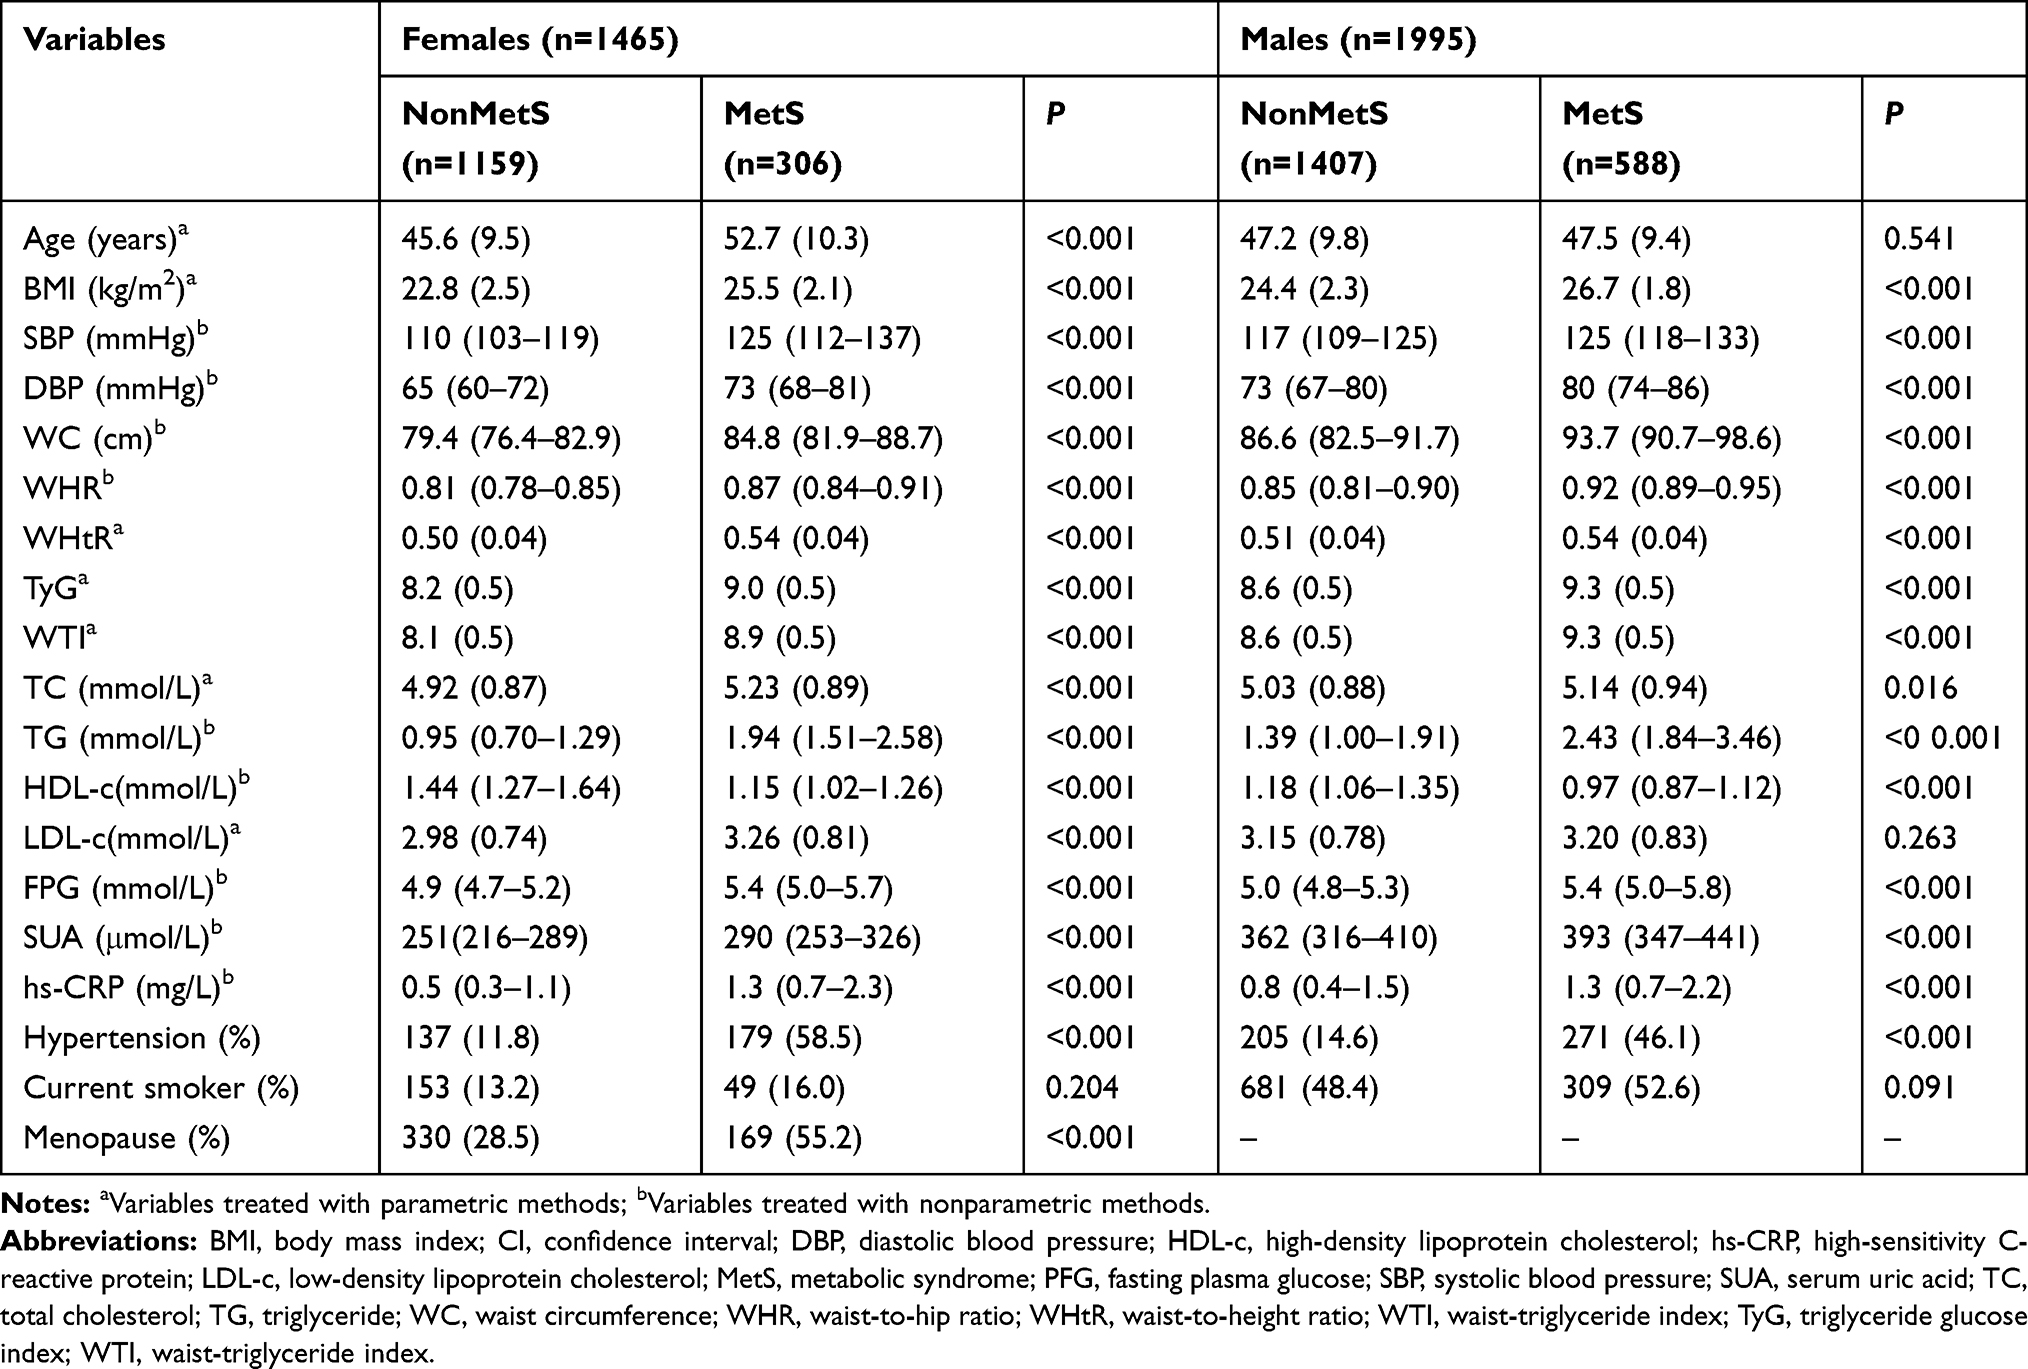 |
Table 1 The Characteristics of Participants with and without Metabolic Syndrome |
In addition, we performed Spearman correlation analyses between WTI and other anthropometric indices. The results showed that WTI was positively (all P<0.001) correlated with BMI, WC, WHR, WHtR, and TyG in both genders (the details are presented in Supplementary Table).
Associations Between MetS and the Quantitative and Qualitative Indices Consisting of TG and WC
In both genders, the one-standard deviation (SD) increments of WTI significantly increased the risk of MetS (all P<0.001). After that, WTI values were categorized into gender-specific quartiles, both women and men in the highest quartile of WTI had significantly higher odds of MetS than those in the lowest quartile (all P<0.001). Likewise, both women and men with HW phenotype had significantly higher odds of MetS than those without (all P<0.001) (Table 2). In the above regression models, we adjusted for covariates including age, smoking status, BMI, blood pressure, FPG, SUA, and hs-CRP for both genders (menopause status was only adjusted for models regarding women).
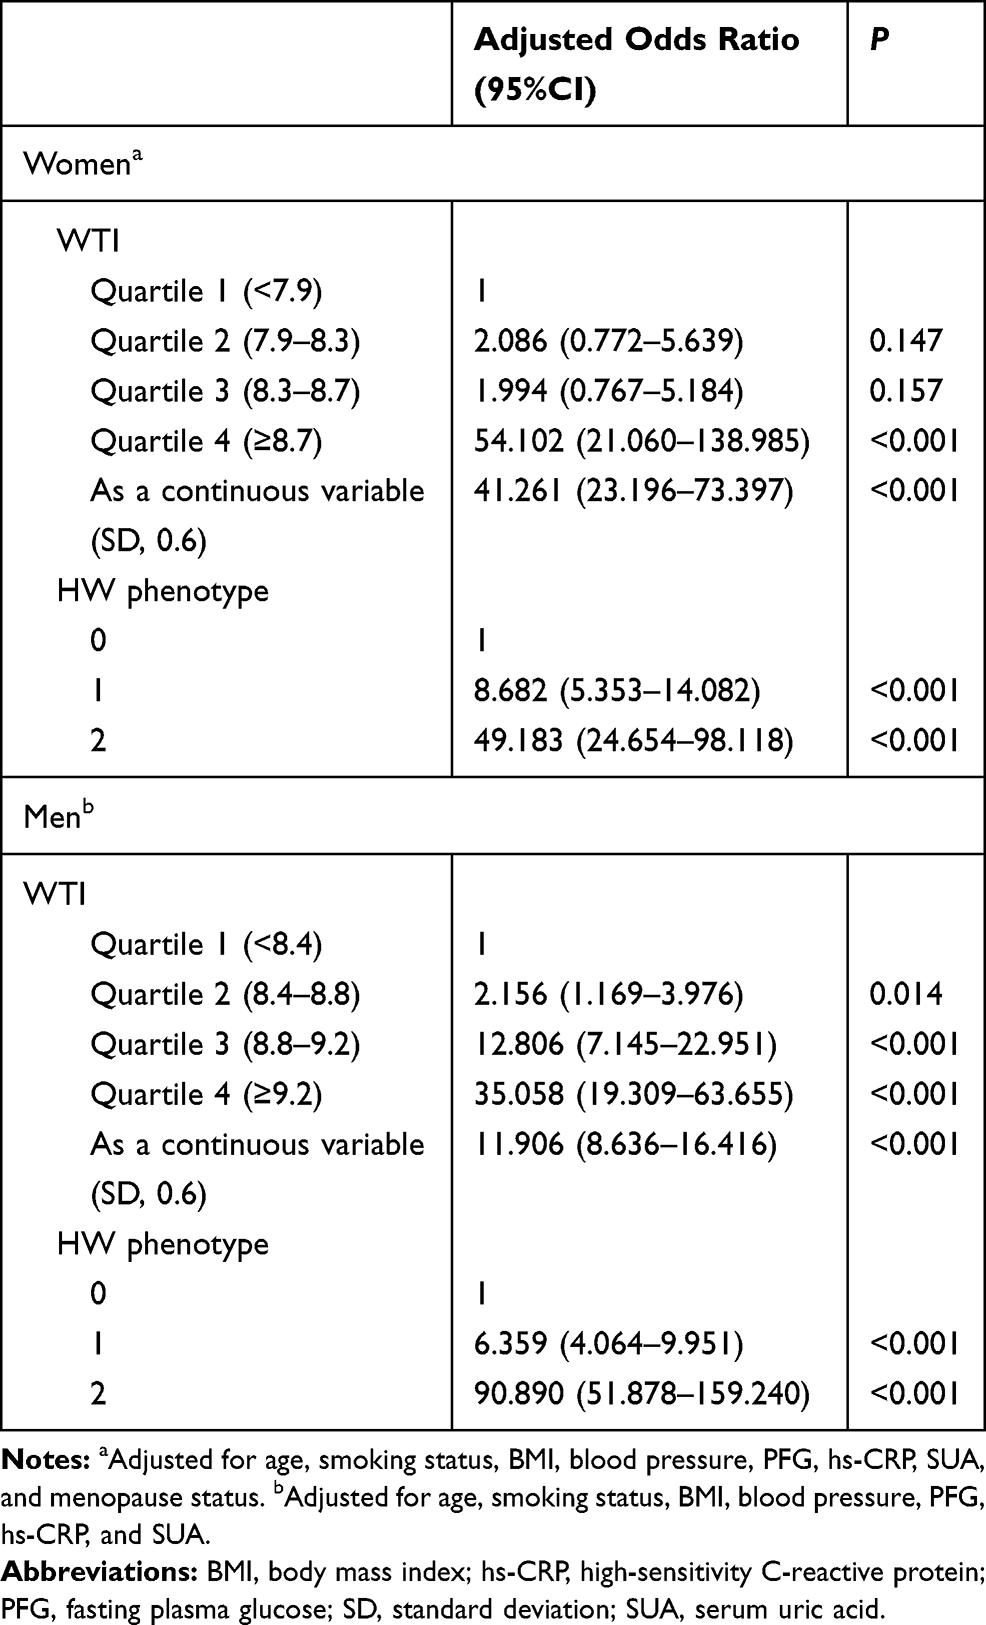 |
Table 2 Odds Ratios of MetS According to Gender-Specific Values of WTI and to Category Values of HW Phenotype |
ROC Curves of WTI and Other Indices for Screening MetS and Comparison of AUC Values Between WTI and Other Indices in Both Genders
For both genders, the ROC curves of WTI and other indices for screening MetS were located statistically above the diagonal nondiscrimination line (Table 3, Supplementary Figures 2 and 3, all P<0.0001). The differences in AUC values of WTI and other indices for screening MetS are presented in Table 4.
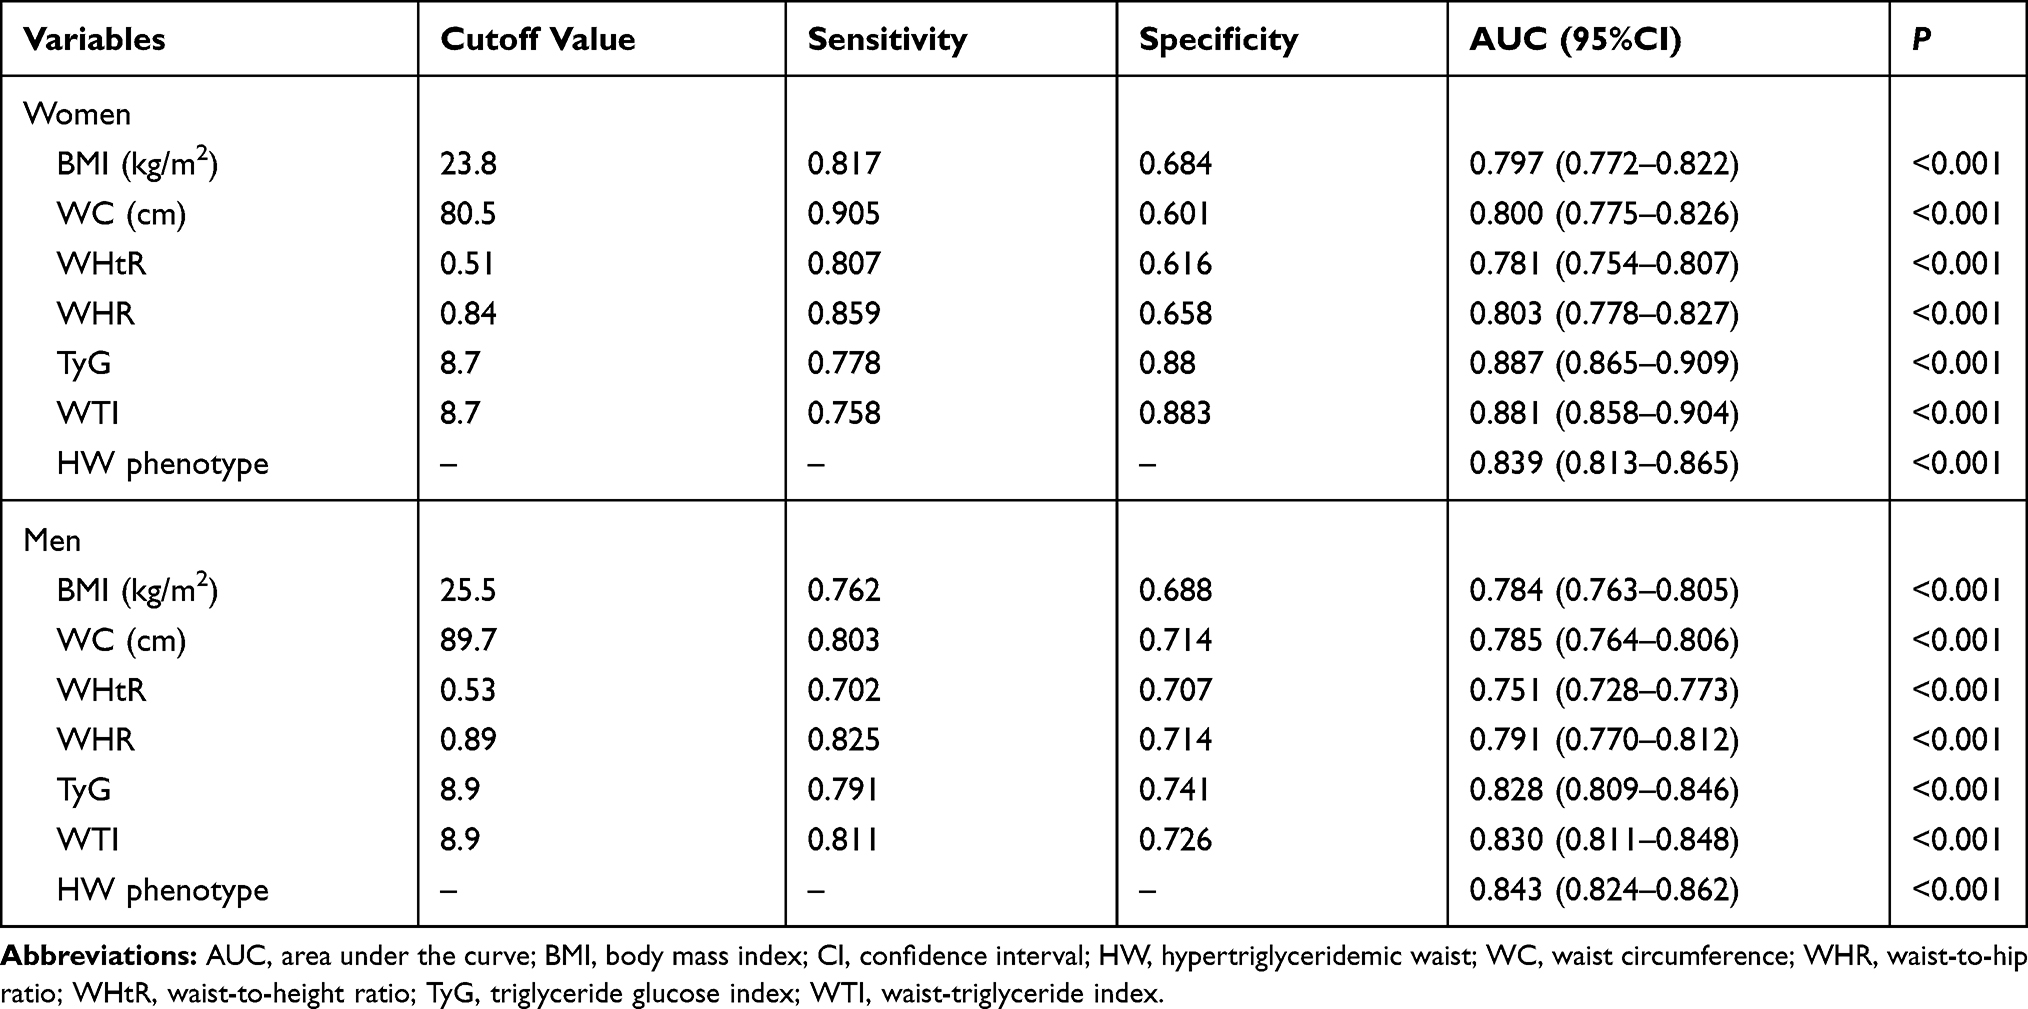 |
Table 3 Sensitivity, Specificity, and AUC of the Cutoff Values of the Indicators for Screening MetS |
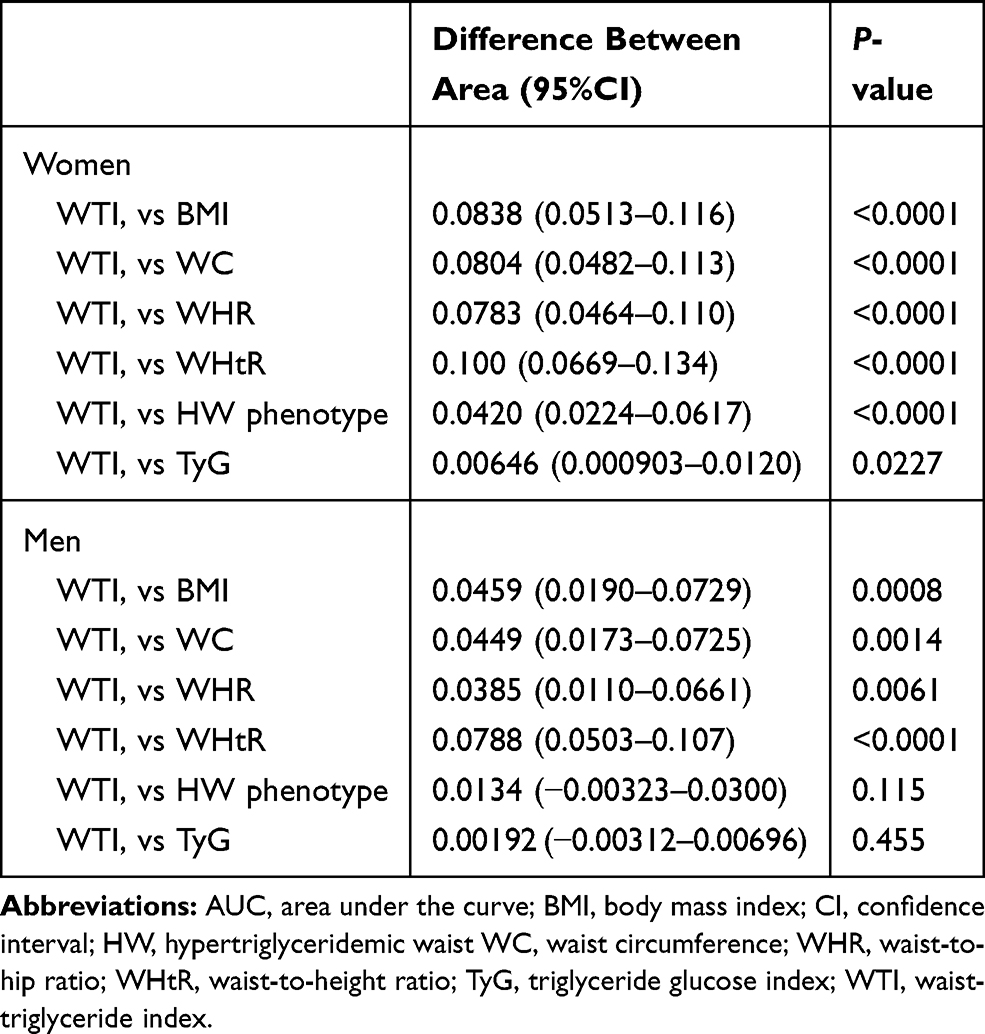 |
Table 4 Comparison of the AUC Values Between WTI and Other Indices for Detecting MetS |
In women, there were significant differences in AUC values between WTI and each anthropometric index (all P<0.0001) and between WTI and HW phenotype (P<0.0001). Although the AUC values of WTI and TyG were very close to each other, there were statistical differences between them (P=0.0227). These results suggest that, compared with anthropometric indices as well as HW phenotype, TyG and WTI exhibited additive and stronger power for the risk stratification of MetS; further, TyG was nominally and significantly better than WTI.
In men, there were also significant differences in AUC values between WTI and each anthropometric index (all P<0.0001). However, there were no statistical differences of AUC values among WTI, TyG and HW phenotype (Table 4). These results suggest that, compared with anthropometric indices, WTI, TyG and HW phenotype exhibited additive and stronger power for the risk stratification of MetS and the three indices possessed very similar ability to screen MetS in men.
Optimal Cutoff Values of WTI and Other Indices for MetS Screening
The optimal cutoff points of WTI, TyG and anthropometric indices and their most appropriate sensitivity, specificity for the detection of MetS in women and men are presented in Table 3. The cutoff values of WTI and TyG for screening MetS were both 8.7 for women and both 8.9 for men, respectively. In women, the cutoff values of BMI, WC, WHR and WHtR for screening MetS were 23.8 kg/m2, 80.5 cm, 0.84 and 0.51, respectively; in men, the cutoff values of BMI, WC, WHR and WHtR for screening MetS were 25.5 kg/m2, 89.7 cm, 0.89 and 0.53, respectively.
Discussion
Given the epidemic of the MetS, there is a need to develop simple and inexpensive screening tools that support physicians in identifying carriers of the risk of insulin resistance relative diseases such as diabetes, CVD, and certain types of cancers, which are all closely associated with MetS.26,36 This is particularly important, because the upstream MetS implies a therapeutic potential enabling the natural course and quality of subsequent diseases to be altered.26 The present study is the report that not only uses a continuous WTI to screen for MetS, but also that compares the discriminatory ability between this new quantitative index and the HW phenotype as well as other indices in common use for screening MetS in nondiabetic adults.
As known, WC, due to its close correlation with visceral fat quantity, is a simple anthropometric index that is closely associated with insulin resistance, and because of that, an enlarged WC is regarded as one of the diagnostic criteria of MetS. In the setting of central obesity, visceral adipocytes release excess fatty acids and proinflammatory adipocytokines such as leptin and tumor necrosis factor alpha into the portal circulation, increasing hepatic steatosis and insulin resistance.37 In addition, a number of studies have reported that other anthropometric indices such as WHR and WHtR have the similar or superior ability to predict MetS.13–15,38,39 Therefore, on the basis of population-based studies, it is difficult to determine the best anthropometric indicator of MetS due to the differences of age, gender, ethnicity and other related factors within the study population. In this study, we found that the AUC value of WHR was slightly larger than the other three anthropometric indices. However, after further comparisons among the anthropometric indices by using the method described by DeLong et al,35 we found that there were no statistical differences among the ability of BMI, WC, and WHR in screening for MetS in both genders, but they were all significantly better than WHtR (data not shown).
Apart from central obesity, the concept of insulin resistance also includes impairment in the oxidation and utilization of fatty acids.40 The increased flux of free fatty acids from adipose to nonadipose tissue results in abnormalities of fat metabolism, amplifying many of the fundamental metabolic derangements that are characteristic of insulin resistance.41 There is evidence indicating that hepatic triglyceride content is a strong determinant of hepatic insulin resistance and the intramyocellular triglyceride of the muscle insulin resistance.42–44 These findings support the important role that triglycerides play in insulin resistance. Therefore, a large number of studies have investigated the role of HW phenotype on the screening for MetS as well as MetS-related diseases.16–26,33,34,45 Confirming earlier studies, the present study showed significant associations of HW phenotype with the presence of MetS.16,22,23,25 In those studies, they only used the specific range of WC and TG values to the diagnosis of HW phenotype. Lee et al reported that it was difficult to find the better phenotype consisting of individual measurements and TG on basis of the specific range of TG and WC,18 indicating that the qualitative nature of HW phenotype may to some extent attenuate its effectiveness. Currently, there are limited studies comparing HW phenotype with other integrated indices in screening for MetS. von Bibra et al reported that HW phenotype was inferior to TG/HDL-c ratio in the identification of insulin resistance, impaired fasting glucose (IFG) and MetS by comparing different screening tools,26 where the HW phenotype was the only qualitative variable and the other two were both continuous integrated variables (TG/HDL-c and HOMA-IR).
Interestingly, Lee et al have suggested that the best indicators of MetS in terms of individual anthropometric indices and the various phenotypes combining a single anthropometric index with TG may differ subtly according to age group in women other than in men in their latest report.16 In this study, we also found that the ability of WTI, HW phenotype and TyG to screen for MetS may differ between genders. Unlike those studies, we transformed the qualitative HW phenotype into a specific continuous variable (WTI), and found that the one-SD increment of WTI significantly increased the odds of MetS in both genders. By comparing the AUC values of WTI, TyG, and HW phenotype, we found that the predictive power of WTI, HW phenotype and TyG in detecting MetS was almost similar in men, whereas in women, TyG and WTI exhibited additive and stronger power for the risk stratification of MetS compared with the HW phenotype; in addition, TyG was nominally and significantly better than WTI. These findings suggest that the appropriate markers and their cutoff values for screening MetS in population study should be considered according to the gender difference. Interestingly, WTI and TyG have the same optimal cutoff points for screening for MetS in both genders; the optimal cutoff points of the two indices for men and women were 8.9 and 8.7, respectively. To be noted, the optimal cutoff value of WTI in this study was based on the present population, whether it could also be applied to other countries or regions remains to be further studied.
The strengths of this study are as follows: (1) the findings were obtained from a relatively healthy large population, and the individuals in this study are distributed in multiple communities in Beijing; (2) this study firstly found that there were discriminatory effects on the screening for MetS between the quantitative and qualitative forms of the integration of TG and WC within genders. However, there are several limitations in this study. Its cross-sectional design makes it difficult to assess causal relationship. Also, we were unable to evaluate the level of insulin resistance based on this population who participated in the health checkup, thus, we could not provide any mechanistic explanation regarding our results. However, it has been confirmed that the HW phenotype is strongly associated with insulin resistance and MetS in several previous studies.
Conclusions
The findings of this study suggest that there are discriminatory effects on the screening for MetS between the quantitative and qualitative forms of the combination of TG and WC in women rather than in men. In order to screen MetS simply and efficiently in population studies, HW phenotype may be a reliable and inexpensive tool for men; whereas in women, it may be better to use TyG or WTI.
Abbreviations
AUC, area under the curve; DBA, difference between area; eGFR, estimated glomerular filtration rate; HDL-c, high-density lipoprotein cholesterol; HW, hypertriglyceridemic; hs-CRP, high-sensitivity C-reactive protein; LDL-c, low-density lipoprotein cholesterol; MetS, metabolic syndrome; PFG, fasting plasma glucose; ROC, receiving operating characteristic; TC, total cholesterol; TG, triglyceride; WC, waist circumference; WHR, waist-to-hip ratio; WHtR, waist-to-height ratio; WTI, waist-triglyceride index; TyG, triglyceride glucose index.
Acknowledgments
We thank all the participants of the study. We acknowledge the Medical Examination Center at Peking Union Medical College Hospital, China Academic Medical Science and Peking Union Medical College, for their assistance in this study.
Author Contributions
All authors made substantial contributions to conception and design, acquisition of data, or analysis and interpretation of data; took part in drafting the article or revising it critically for important intellectual content; gave final approval of the version to be published; and agree to be accountable for all aspects of the work.
Disclosure
The authors report no conflicts of interest for this work.
References
1. Alberti KG, Zimmet P, Shaw J. The metabolic syndrome: a new worldwide definition. Lancet. 2005;366:1059–1062. doi:10.1016/S0140-6736(05)67402-8
2. Cheung BM, Thomas GN. The metabolic syndrome and vascular disease in Asia. Cardiovasc Hematol Disord Drug Targets. 2007;7:79–85. doi:10.2174/187152907780830914
3. Samson SL, Garber AJ. Metabolic syndrome. Endocrinol Metab Clin North Am. 2014;43:1–23. doi:10.1016/j.ecl.2013.09.009
4. Panel on Detection, Evaluation, and Treatment of High Blood Cholesterol in Adults, Expert Panel on Detection E, Treatment of High Blood Cholesterol in A. Executive summary of the third report of the National Cholesterol Education Program (NCEP) expert panel on detection, evaluation, and treatment of high blood cholesterol in adults (adult treatment panel III). JAMA. 2001;285:2486–2497. doi:10.1001/jama.285.19.2486
5. Ford ES, Giles WH, Dietz WH. Prevalence of the metabolic syndrome among US adults: findings from the third National Health and nutrition examination survey. JAMA. 2002;287:356–359. doi:10.1001/jama.287.3.356
6. Grundy SM, Cleeman JI, Daniels SR, et al. Diagnosis and management of the metabolic syndrome: an American Heart Association/National Heart, Lung, and Blood Institute scientific statement. Circulation. 2005;112:2735–2752. doi:10.1161/CIRCULATIONAHA.105.169404
7. Uzunlulu M, Telci Caklili O, Oguz A. Association between metabolic syndrome and cancer. Ann Nutr Metab. 2016;68:173–179. doi:10.1159/000443743
8. Lee J, Lee KS, Kim H, et al. The relationship between metabolic syndrome and the incidence of colorectal cancer. Environ Health Prev Med. 2020;25:6. doi:10.1186/s12199-020-00845-w
9. Park SK, Oh CM, Kim MH, Ha E, Choi YS, Ryoo JH. Metabolic syndrome, metabolic components, and their relation to the risk of pancreatic cancer. Cancer. 2020;126(9):1979–1986. doi:10.1002/cncr.32737
10. Wani B, Aziz SA, Ganaie MA, Mir MH. Metabolic syndrome and breast cancer risk. Indian J Med Paediatr Oncol. 2017;38:434–439. doi:10.4103/ijmpo.ijmpo_168_16
11. Gu D, Reynolds K, Wu X, et al. Prevalence of the metabolic syndrome and overweight among adults in China. Lancet. 2005;365:1398–1405. doi:10.1016/S0140-6736(05)66375-1
12. Li Y, Zhao L, Yu D, Wang Z, Ding G. Metabolic syndrome prevalence and its risk factors among adults in China: a nationally representative cross‐sectional study. PLoS One. 2018;13:e199293.
13. Wang F, Wu S, Song Y, et al. Waist circumference, body mass index and waist to hip ratio for prediction of the metabolic syndrome in Chinese. Nutr Metab Cardiovasc Dis. 2009;19:542–547. doi:10.1016/j.numecd.2008.11.006
14. Shao J, Yu L, Shen X, Li D, Wang K. Waist-to-height ratio, an optimal predictor for obesity and metabolic syndrome in Chinese adults. Nutr Health Aging. 2010;14:782–785. doi:10.1007/s12603-010-0106-x
15. Liu PJ, Ma F, Lou HP, Zhu YN. Utility of obesity indices in screening Chinese postmenopausal women for metabolic syndrome. Menopause. 2014;21:509–514. doi:10.1097/GME.0b013e3182a170be
16. Lee BJ, Kim JY. Identification of metabolic syndrome using phenotypes consisting of triglyceride levels with anthropometric indices in Korean. BMC Endocr Disord. 2020;20:29. doi:10.1186/s12902-020-0510-0
17. Yu Z, Sun L, Qi Q, et al. Hypertriglyceridemic waist, cytokines and hyperglycaemia in Chinese. Eur J Clin Invest. 2012;42:1100–1111. doi:10.1111/j.1365-2362.2012.02702.x
18. Lee BJ, Kim JY. Identification of type 2 diabetes risk factors using phenotypes consisting of anthropometry and triglycerides based on machine learning. IEEE J Biomed Health Inform. 2016;20:39–46. doi:10.1109/JBHI.2015.2396520
19. Yu D, Huang J, Hu D, Chen J, Cao J, Li J. Is an appropriate cutoff of hypertriglyceridemic waist designated for type 2 diabetes among Chinese adults? Clin Nutr. 2010;29:192–198. doi:10.1016/j.clnu.2009.06.008
20. Zhao K, Yang SS, Wang HB, Chen K, Lu ZH, Mu YM. Association between the hypertriglyceridemic waist phenotype and prediabetes in Chinese adults aged 40 years and older. J Diabetes Res. 2018;2018:1031939. doi:10.1155/2018/1031939
21. Sam S, Haffner S, Davidson MH, et al. Hypertriglyceridemic waist phenotype predicts increased visceral fat in subjects with type 2 diabetes. Diabetes Care. 2009;32:1916–1920. doi:10.2337/dc09-0412
22. Lemieux I, Pascot A, Couillard C, et al. Hypertriglyceridemic waist: a marker of the atherogenic metabolic triad (hyperinsulinemia; hyperapolipoprotein B; small, dense LDL) in men? Circulation. 2000;102:179–184. doi:10.1161/01.CIR.102.2.179
23. Tankó LB, Bagger YZ, Qin G, Alexandersen P, Larsen PJ, Christiansen C. Enlarged waist combined with elevated triglycerides is a strong predictor of accelerated atherogenesis and related cardiovascular mortality in postmenopausal women. Circulation. 2005;111:1883–1890. doi:10.1161/01.CIR.0000161801.65408.8D
24. Lee BJ, Nam J, Kim JY. Predictors of metabolic abnormalities in phenotypes that combined anthropometric indices and triglycerides. BMC Complement Altern Med. 2016;16:59. doi:10.1186/s12906-016-1024-1
25. Blackburn P, Lemieux I, Alméras N, et al. The hypertriglyceridemic waist phenotype versus the national cholesterol education program-adult treatment panel III and international diabetes federation clinical criteria to identify high-risk men with an altered cardiometabolic risk profile. Metabolism. 2009;58:1123–1130. doi:10.1016/j.metabol.2009.03.012
26. von Bibra H, Saha S, Hapfelmeier A, Müller G, Schwarz PEH. Impact of the triglyceride/high-density lipoprotein cholesterol ratio and the hypertriglyceremic-waist phenotype to predict the metabolic syndrome and insulin resistance. Horm Metab Res. 2017;49:542–549. doi:10.1055/s-0043-107782
27. Yang RF, Liu XY, Lin Z, Zhang G. Correlation study on waist circumference-triglyceride (WT) index and coronary artery scores in patients with coronary heart disease. Eur Rev Med Pharmacol Sci. 2015;19:113–118.
28. Adejumo EN, Adejumo AO, Azenabor A, et al. Anthropometric parameter that best predict metabolic syndrome in South west Nigeria. Diabetes Metab Syndr. 2019;13:48–54. doi:10.1016/j.dsx.2018.08.009
29. Simental-Mendía LE, Rodríguez-Morán M, Guerrero-Romero F. The product of fasting glucose and triglycerides as surrogate for identifying insulin resistance in apparently healthy subjects. Metab Syndr Relat Disord. 2008;6:299–304. doi:10.1089/met.2008.0034
30. Won KB, Park GM, Lee SE, et al. Relationship of insulin resistance estimated by triglyceride glucose index to arterial stiffness. Lipids Health Dis. 2018;17:268. doi:10.1186/s12944-018-0914-2
31. Park H, Kim K. Association of alcohol consumption with lipid profile in hypertensive men. Alcohol. 2012;47:282–287. doi:10.1093/alcalc/ags019
32. Levey AS, Bosch JP, Lewis JB, Greene T, Rogers N, Roth D. A more accurate method to estimate glomerular filtration rate from serum creatinine: a new prediction equation. Modification of diet in renal disease study group. Ann Intern Med. 1999;130:461–470. doi:10.7326/0003-4819-130-6-199903160-00002
33. Blackburn P, Lemieux I, Lamarche B, et al. Hypertriglyceridemic waist: a simple clinical phenotype associated with coronary artery disease in women. Metabolism. 2012;61:56–64. doi:10.1016/j.metabol.2011.05.017
34. St-Pierre J, Lemieux I, Perron P, et al. Relation of the hypertriglyceridemic waist phenotype to earlier manifestations of coronary artery disease in patients with glucose intolerance and type 2 diabetes mellitus. Am J Cardiol. 2007;99:369–373. doi:10.1016/j.amjcard.2006.08.041
35. DeLong ER, DeLong DM, Clarke-Pearson DL. Comparing the areas under two or more correlated receiver operating characteristic curves: a nonparametric approach. Biometrics. 1988;8:37–45.
36. Eyre H, Kahn R, Robertson RM. Preventing cancer, cardiovascular disease, and diabetes. Diabetes Care. 2004;27:1812–1824. doi:10.2337/diacare.27.7.1812
37. Hardy OT, Czech MP, Corvera S. What causes the insulin resistance underlying obesity? Curr Opin Endocrinol Diabetes Obes. 2012;19:81–87. doi:10.1097/MED.0b013e3283514e13
38. Gharipour M, Sarrafzadegan N, Sadeghi M, et al. Predictors of metabolic syndrome in the Iranian population: waist circumference, body mass index, or waist to hip ratio? Cholesterol. 2013;2013:198384. doi:10.1155/2013/198384
39. Bener A, Yousafzai MT, Darwish S, Al-Hamaq AO, Nasralla EA, Abdul-Ghani M. Obesity index that better predict metabolic syndrome: body mass index, waist circumference, waist hip ratio, or waist height ratio. J Obes. 2013;2013:269038. doi:10.1155/2013/269038
40. Kelley DE, Goodpaster BH. Skeletal muscle triglyceride. An aspect of regional adiposity and insulin resistance. Diabetes Care. 2001;24:933–941. doi:10.2337/diacare.24.5.933
41. Lewis GF, Carpentier A, Adeli K, Giacca A. Disordered fat storage and mobilization in the pathogenesis of insulin resistance and type 2 diabetes. Endocr Rev. 2002;23:201–229.
42. Ryysy L, Häkkinen AM, Goto T, et al. Hepatic fat content and insulin action on free fatty acids and glucose metabolism rather than insulin absorption are associated with insulin requirements during insulin therapy in type 2 diabetic patients. Diabetes. 2000;49:749–758. doi:10.2337/diabetes.49.5.749
43. Goodpaster BH, Thaete FL, Simoneau JA, Kelley DE. Subcutaneous abdominal fat and thigh muscle composition predict insulin sensitivity independently of visceral fat. Diabetes. 1997;46:1579–1585. doi:10.2337/diacare.46.10.1579
44. Pan DA, Lillioja S, Kriketos AD, et al. Skeletal muscle triglyceride levels are inversely related to insulin action. Diabetes. 1997;46:983–988. doi:10.2337/diab.46.6.983
45. Ma CM, Wang R, Liu XL, Lu N, Lu Q, Yin FZ. The relationship between hypertriglyceridemic waist phenotype and early diabetic nephropathy in type 2 diabetes. Cardiorenal Med. 2017;7:295–300. doi:10.1159/000477828
 © 2020 The Author(s). This work is published and licensed by Dove Medical Press Limited. The full terms of this license are available at https://www.dovepress.com/terms.php and incorporate the Creative Commons Attribution - Non Commercial (unported, v3.0) License.
By accessing the work you hereby accept the Terms. Non-commercial uses of the work are permitted without any further permission from Dove Medical Press Limited, provided the work is properly attributed. For permission for commercial use of this work, please see paragraphs 4.2 and 5 of our Terms.
© 2020 The Author(s). This work is published and licensed by Dove Medical Press Limited. The full terms of this license are available at https://www.dovepress.com/terms.php and incorporate the Creative Commons Attribution - Non Commercial (unported, v3.0) License.
By accessing the work you hereby accept the Terms. Non-commercial uses of the work are permitted without any further permission from Dove Medical Press Limited, provided the work is properly attributed. For permission for commercial use of this work, please see paragraphs 4.2 and 5 of our Terms.