")
Back to Journals » Cancer Management and Research » Volume 12
Screening and Identification of Potential Biomarkers for Hepatocellular Carcinoma: An Analysis of TCGA Database and Clinical Validation
Authors Wei X, Ke J, Huang H, Zhou S, Guo A, Wang K, Zhan Y, Mai C, Ao W, Xie F, Luo R , Xiao J, Wei H , Chen B
Received 23 November 2019
Accepted for publication 20 February 2020
Published 17 March 2020 Volume 2020:12 Pages 1991—2000
DOI https://doi.org/10.2147/CMAR.S239795
Checked for plagiarism Yes
Review by Single anonymous peer review
Peer reviewer comments 2
Editor who approved publication: Professor Seema Singh
Xianli Wei,1,* Junzi Ke,2,3,* Haonan Huang,2,3,* Shikun Zhou,2,3 Ao Guo,4 Kun Wang,2,3 Yujuan Zhan,2,3 Cong Mai,5 Weizhen Ao,3 Fuda Xie,6,7 Rongping Luo,8 Jianyong Xiao,2 Hang Wei,4 Bonan Chen2,3
1Department of Medical Instruments, Guangdong Food and Drug Vocational College, Guangzhou 510520, People’s Republic of China; 2Department of Biochemistry, Guangzhou University of Chinese Medicine, Guangzhou 510006, People’s Republic of China; 3Research Center of Integrative Medicine, School of Basic Medicine, Guangzhou University of Chinese Medicine, Guangzhou 510006, People’s Republic of China; 4School of Medical Information Engineering, Guangzhou University of Chinese Medicine, Guangzhou, People’s Republic of China; 5Department of Abdominal Surgery, Cancer Center of Guangzhou Medical University, Guangzhou 510095, People’s Republic of China; 6The Second Clinical College, Guangzhou University of Chinese Medicine, Guangzhou 510006, People’s Republic of China; 7Guangdong Provincial Academy of Chinese Medical Sciences, Guangzhou 510006, People’s Republic of China; 8School of Foreign Language, Guangdong Pharmaceutical University, Guangzhou 510006, People’s Republic of China
*These authors contributed equally to this work
Correspondence: Bonan Chen; Hang Wei Email [email protected]; [email protected]
Introduction: Hepatocellular carcinoma (HCC) is the fifth most common cancer in the world. Up to now, many genes associated with HCC have not yet been identified. In this study, we screened the HCC-related genes through the integrated analysis of the TCGA database, of which the potential biomarkers were also further validated by clinical specimens. The discovery of potential biomarkers for HCC provides more opportunities for diagnostic indicators or gene-targeted therapies.
Methods: Cancer-related genes in The Cancer Genome Atlas (TCGA) HCC database were screened by a random forest (RF) classifier based on the RF algorithm. Proteins encoded by the candidate genes and other associated proteins obtained via protein–protein interaction (PPI) analysis were subjected to Gene Ontology (GO) and Kyoto Encyclopedia of Genes and Genomes (KEGG) pathway enrichment analyses. The newly identified genes were further validated in the HCC cell lines and clinical tissue specimens by Western blotting, immunofluorescence, and immunohistochemistry (IHC). Survival analysis verified the clinical value of genes.
Results: Ten genes with the best feature importance in the RF classifier were screened as candidate genes. By comprehensive analysis of PPI, GO and KEGG, these genes were confirmed to be closely related to HCC tumors. Representative NOX4 and FLVCR1 were selected for further validation by biochemical analysis which showed upregulation in both cancer cell lines and clinical tumor tissues. High expression of NOX4 or FLVCR1 in cancer cells predicts low survival.
Conclusion: Herein, we report that NOX4 and FLVCR1 are promising biomarkers for HCC that may be used as diagnostic indicators or therapeutic targets.
Keywords: hepatocellular carcinoma, biomarkers, TCGA database, NOX4, FLVCR1
Introduction
HCC is one of the most common malignancies worldwide with an increase in incidence.1,2 Currently, the most widely used diagnostic methods for HCC screening include biannual abdominal ultrasound examination and serum alpha-fetoprotein measurement.3 In the United States, all focal liver lesions suspected during ultrasound examination are verified using computed tomography and/or magnetic resonance imaging.4 The application of these methods makes the diagnosis of HCC a lot more accurate, in which the sensitivity of diagnosis is up to 89% and the specificity reaches as high as 99%.5 Unfortunately, if the lesions are <1 cm in diameter, the outcome of diagnosis may not be as precise (could be as low as 34%).6 Thus, it is of great significance to identify novel biomarkers of HCC that provides more opportunities for diagnostic indicators or gene-targeted therapy of HCC.
With the application of high-throughput sequencing technology, a large amount of cancer data has been collected and is now available to the medical research community.7,8 By extracting and analyzing these valuable data, it is possible to identify potential biomarkers that can improve the detection of cancer.9 RF is an ensemble algorithm that combines many weak predictors with good local performance to yield an ensemble predictor with strong global performance.10,11 In cancer research, RF could be used to predict the risks of cancer and the susceptibility of patients. And the feature importance of RF can be used to identify the significance of HCC tumor-related genes.
In this study, we established an effective classifier using the RF algorithm and thereby analyzed HCC transcriptome data plus corresponding control data obtained from TCGA database. Consequently, we could identify several potential biomarkers for HCC, which were verified in cancer cell lines and situ tumor samples. The survival curve revealed a negative correlation between the potential biomarkers and survival rates of patients.
Materials and Methods
Data Collection
HCC RNA-Seq data were downloaded from the TCGA database using The GDC Data Portal (https://portal.gdc.cancer.gov/). A total of 23,216 feature genes were revealed. Overall, 373 HCC tissue samples and 50 adjacent non-tumor tissue samples were included in the study.
Identification of Potential Biomarkers Using the RF Algorithm
RF is an ensemble algorithm that is composed of many decision trees.12 To classify a new instance, each decision tree provides a classification for input data and RF collects the classifications and chooses the most voted prediction as to the result, which has high accuracy values and high prediction power.13 An RF classifier was constructed based on all genes from the TCGA HCC database to identify potential biomarkers for HCC. All samples were stochastically rearranged and divided into 10 parts: seven of the 10 parts were used as the training set to acquire the threshold parameter for a training classifier, while the other parts were used as the test set. Subsequently, the training classifier was used to predict the accuracy within the test set by calculating the false-positive rate and false-negative rate. Receiver operating characteristic curve analysis was performed to evaluate the classification performance and robustness of the prediction classifier, which represented the ability of a feature to contribute to the prediction of target variables in the model, was calculated by a total decrease in tree-node impurities from splitting on the predictor feature variable and averaged over all sub-trees in the RF classifier. The importance measures of RF were often used for feature selection for high-dimensional data settings, which, in particular, makes RF attractive for bioinformatics and related fields wherein identifying a subset of relevant predictors from a large set of candidate predictors is a major challenge (ie, the “small n large p” problem). Features with FI of >5% were regarded as candidate genes that could be potential biomarkers. (The specific code was shown in Code S1, S2, and S3.)
Three-Level PPI Network Construction
The candidate genes selected from the RF classifier were mapped to the STRING database (http://www.string-db.org/) to find their first- and second-order outcome-associated proteins.14 PPI data were downloaded from the STRING database and visualized by using Cytoscape 3.6.1. Network topology characteristics were calculated using the Network Analyzer plugin.15
GO Functional and KEGG Pathway Enrichment Analysis
We performed GO and KEGG pathway enrichment analyses to determine potential biological functions and pathways of the protein mentioned in a three-level PPI network using the Database for Annotation Visualization and Integrated Discovery online tool (https://david.ncifcrf.gov/). p<0.05 was considered statistically significant.
Survival Analysis
Survival rates were assessed using the Kaplan–Meier method and survival curves were plotted using an online tool (http://gepia.cancer-pku.cn/detail.php). Comparisons between study groups were made using a Log-rank test; log-rank p<0.05 was considered significant.
Cells
The hepatocellular carcinoma HepG2 cells and normal liver LO2 cells were purchased from the American Type Culture Collection (http://www.atcc.org). The human HCC cell lines (BEL-7402 and SMMC-7721) were bought from the Shanghai Institute of Biotechnology and Cell Biology (Shanghai, China). All cell lines were maintained in a humidified 5% CO2 incubator in low-glucose Dulbecco’s Modified Eagle’s Medium (DMEM) culture medium containing 10% fetal bovine serum (FBS), 100 U/mL penicillin, and 100 μg/mL streptomycin. For sub-culturing, cells were detached using 0.05% trypsin–EDTA treatment at 37°C. And all cell lines were regularly checked by Quick Cell Mycoplasma Rapid Detection Kit (Shanghai Life iLab Biotech Co., Ltd, AC16L061) to ensure they are authentic and keep in good shape.
Tissue Specimens
Five paired fresh HCC specimens and adjacent non-tumor liver tissues were obtained from patients who underwent HCC resection at the Department of Abdominal Surgery, Cancer Center of Guangzhou Medical University (Guangzhou, China) in 2019. All tissues were used for Western blotting analysis. This study was approved by the Ethics Committee of the Cancer Center of Guangzhou Medical University. The study was conducted in accordance with Declaration of Helsinki. Written informed consent was obtained from every patient.
Western Blotting
Cells (LO2, BEL-7402, SMMC-7721, and HepG2) and tissues (HCC and adjacent non-tumor tissues) were lysed in a loading buffer (1×). After lysis, protein extracts (10 μL/lane) were subjected to 12% SDS-PAGE and transferred to polyvinylidene fluoride membranes. The membrane was blocked in TBST (0.05% Tween 20 in Tris-buffered saline) containing 5% milk for 2 h and then probed with antibodies for NOX4 (Absin Bioscience, Shanghai, China) and FLVCR1 (ABclonal Technology, Wuhan, China), followed by incubation at 4°C for overnight. The membrane was then washed three times with TBST, followed by incubation with secondary antibodies for 1 h at room temperature. Immunoreactive bands thus obtained were visualized by enhanced chemiluminescence.
Immunofluorescence Assay
Cells (1 × 10⁵ cells/well) were seeded onto a copolymer culture dish. The cells were fixed with 4% paraformaldehyde for 20 min at room temperature. For permeabilization, the cells were incubated with a blocking solution (9 mL PBS, 1 mL FBS, and 30 μL Triton X-100) for 3 h at room temperature. Subsequently, they were incubated with primary antibodies in a blocking solution at 4°C overnight, and then incubated with fluorescent secondary antibodies (1/400) at room temperature for 2 h; finally, they were stained with Hoechst 33342 for 10 min. Between each step, the cells were washed five times with PBS. Images were captured using the LSM 800 confocal microscope platform. Images were obtained with a laser scanning confocal microscope (Karl Zeiss, Jena, Germany).
IHC
Twenty-four cases of HCC and adjacent tissue chips were purchased from Wuhan Iwill Biological Technology Co., Ltd (Wuhan, China). Immunohistochemical determination for NOX4 (dilution 1:200) and FLVCR1 (dilution 1:400) was performed according to standard procedures using an antigen retrieval technique in citrate buffer. Follow-up IHC was performed with a ready-to-use high-efficiency immunohistochemical secondary antibody kit (Absin Bioscience, Shanghai, China), according to manufacturer instructions. Finally, we determined protein expression by optical microscopy. Two observers performed independent examinations to record histopathological features and specific immunoreactivity (IR). Staining was semi-quantitatively assessed by assigning scores to the intensity of IR and the proportion of positively stained cells. IR intensity was divided into four categories: 0 (no IR); 1 (weak IR); 2 (moderate IR); and 3 (strong IR). The proportion of positively stained cells was divided into four groups: 0 (no tumor cells showing IR); 0.33 (<1/3 of the tumor cells showing IR); 0.67 (1/3–2/3 of the tumor cells showing IR); and 1 (>2/3 of the tumor cells showing IR). The product of the two values represented the overall IR score.16
Results
Top 10 Genes with the Best Feature Importance Were Screened as Candidate Genes
To identify potential cancer-related genes for HCC, an RF classifier was established (Figure 1A). The performance of the RF algorithm was compared against that of the decision tree and gradient boosting decision tree algorithms. Our experimental results demonstrated that the RF classifier relatively exhibited the best performance, with an area under the curve (AUC) of 0.9974 and a comprehensive evaluation index (F1) score of 99.12% (Figure 1B, Table 1). Then, we identified 10 genes (NOX4, PAMR1, NAT2, STIL, NUDT10, C16ORF59, SFTA1P, FLVCR1, ZADH2, and VMO1) with high feature importance (FI > 5%) as candidate genes. The importance values of each candidate gene are shown in Figure 1D. Subsequently, we confirmed the importance of the 10 candidate genes by using them alone as the basis of classification (features) in order to classify all samples and to make a prediction. As a result, the 10 genes showed high classification performance with AUC of 0.9981, which was even higher than the AUC value of the original RF classifier (Figure 1C).
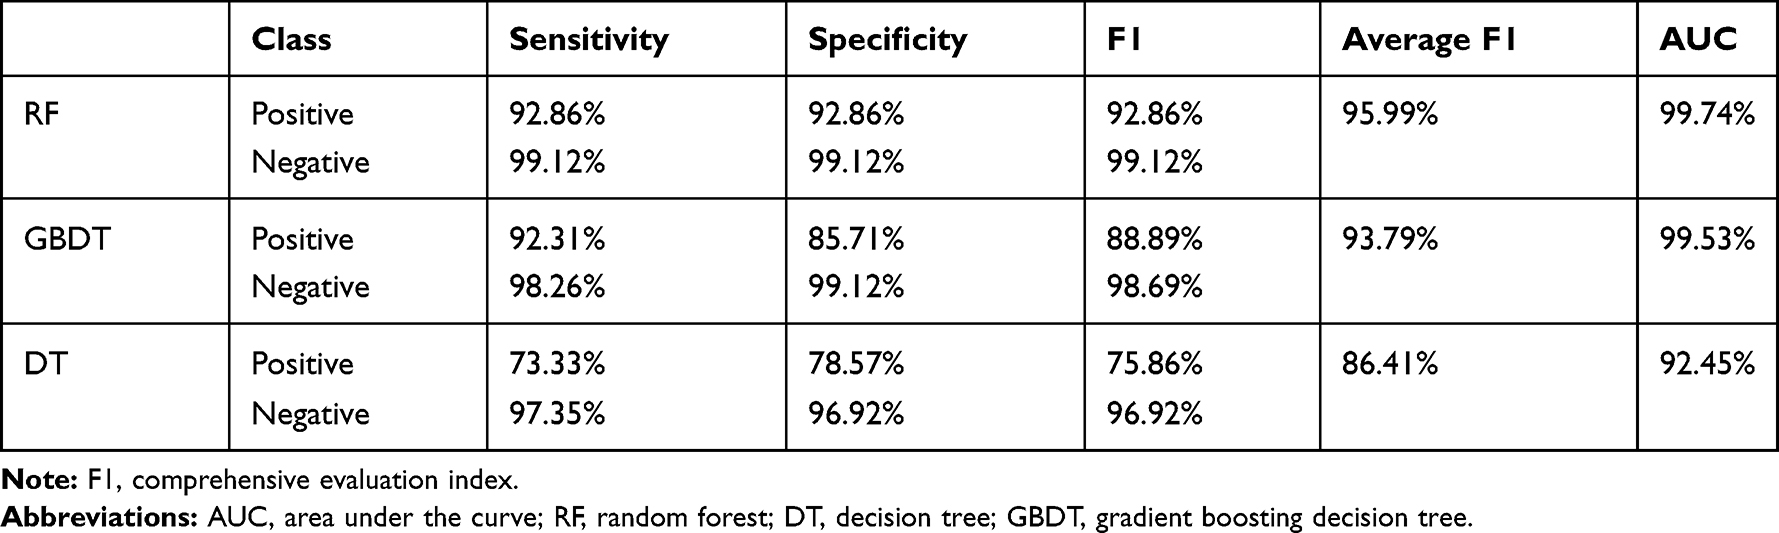 |
Table 1 Classification Results of Three Algorithms |
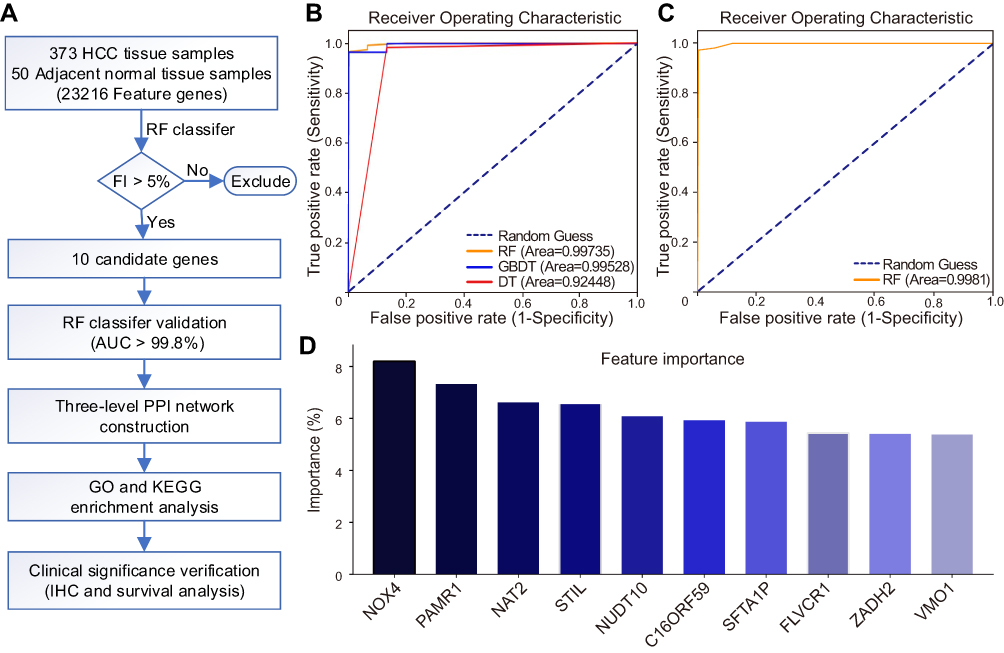 |
Figure 1 Ten candidate genes of HCC identified using RF algorithm. (A) Study workflow. (B) The receiver operating characteristic curve threshold was used for measuring algorithm quality. (C) The receiver operating characteristic curve of 10 important candidate genes under the RF classifier. (D) Importance value of top 10 genes. Abbreviations: FI, feature importance; AUC, area under the curve; PPI, protein–protein interaction; GO, Gene Ontology; KEGG, Kyoto Encyclopedia of Genes and Genomes; IHC, Immunohistochemistry. |
Candidate Genes are Involved in Cancer-Related Pathways
Since the expression levels of the 10 candidate genes significantly different between HCC tissue samples and adjacent normal tissue samples, the biological roles of these genes warranted further investigations (Figure 2B). We considered the proteins encoded by all candidate genes as driver proteins and constructed a three-level PPI network. As one of the candidate genes, named SFTA1P, is a non-coding RNA, the first PPI network level only contained nine candidate proteins. Besides, the three-level PPI network also had 1280 outcome-associated proteins that linked with the nine candidate proteins, included 161 first-order outcome-associated proteins in the second PPI network level and 1119 second-order outcome-associated proteins in the third PPI network level (Figure 2A). So there were 1289 outcome-associated proteins in the three-level PPI network. In GO analysis, these 1289 proteins were mainly involved in mitotic nuclear division, nuclear division, and organelle fission at the biological process level. Besides, at the cellular component level, chromosomal region, centromeric region, and condensed chromosome were the three most significant categories. And at the molecular function level, peptide receptor activity, tubulin binding, and G protein-coupled peptide receptor activity were the most significantly enriched (Figure 2D). Furthermore, the Kyoto Encyclopedia of Genes and Genomes (KEGG) pathway enrichment analysis was performed using the three-level PPI network proteins. As a result, the proteins were significantly enriched in cancer-associated pathways, which meant that the nine candidate proteins participated in cancer progress (Figure 2C).
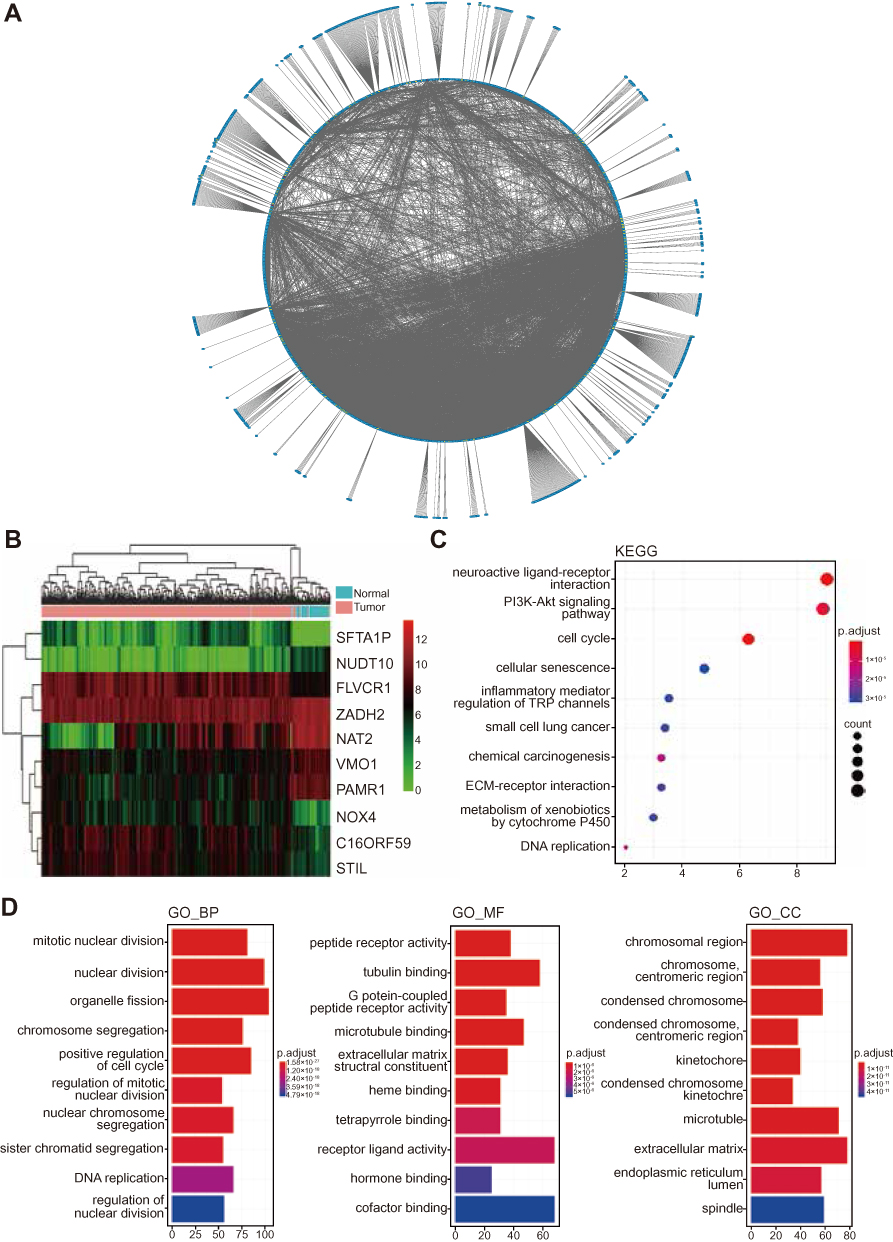 |
Figure 2 Association of the 10 candidate genes with tumor development. (A) Three-level protein–protein interaction network results. Red boxes represent the candidate genes, and yellow and blue boxes represent first- and second-order outcome-associated genes, respectively. The width of edges varies with their confidence. (B) A heat map depicting different expression levels of the 10 candidate genes in hepatocellular carcinoma tissues versus adjacent non-tumor tissues. Green represents low expression and red represents high expression. (C) KEGG pathway analysis. (D) GO enrichment analysis results. p<0.05 indicated statistical significance. |
Upregulated Expression Levels of NOX4 and FLVCR1 in HCC
As reported above, we predicted the possible upregulation of 10 genes in HCC tissue samples compared with adjacent normal tissue samples. To validate our prediction, we selected two representative genes, ie, NOX4 and FLVCR1, the expression of which has rarely been reported in liver (LO2) and HCC (BEL-7402, SMMC-7721, and HepG2) cells. In comparison with LO2 cells, HCC cells showed a marked increase in the protein expression levels of NOX4 and FLVCR1 (Figure 3A). Immunofluorescence assay was conducted to confirm the Western blotting results (Figure 3B). Immunohistochemistry (IHC) also revealed high expression levels of NOX4 and FLVCR1 in HCC tissues but weak expression levels in adjacent non-tumor tissues (Figure 4A). The expression levels of NOX4 and FLVCR1 in fresh tissue samples were also examined by Western blotting, which further confirmed that NOX4 and FLVCR1 expression levels in HCC tissues were higher (Figure 4B).
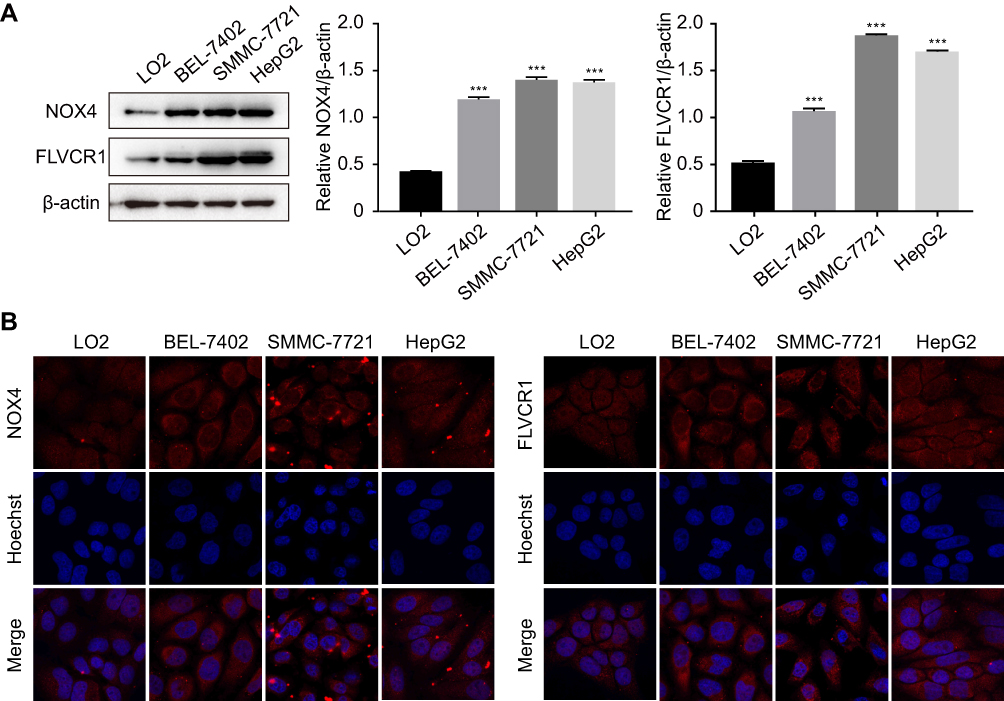 |
Figure 3 Upregulation of NOX4 and FLVCR1 in HCC cells. (A) Expression levels of NOX4 and FLVCR1 in normal liver cells (LO2) and HCC cells (BEL-7402, SMMC-7721, and HepG2), as determined by Western blotting. ***p<0.001 compared with LO2 cells. (B) Immunofluorescence assay of NOX4 and FLVCR1. NOX4 and FLVCR1 are labeled in red; the nucleus was stained with Hoechst (blue). |
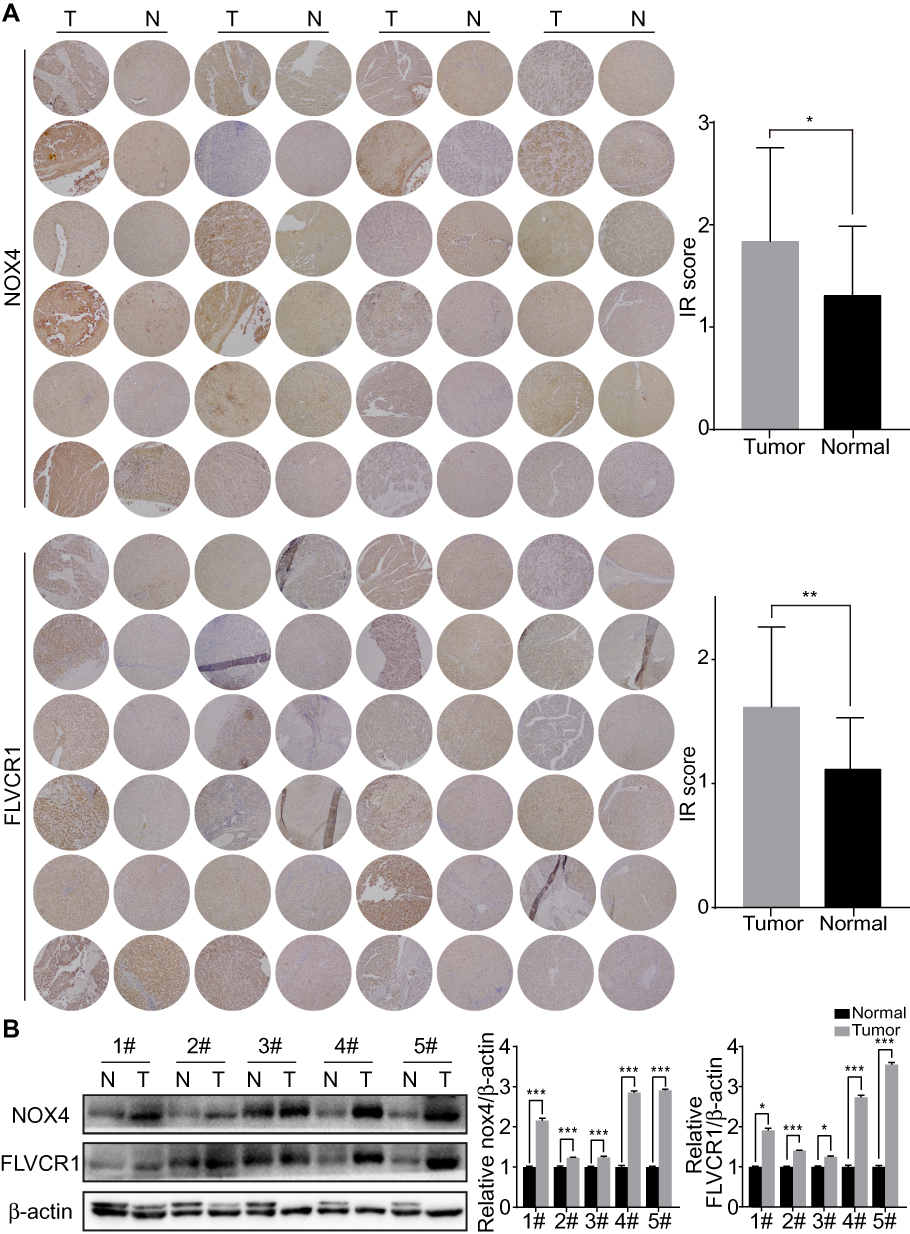 |
Figure 4 Upregulation of NOX4 and FLVCR1 in HCC tissues. (A) Expression levels of NOX4 and FLVCR1 in HCC tissues and adjacent non-tumor tissues, as evaluated using immunohistochemical staining (×100). Expression levels of both NOX4 and FLVCR1 were higher in HCC tissues than in adjacent non-tumor tissues. (B) Western blotting showing high expression levels of NOX4 and FLVCR1 in HCC tissues. *p<0.05, **p<0.01, ***p<0.001 (data compared to normal tissues). Number # indicated liver samples from different HCC patients. Abbreviations: T, tumor tissues; N, non-tumor tissues. |
High Expression Levels of NOX4 and FLVCR1 Associated with Lower Survival Rates
Next, we analyzed the clinical significance of NOX4 and FLVCR1 in patients with HCC. Kaplan–Meier analysis indicated patients with HCC that highly expressed NOX4 or FLVCR1 had relatively lower survival rates (a hazard ratio >1.5 for these patients; Figure 5), which implied these two genes, in addition to serving as biomarkers for HCC cells, may also be involved in tumor development and progression.
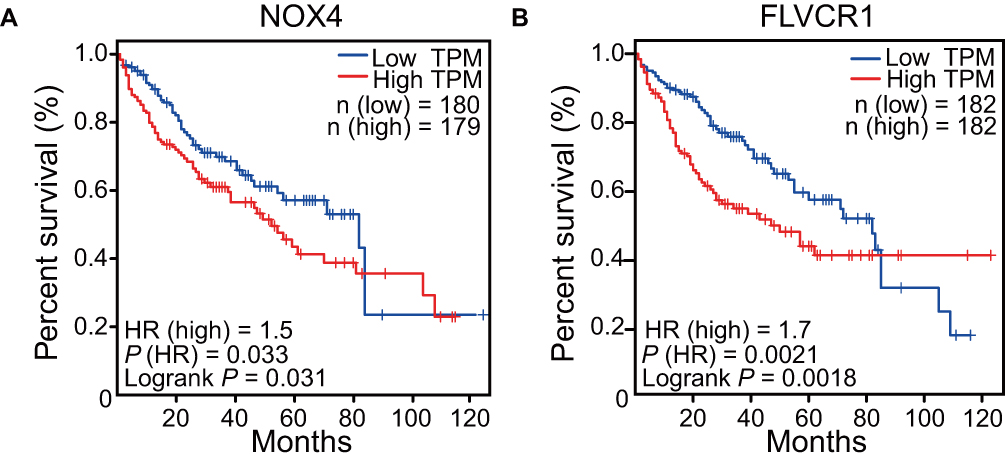 |
Figure 5 Survival analysis of NOX4 and FLVCR1. Kaplan–Meier analysis of the relationship between overall survival and expression levels of NOX4 (A) and FLVCR1 (B); Log-rank p< 0.05 indicated statistical significance. |
Discussion
Considering the increasing speed and reduced cost of the sequencing technology, a huge amount of transcriptomic data has been generated, facilitating the comprehensive elucidation of gene expression profiles at the transcriptional level in cancer cells. Researchers working on cancer-driven topics can now conveniently acquire transcriptomic data from TCGA to perform secondary analysis of gene expression via bioinformatic tools. However, the traditional approach, eg, analyzing differentially expressed genes, generally highlights non-specific biomarkers considering the involvement of complex interactions (Figure S1, Table S1). Herein we initially constructed a classifier to analyze the HCC RNA-Seq data obtained from the TCGA database and identified 10 genes with high significance in distinguishing HCC tissues from adjacent non-tumor tissues. The upregulation of NOX4 and FLVCR1 in HCC cell lines or clinical tumor tissues confirmed our prediction, illustrating that the RF classifier had an excellent performance. PPI network analyses indicated that the predicted genes were involved in complex tumor growth-related pathways, suggesting that they had a strong correlation with HCC development. Consistently, Kaplan–Meier analysis illustrated that patients with HCC with high expression levels of NOX4 or FLVCR1 had a lower survival rate, suggesting that the upregulation of these genes represents a poor prognosis for these patients. NOX4 and FLVCR1 may thus be involved in tumor development and progression in addition to serving as biomarkers for HCC cells.
We identified 10 candidate genes using the RF classifier through the integrated analysis of the TCGA database. Next, we determined the clinical significance of the 10 candidate genes in patients with HCC. As evident from the survival analysis, NOX4 and FLVCR1 showed better performance as biomarkers than the other eight candidate genes (Figure S2). Thus, we selected NOX4 and FLVCR1 to further examine their expression levels in HCC cells. Both HCC cell lines and tumor tissues showed the intracellular overproduction of NOX4 and FLVCR1, presenting them as potential biomarkers. To determine whether the predicted genes correlated with tumor development and progression, we constructed a three-level PPI network using the candidate genes as driver proteins that included first- and second-order outcome-associated proteins (Figure 2A). The vector illustration was shown in Figure S3. KEGG analysis showed that the proteins were involved in complex cell signal pathways associated with tumor growth and metastasis.19–21 This result suggested that the candidate genes can not only be regarded as biomarkers for HCC but also act as tumor-promoting factors, which may be potential therapeutic targets for HCC.
Consistent with our hypothesis, NOX4 as an oxidoreductase has been reported to catalyze ROS production by NADPH and promote prostate cancer and glioblastoma.22,23 Moreover, Roy et al elucidated the potential mechanisms of NOX4-related damage that contribute to the progression of solid malignancies; they reported that the over-expression of functional NOX4 in numerous tissues helps explain tissue injury and DNA damage due to ROS that accompanies pre-malignant conditions.24 Although FLVCR1 encoding a ubiquitous heme exporter is reportedly associated with leukemia,25,26 the relationship between FLVCR1 and HCC has not been reported as yet. In synovial sarcoma, FLVCR1 was demonstrated to promote the proliferation and tumorigenicity through inhibiting apoptosis and autophagy.27 Similarly, as apparent from the results of our study, FLVCR1 may be an HCC tumor-promoting factor, which reveals a potential diagnostic and therapeutic target for HCC.
Conclusions
Herein we identify two potential biomarkers for HCC, namely NOX4 and FLVCR1, which may unravel novel diagnostic and therapeutic opportunities.
Acknowledgments
This work was supported by the Medical Scientific Research Foundation of Guangdong Province (Grant No. A2019428) and the “Climbing Plan” Guangdong University Students Science and Technology Innovation Cultivation Special Fund (Grant No. pdjha0112).
Disclosure
The authors report no conflicts of interest in this work.
References
1. Torre LA, Bray F, Siegel RL, et al. Global cancer statistics, 2012. CA Cancer J Clin. 2015;65(2):87–108.
2. Costentin C. [Hepatocellular carcinoma surveillance]. Presse Med. 2017;46(4):381–385. doi:10.1016/j.lpm.2016.11.006
3. Xu K, Watanabe-Galloway S, Rochling FA, et al. Practice, knowledge, and barriers for screening of hepatocellular carcinoma among high-risk chinese patients. Ann Glob Health. 2017;83(2):281–292. doi:10.1016/j.aogh.2017.02.002
4. Lee YJ, Lee JM, Lee JS, et al. Hepatocellular carcinoma: diagnostic performance of multidetector CT and MR imaging-a systematic review and meta-analysis. Radiology. 2015;275(1):97–109. doi:10.1148/radiol.14140690
5. Nayak A, Baidya Kayal E, Arya M, et al. Computer-aided diagnosis of cirrhosis and hepatocellular carcinoma using multi-phase abdomen CT. Int J Comput Assist Radiol Surg. 2019;14:1341–1352. doi:10.1007/s11548-019-01991-5
6. Burrel M, Llovet JM, Ayuso C, et al. MRI angiography is superior to helical CT for detection of HCC prior to liver transplantation: an explant correlation. Hepatology. 2003;38(4):1034–1042. doi:10.1002/(ISSN)1527-3350
7. Reuter JA, Spacek DV, Snyder MP. High-throughput sequencing technologies. Mol Cell. 2015;58(4):586–597. doi:10.1016/j.molcel.2015.05.004
8. Schmidt D, Wilson MD, Spyrou C, et al. ChIP-seq: using high-throughput sequencing to discover protein-DNA interactions. Methods. 2009;48(3):240–248. doi:10.1016/j.ymeth.2009.03.001
9. Coravos A, Khozin S, Mandl KD. Developing and adopting safe and effective digital biomarkers to improve patient outcomes. NPJ Digit Med. 2019;2(1). doi:10.1038/s41746-019-0113-1
10. Te Beest DE, Mes SW, Wilting SM, et al. Improved high-dimensional prediction with random forests by the use of co-data. BMC Bioinformatics. 2017;18(1):584. doi:10.1186/s12859-017-1993-1
11. Cutler DR, Edwards TC
12. Ozcift A. Random forests ensemble classifier trained with data resampling strategy to improve cardiac arrhythmia diagnosis. Comput Biol Med. 2011;41(5):265–271. doi:10.1016/j.compbiomed.2011.03.001
13. Tabib S, Larocque D. Non-parametric individual treatment effect estimation for survival data with random forests. Bioinformatics. 2019. doi:10.1093/bioinformatics/btz602
14. Szklarczyk D, Franceschini A, Wyder S, et al. STRING v10: protein-protein interaction networks, integrated over the tree of life. Nucleic Acids Res. 2015;43(Database issue):D447–52. doi:10.1093/nar/gku1003
15. Assenov Y, Ramirez F, Schelhorn SE, et al. Computing topological parameters of biological networks. Bioinformatics. 2008;24(2):282–284. doi:10.1093/bioinformatics/btm554
16. Vandeputte DA, Troost D, Leenstra S, et al. Expression and distribution of id helix-loop-helix proteins in human astrocytic tumors. Glia. 2002;38(4):329–338. doi:10.1002/glia.10076
17. Sheridan RP, Wang WM, Liaw A, et al. Extreme gradient boosting as a method for quantitative structure-activity relationships. J Chem Inf Model. 2016;56(12):2353–2360. doi:10.1021/acs.jcim.6b00591
18. Janitza S, Strobl C, Boulesteix AL. An AUC-based permutation variable importance measure for random forests. BMC Bioinformatics. 2013;14:119. doi:10.1186/1471-2105-14-119
19. Wang SS, Chen YH, Chen N, et al. Hydrogen sulfide promotes autophagy of hepatocellular carcinoma cells through the PI3K/Akt/mTOR signaling pathway. Cell Death Dis. 2017;8(3):e2688. doi:10.1038/cddis.2017.18
20. Gong S, Xu D, Zou F, et al. (-)-Curine induces cell cycle arrest and cell death in hepatocellular carcinoma cells in a p53-independent way. Biomed Pharmacother. 2017;89:894–901. doi:10.1016/j.biopha.2017.01.148
21. Xie XW, Wang XY, Liao WJ, et al. Effect of upregulated DNA replication and sister chromatid cohesion 1 expression on proliferation and prognosis in hepatocellular carcinoma. Chin Med J (Engl). 2018;131(23):2827–2835. doi:10.4103/0366-6999.246076
22. Meitzler JL, Makhlouf HR, Antony S, et al. Decoding NADPH oxidase 4 expression in human tumors. Redox Biol. 2017;13:182–195. doi:10.1016/j.redox.2017.05.016
23. Hsieh CH, Wu CP, Lee HT, et al. NADPH oxidase subunit 4 mediates cycling hypoxia-promoted radiation resistance in glioblastoma multiforme. Free Radic Biol Med. 2012;53(4):649–658. doi:10.1016/j.freeradbiomed.2012.06.009
24. Roy K, Wu Y, Meitzler JL, et al. NADPH oxidases and cancer. Clin Sci (Lond). 2015;128(12):863–875. doi:10.1042/CS20140542
25. Khan AA, Quigley JG. Heme and FLVCR-related transporter families SLC48 and SLC49. Mol Aspects Med. 2013;34(2–3):669–682. doi:10.1016/j.mam.2012.07.013
26. Brown JK, Fung C, Tailor CS. Comprehensive mapping of receptor-functioning domains in feline leukemia virus subgroup C receptor FLVCR1. J Virol. 2006;80(4):1742–1751. doi:10.1128/JVI.80.4.1742-1751.2006
27. Peng C, Song Y, Chen W, et al. FLVCR1 promotes the proliferation and tumorigenicity of synovial sarcoma through inhibiting apoptosis and autophagy. Int J Oncol. 2018. doi:10.3892/ijo
 © 2020 The Author(s). This work is published and licensed by Dove Medical Press Limited. The full terms of this license are available at https://www.dovepress.com/terms.php and incorporate the Creative Commons Attribution - Non Commercial (unported, v3.0) License.
By accessing the work you hereby accept the Terms. Non-commercial uses of the work are permitted without any further permission from Dove Medical Press Limited, provided the work is properly attributed. For permission for commercial use of this work, please see paragraphs 4.2 and 5 of our Terms.
© 2020 The Author(s). This work is published and licensed by Dove Medical Press Limited. The full terms of this license are available at https://www.dovepress.com/terms.php and incorporate the Creative Commons Attribution - Non Commercial (unported, v3.0) License.
By accessing the work you hereby accept the Terms. Non-commercial uses of the work are permitted without any further permission from Dove Medical Press Limited, provided the work is properly attributed. For permission for commercial use of this work, please see paragraphs 4.2 and 5 of our Terms.