")
Back to Journals » International Journal of General Medicine » Volume 15
SCNN1A Overexpression Correlates with Poor Prognosis and Immune Infiltrates in Ovarian Cancer
Authors Lou J , Wei L , Wang H
Received 14 December 2021
Accepted for publication 3 February 2022
Published 18 February 2022 Volume 2022:15 Pages 1743—1763
DOI https://doi.org/10.2147/IJGM.S351976
Checked for plagiarism Yes
Review by Single anonymous peer review
Peer reviewer comments 2
Editor who approved publication: Dr Scott Fraser
Jiayan Lou, Lingjia Wei, He Wang
Department of Gynecology and Oncology, Guangxi Medical University Cancer Hospital, Nanning, Guangxi, People’s Republic of China
Correspondence: He Wang, Department of Gynecology and Oncology, Guangxi Medical University Cancer Hospital, 71 He Di Road, Nanning, Guangxi, 530021, People’s Republic of China, Tel +86 13481138393, Email [email protected]
Introduction: Ovarian cancer (OV) is a common malignancy affecting women globally; recognizing useful biomarkers has been one of the key priorities. Since SCNN1A was reported to be relevant to tumor progression in a variety of cancers, but rarely in ovarian cancer, we explored the roles of SCNN1A in OV.
Methods: RNA sequencing data from TCGA and GEO were utilized to analyze the expression of SCNN1A and related differentially expressed genes (DEGs) in ovarian cancer. We performed GO, GSEA and immune cell infiltration analysis on SCNN1A-associated DEGs. Correlation of SCNN1A methylation levels and its mRNA expression was analyzed by cBioPortal and UCSC Xena databases. To assess the prognostic impact of SCNN1A, Kaplan–Meier plot analysis and Cox regression analysis were performed; ROC curves and nomogram were also plotted.
Results: Compared to normal tissues, SCNN1A was highly expressed in ovarian cancer. The methylation level of SCNN1A negatively correlated with the SCNN1A expression. Moreover, high expression of SCNN1A was correlated with poor prognosis in OV patients and associated with immune infiltrates.
Conclusion: High SCNN1A expression could be a promising biomarker for poor outcomes in OV and correlated with tumor immune cells infiltration. The findings might help illuminate the function of SCNN1A in tumorigenesis and lay a foundation for further research.
Keywords: ovarian cancer, SCNN1A, biological function, prognostic biomarker, immune infiltrates
Introduction
Ovarian cancer (OV) is one of the main causes of death from gynecologic malignancies faced by women. It represents around 295,414 new cases and 184,799 deaths worldwide each year.1 The most common type of ovarian cancer is epithelial ovarian cancer (EOC), which accounts for approximately 80–90% of OV cases. The mortality of OV is largely attributed to the difficulties in early detection and treatment resistance. Although the best first-line treatment includes debulking surgery and platinum-paclitaxel chemotherapy, maintenance treatment with poly ADP-ribose polymerase (PARP) inhibitors, bevacizumab, and drugs targeting homologous recombination deficiency, the majority of patients with advanced ovarian cancer will ultimately relapse.2,3 Despite advances in OV treatment, long-term prognosis has remained poor, with a 5-year survival rate approximately 47%.4 Therefore, new prognostic predictors and better therapeutic targets are urgently needed for ovarian cancer patients.
The epithelial sodium channel (ENaC) is an ion channel famous for its function in Na+ reabsorption in epithelia, which comprises the following three subunits: SCNN1A, SCNN1B, and SCNN1G.5 Of these proteins, SCNN1A expression levels are the highest. In addition, a study confirmed that DNA methylation patterns correlate with SCNN1A expression.6 Briefly, their relationship is either high SCNN1A expression level/low DNA methylation or low-SCNN1A expression level/high DNA methylation. Recently, new functions about ENaC have been reported, including the underlying roles in tumor. Previous researches have proved that dysregulated SCNN1A expression is significantly correlated with the progression of multiple cancer types, including neuroblastoma,7 pulmonary neuroendocrine tumors,8 pancreatic cancer,9 and osteosarcoma.10 A recent paper from Ware et al indicated that SCNN1A expression is correlated with inferior prognosis in breast cancer and can regulate the proliferation of breast cancer cells.11 Moreover, some findings suggested that SCNN1A overexpression can promote cell proliferation, migration and predict unfavorable prognosis in ovarian cancer by modulating epithelial-to-mesenchymal transition (EMT).12 Nonetheless, its functions in cancer has not been widely studied, with few related researches on SCNN1A in ovarian cancer. To this end, it is worth in-depth research the potential function and the prognostic value of SCNN1A in OV.
In our study, TCGA, GEO, GEPIA, HPA, and Kaplan–Meier plotter websites were utilized to analyze SCNN1A expression and its association with prognosis. Additionally, we investigated the molecular mechanisms of SCNN1A dysregulation, including DNA methylation, copy number variation, and somatic cell mutations in cBioPortal and UCSC Xena database. Moreover, we established a nomogram to forecast the patients’ prognosis. In order to understand the biological function of SCNN1A in the pathogenesis of OV, differential expression gene (DEG) analysis, gene ontology (GO) enrichment analysis and GSEA analysis were carried out. Additionally, TIMER and GEPIA websites were utilized to probe into the relationship between SCNN1A and infiltrating immune cells and their correlated gene marker sets. Our study indicates that SCNN1A may serve as a biomarker of adverse prognosis and immune cells’ infiltration in OV.
Materials and Methods
TCGA Datasets
TCGA (https://genome-cancer.ucsc.edu/) is currently the world’s largest database of cancer genetic information, providing clinical and pathological information on 33 types of cancer. TCGA opens the era of molecular biology of tumors and precision medicine, and the database is free and open to researchers for cancer-related research.
The GEO Database
The GEO database contains high-throughput gene expression data uploaded by research institutions all over the world and is one of the most comprehensive public gene expression data resources (https://www.ncbi.nlm.nih.gov/geo/). In our study, we downloaded the gene expression profile microarray datasets GSE26712, GSE12470 and GSE27651 containing ovarian cancer tissues and normal tissues.
Gene Expression Profiling Interactive Analysis (GEPIA)
The GEPIA website, developed by Peking University, integrates TCGA and GTEx datasets to analyze gene expression in various tumor and normal samples (http://gepia.cancer-pku.cn/index.html).13 In this study, expression analysis of SCNN1A was assessed by TCGA-OV datasets. The relationship between SCNN1A expression and various immune cell markers was also studied in GEPIA.
The Human Protein Atlas (HPA) Database
The HPA (http://www.proteinatlas.org/) offers information about human gene expression profiles at the protein level in normal and tumor tissues.14 In this study, we explored HPA website to validate the SCNN1A protein expression between normal ovarian tissue and ovarian cancer tissue through immunohistochemical staining by antibody HPA012743.
DEGs Between SCNN1A-High and -Low Expression OV Cohorts
DEGs between SCNN1A-high and SCNN1A-low OV patients from TCGA dataset were recognized using unpaired Student’s t-test by DESeq2 (3.8) package.15 The genes with statistical significance should meet the following conditions: P < 0.05 and |log2 Fold change| > 1. All the DEGs were displayed in the volcano plot.
SCNN1A-Interacting Genes and Proteins Analysis
We utilized GeneMANIA (http://www.genemania.org) to build the SCNN1A gene interaction network. The STRING website (https://string-db.org/) is an online searchable database of protein interactions. It is easy to operate and powerful in visualization. The protein–protein interaction (PPI) network of SCNN1A was constructed via STRING.16
cBioPortal
The cBioPortal for Cancer Genomics includes a sizable cancer genomics dataset with visualization, download, and analysis functions.17 We selected 3 ovarian cancer datasets with 1680 patients for further study. The genomic alteration types and alteration frequency of SCNN1A in ovarian cancer were measured by “OncoPrint” mode and “Cancer Types Summary” mode. Besides, the relationship between SCNN1A methylation level and SCNN1A gene expression was performed in “Plots” module. And the OS of SCNN1A was analyzed by the “Comparison/Survival” mode.
UCSC Xena
UCSC Xena, a cancer genomics data analysis platform, offers the visualization and analysis of multiple omics data from cancer samples (http://xena.ucsc.edu/). The website integrates some large public datasets, such as TCGA, ICGC, TARGET, GTEx, CCL, etc.18 This database allows the analysis of gene expression, protein expression, gene methylation, copy number variation, and somatic mutations.
Gene Ontology (GO) Enrichment Analysis
Metascape is a vehicle for gene annotation and pathway analysis (http://metascape.org).19 In the present study, Metascape was utilized as a tool to identify the enrichment process and pathway of SCNN1A-related DEGs. To obtain statistically significant differences, the threshold conditions included: P < 0.01, a minimum count of 3, and enrichment factor >1.5.
Gene Set Enrichment Analysis (GSEA)
GSEA was carried out by R package ClusteProfiler (3.6.3) to clarify the functional and pathway differences between the high- and low- SCNN1A expression cohorts.20 The MsigDB database of GSEA website was utilized to obtain the data set of “c2.cp.v7.2.symbols.gmt”. The number of analysis permutations was set to 1000, and the significant enrichment gene sets should meet the following conditions: adjusted P-values <0.05 and FDR q-values <0.25.
Kaplan-Meier Plotter Database Analysis
Kaplan–Meier Plotter website (http://kmplot.com), an online database containing gene expression data and survival information of 1657 clinical ovarian cancer cases, was utilized to evaluate the prognostic value of SCNN1A in ovarian cancer. OV patients were divided into two groups (high- and low-SCNN1A group) according to median expression and analyzed for overall survival (OS) and progression-free survival (PFS) with hazard ratio (HR) and Log rank p-value.
TIMER Database Analysis
TIMER software is a program for the analysis of immune cell infiltration in a wide range of cancers (https://cistrome.shinyapps.io/timer/).21 We initially used this website to measure differences in SCNN1A expression levels in OV and then evaluated the relationship between the SCNN1A expression status and the grade of infiltration by particular immune cell subsets. Finally, we evaluated how SCNN1A expression associated with the expression of particular immune infiltrating cell subset markers.
Immune Infiltration Analysis by Single-Sample GSEA (ssGSEA)
Immune infiltration analysis of OV specimens was achieved using ssGSEA by the GSVA package22 in R for 24 types of immune cells. Additionally, the relationship between SCNN1A expression and immune cell infiltration was assessed using Spearman test, and the infiltration level of immune cells was compared for high- and low-SCNN1A expression cohorts through Wilcoxon rank sum test.
Statistical Analysis
All statistical analysis and plots were applied by R Version 3.6.3 and R package ggplot2 was used to visualize expression differences. Kaplan–Meier plots and GEPIA outcomes were presented with HR and P or Cox P-value by a Log rank test. Besides, the correlation of gene expression was estimated using Spearman test. P-value <0.05 was regarded statistically significant. The ROC curve was created to assess the diagnostic performance of SCNN1A expression by pROC package.
Results
SCNN1A Was Upregulated in OV
Firstly, we evaluated the expression levels of SCNN1A in pan-cancer data from TCGA and GTEx. Analysis showed that SCNN1A was highly expressed in 13 tumors, including BRCA, CESC, CHOL, COAD, ESCA, KICH, LAML, LUAD, OV, PAAD, READ, THYM, and UCEC. In contrast, its expression was low in ACC, HNSC, KIRC, KIRP, LIHC, LUSC, PRAD, SKCM, and THCA (Figure 1A). Using GEPIA website, we identified that SCNN1A mRNA expression was significantly elevated in ovarian cancer (p-value <0.01, |Log2FC| > 1) (Figure 1B) and there was a strong association between SCNN1A mRNA levels and inferior OS (p-value <0.002, Figure 1C).
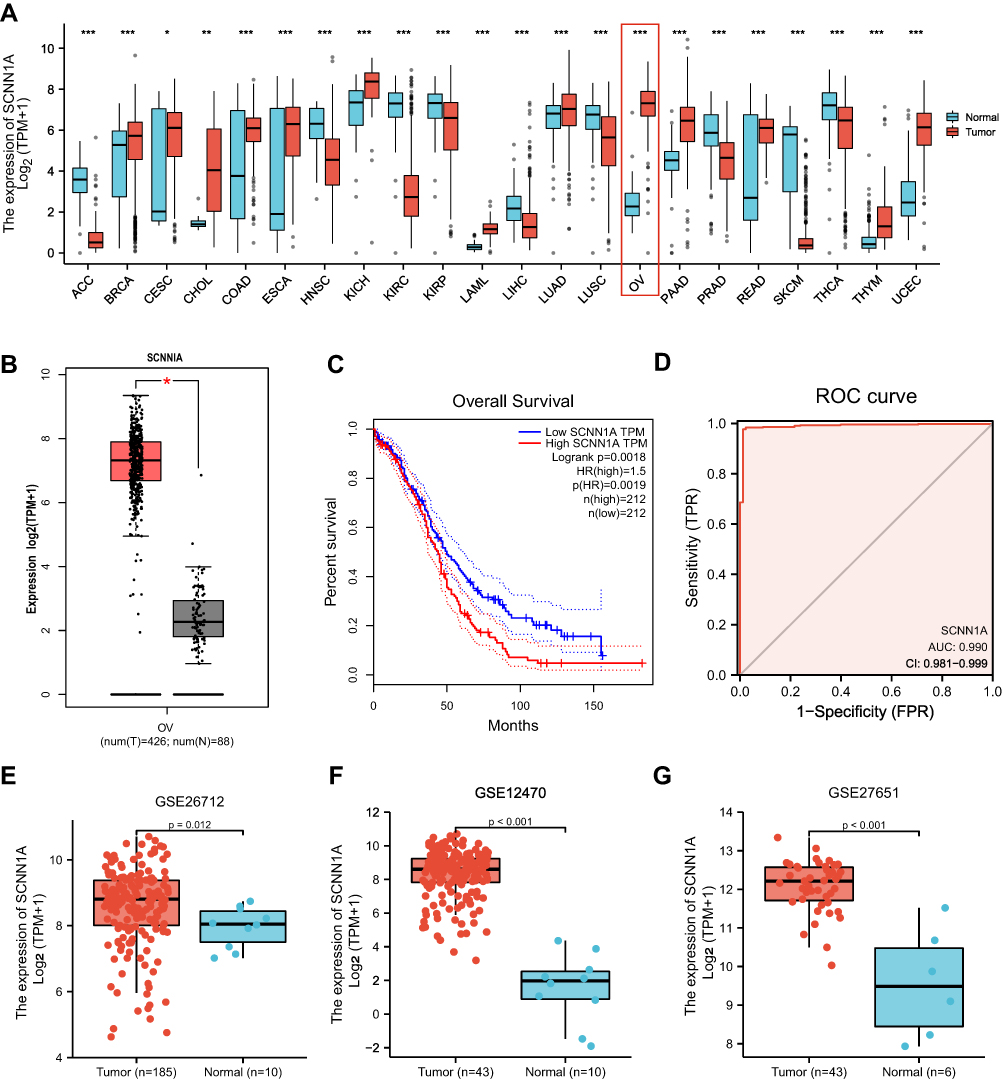 |
Figure 1 The expression of SCNN1A in ovarian cancer. (A) The mRNA expression of SCNN1A in pan-cancer from TCGA datasets. (B) Increased expression of SCNN1A in ovarian cancer. (C) Kaplan–Meier analysis of overall survival in GEPIA. (D) ROC curve analysis assessing the performance of SCNN1A for OV diagnosis. (E–G) SCNN1A expression in tumor and normal tissues in ovarian cancer from GSE26712, GSE12470 and GSE27651 (*P < 0.05, **P < 0.01, ***P < 0.001). Abbreviations: ACC, adrenocortical carcinoma; BRCA, breast invasive carcinoma; CESC, Cervical squamous cell carcinoma and endocervical adenocarcinoma; CHOL, cholangiocarcinoma; COAD, colon adenocarcinoma; ESCA, esophageal carcinoma; HNSC, head and neck squamous cell carcinoma; KICH, kidney chromophobe; KIRC, kidney renal clear cell carcinoma; KIRP, kidney renal papillary cell carcinoma; LAML, acute myeloid leukemia; LIHC, liver hepatocellular carcinoma; LUAD, lung adenocarcinoma; LUSC, lung squamous cell carcinoma; OV, ovarian serous cystadenocarcinoma; PAAD, pancreatic adenocarcinoma; PRAD, prostate adenocarcinoma; READ, rectum adenocarcinoma; SKCM, skin cutaneous melanoma; THCA, thyroid carcinoma; THYM, thymoma; UCEC, uterine corpus endometrial carcinoma. |
Secondly, ROC curve was utilized to assess the diagnostic capability of SCNN1A between OV and normal ovary tissue. And the area under the curve (AUC) of SCNN1A was 0.990 (95% CI: 0.981–0.999), indicating that SCNN1A may be a potentially moderate identification molecule for OV (Figure 1D). In addition, we validated the SCNN1A expression level in OV using three GEO datasets (GSE26712, GSE12470 and GSE27651) and found that SCNN1A mRNA level was all remarkably higher in OV tissue compared to normal ovarian tissue (Figure 1E–G). Immunohistochemical staining from HPA also showed that SCNN1A protein was increased in ovarian cancer tissues, as presented in Figure 2A and B. In brief, the above results suggested that both mRNA and protein level of SCNN1A were up-regulated in ovarian cancer.
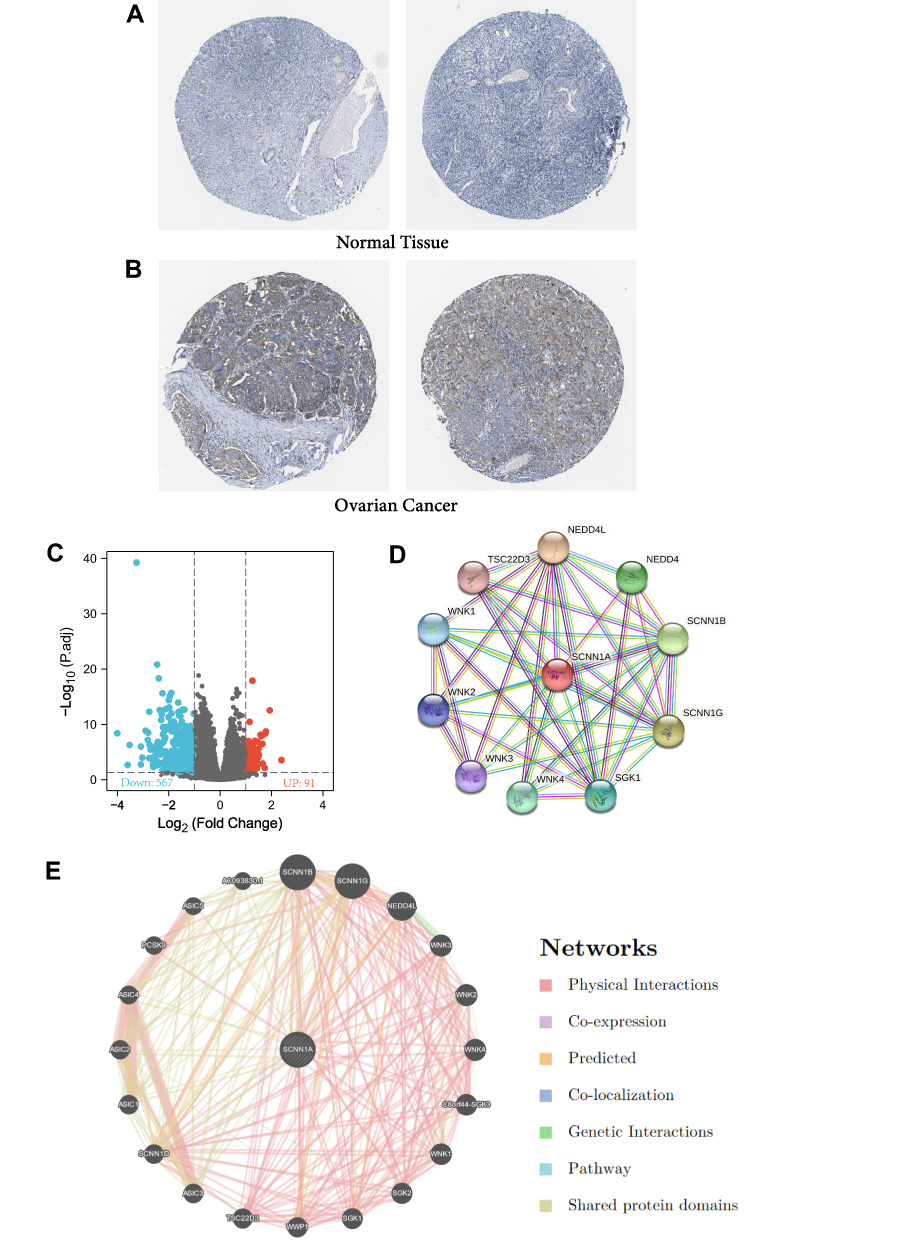 |
Figure 2 The protein expression of SCNN1A in ovarian cancer, SCNN1A-related differentially expressed genes (DEGs) and SCNN1A-correlated proteins and genes. (A and B) The protein levels of SCNN1A in normal ovarian tissue and OV based on Human Protein Atlas. (C) Volcano plot of DEGs between the high- and low-SCNN1A expression groups. (D) The protein–protein interaction network of SCNN1A via STRING. (E) The gene–gene interaction network of SCNN1A via GeneMania. |
Functional Enrichment Analysis of High- and Low-SCNN1A Expression Samples
Identification of DEGs in OV
In order to identify the underlying mechanisms of SCNN1A promoting tumor, we analyzed DEGs in the high- and low-SCNN1A expression cohorts. A total of 658 DEGs were identified, involving 91 up-regulated genes and 567 down-regulated genes. And the expression of DEGs was presented in a volcano plot (Figure 2C).
Identifying SCNN1A-Interacting Genes and Proteins
We explored STRING website to generate the protein–protein interaction (PPI) network of SCNN1A (Figure 2D). There were 42 edges and 11 nodes, involving NEDD4L, SCNN1G, SCNN1B, NEDD4, and SGK1 (Figure 2D). We built a gene–gene interaction network between SCNN1A and the neighboring genes via GeneMania. And the outcome revealed that 20 genes were closely related to SCNN1A, including SCNN1B, SCNN1G, NEDD4L, WNK3, and WNK2 (Figure 2E).
Association Between SCNN1A Mutation, Hypomethylation, and Prognosis in OV
cBioPortal was employed to analyse the expression and mutation of SCNN1A in OV. We analyzed genetic alteration in SCNN1A and its relationship with the survival of OV patients. The mutation rate of SCNN1A gene was high in OV patients (Figure 3A). Of the 1680 OV patients, 131 had genetic alterations, with a mutation rate of 8%. We also found that majority of the alterations of SCNN1A in ovarian cancer patients are gene amplifications. In addition, the result revealed that genetic alteration in SCNN1A was correlated with lower OS of OV patients (Figure 3B). The findings suggested that the genetic mutation of SCNN1A gene can influence OV patients’ prognosis. Additionally, we explored the association between SCNN1A gene expression and gene methylation, and the outcome indicated that SCNN1A expression was strongly negatively associated with gene methylation (R = − 0.39, P < 0.001) in OV (Figure 3C).
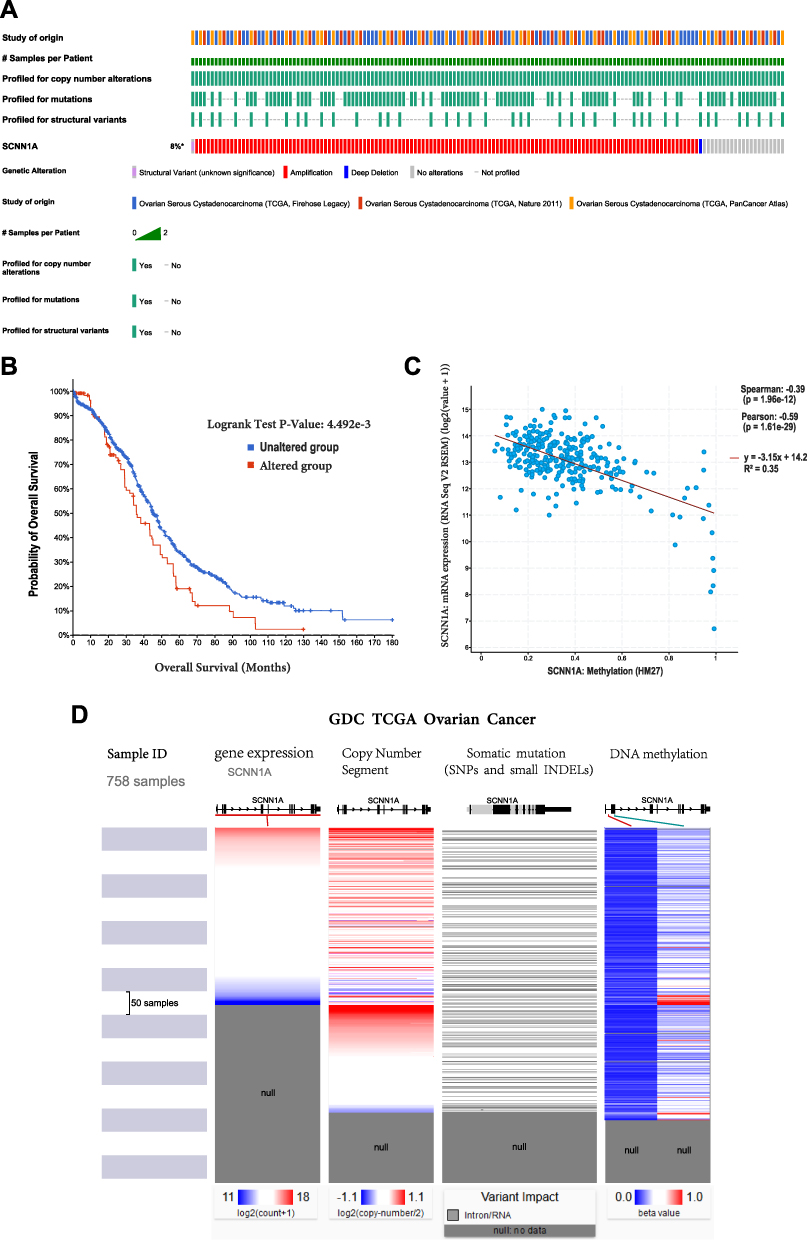 |
Figure 3 The gene alteration and methylation of SCNN1A in OV. (A and B) Genetic alteration in SCNN1A and its correlation with OS of OV patients. (C) The relationship between SCNN1A methylation and its expression level. (D) Mutation, CNV, and methylation analysis of SCNN1A in OV via UCSC Xena. |
Mutation, Copy Number Variation, and Methylation of SCNN1A
SCNN1A expression was remarkably increased in OV. We explored the reasons of increased SCNN1A levels. As is known to all, DNA methylation, gene mutation, and copy number variation are closely related to genetic and epigenetic regulation and are highly relevant to tumorigenic process. We validated the DNA methylation, gene mutation, CNV status of SCNN1A in OV through UCSC Xena. The results revealed that the level of SCNN1A mRNA was related to CNV, somatic mutation and DNA methylation in OV (Figure 3D). Consequently, we considered that CNV, somatic mutation and DNA methylation might facilitate the elevated level of SCNN1A in OV.
Functional Enrichment of SCNN1A Related DEGs in OV
To assess the function of SCNN1A-related DEGs in OV patients, we used “Metascape” software. As shown in Figures 4A–C, we found that several pathways associated with SCNN1A were enriched, involving metabolic process, immune system process, and cellular process (GO: 0008152, GO: 0002376, GO: 0009987).
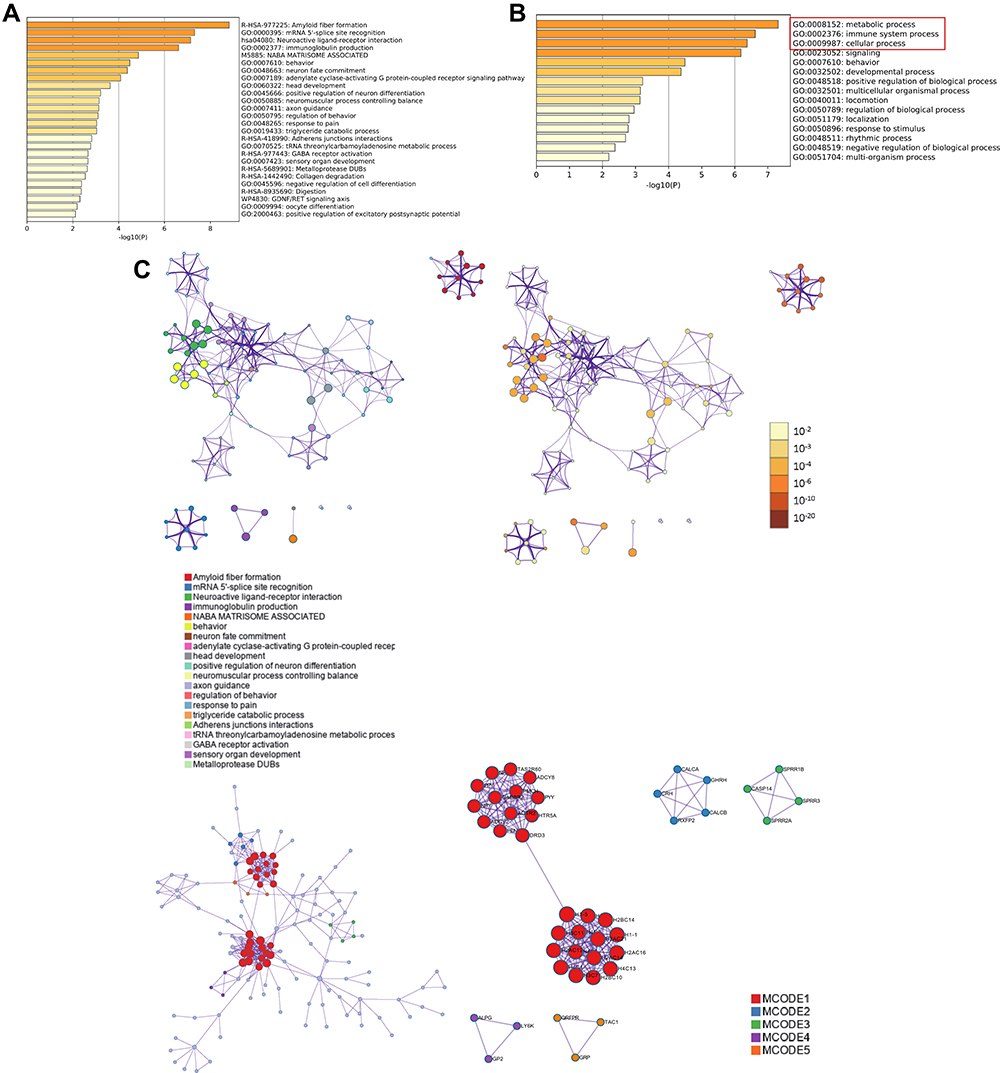 |
Figure 4 Functional enrichment analysis of differentially expressed genes (DEGs) in ovarian cancer patients with distinct SCNN1A levels via Metascape database. (A and B) The gene ontology (GO)-enriched terms colored according to P-values. (C) Network of GO-enriched terms colored according to clusters and P-values. |
GSEA Identifies SCNN1A-Related Signaling Pathways
In order to recognize SCNN1A-associated signaling pathways in OV, GSEA analysis was carried out between SCNN1A-high and -low expression cohorts to identify significant differences (adjusted P < 0.05, FDR q value <0.25) in enrichment of MSigDB Collection (C2.all.v7.0.symbols.gmt). And the most significant pathways were M phase, cell cycle checkpoints, cellular senescence, epigenetic regulation of gene expression, signaling by nuclear receptors, and transcriptional regulation by RUNX1 (Figure 5A–F).
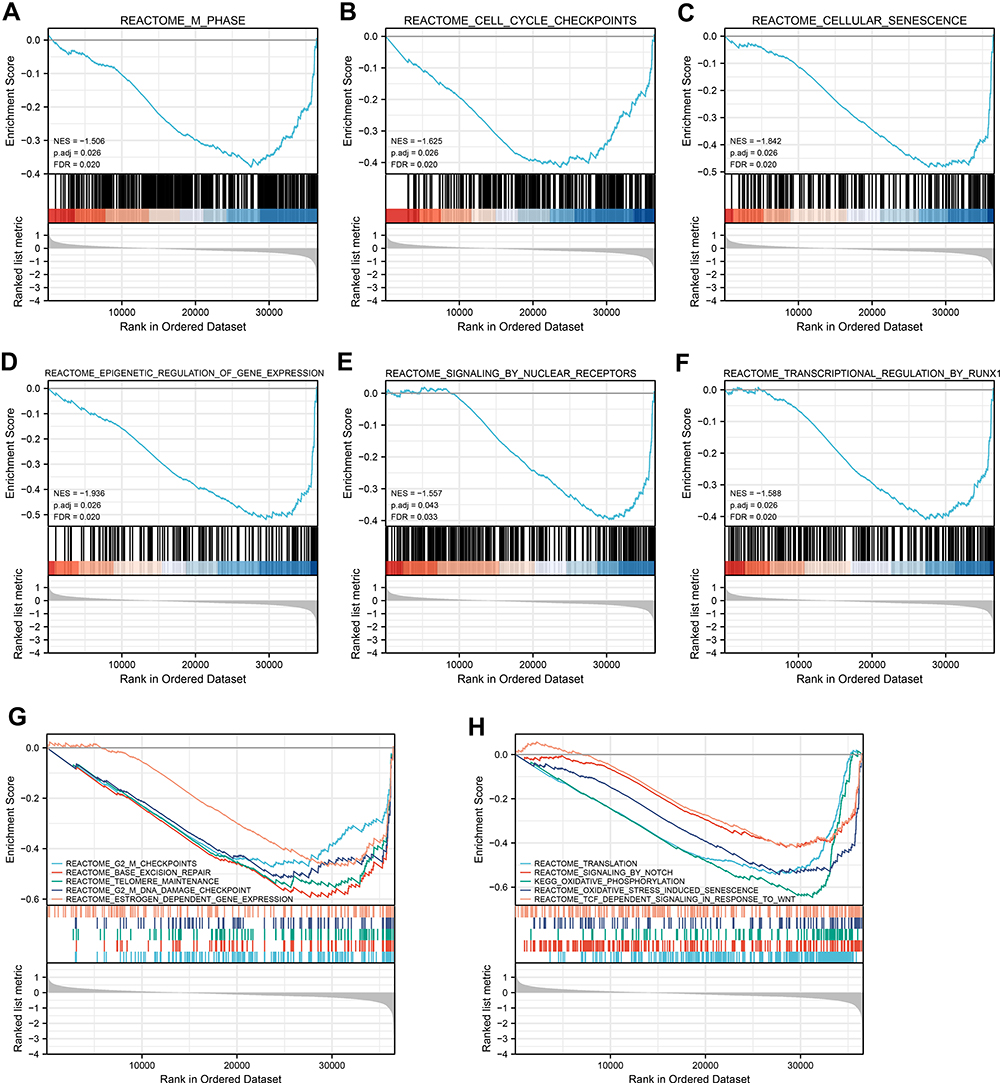 |
Figure 5 Enrichment graphs from GSEA. Some signaling pathways were differentially enriched in OV patients upon high- and low-SCNN1A expression. (A) M Phase. (B) Cell cycle checkpoints. (C) Cellular senescence. (D) Epigenetic regulation of gene expression. (E) Signaling by nuclear receptors. (F) Transcriptional regulation by RUNX1. (G) G2 M checkpoints, base excision repair, telomere maintenance, estrogen dependent gene expression. (H) Translation, signaling by notch, oxidative stress induced senescence, TCFdependent signaling in response to Wnt. Abbreviations: ES, enrichment score; NES, normalized enrichment score; ADJ p-Val, adjusted P-value; FDR, false discovery rate. |
Association of SCNN1A Expression and Clinicopathological Characteristics in Ovarian Cancer Patients
Clinical characteristics and gene expression data of 379 patients with ovarian cancer were gathered from TCGA database. The main clinical characteristics included age, race, FIGO stage, primary therapy outcome, histologic stage, anatomic neoplasm subdivision, venous invasion, lymphatic invasion, tumor residual, and tumor status. According to the mean value of SCNN1A level, OV patients were separated into high- and low-SCNN1A expression cohorts (Table 1).
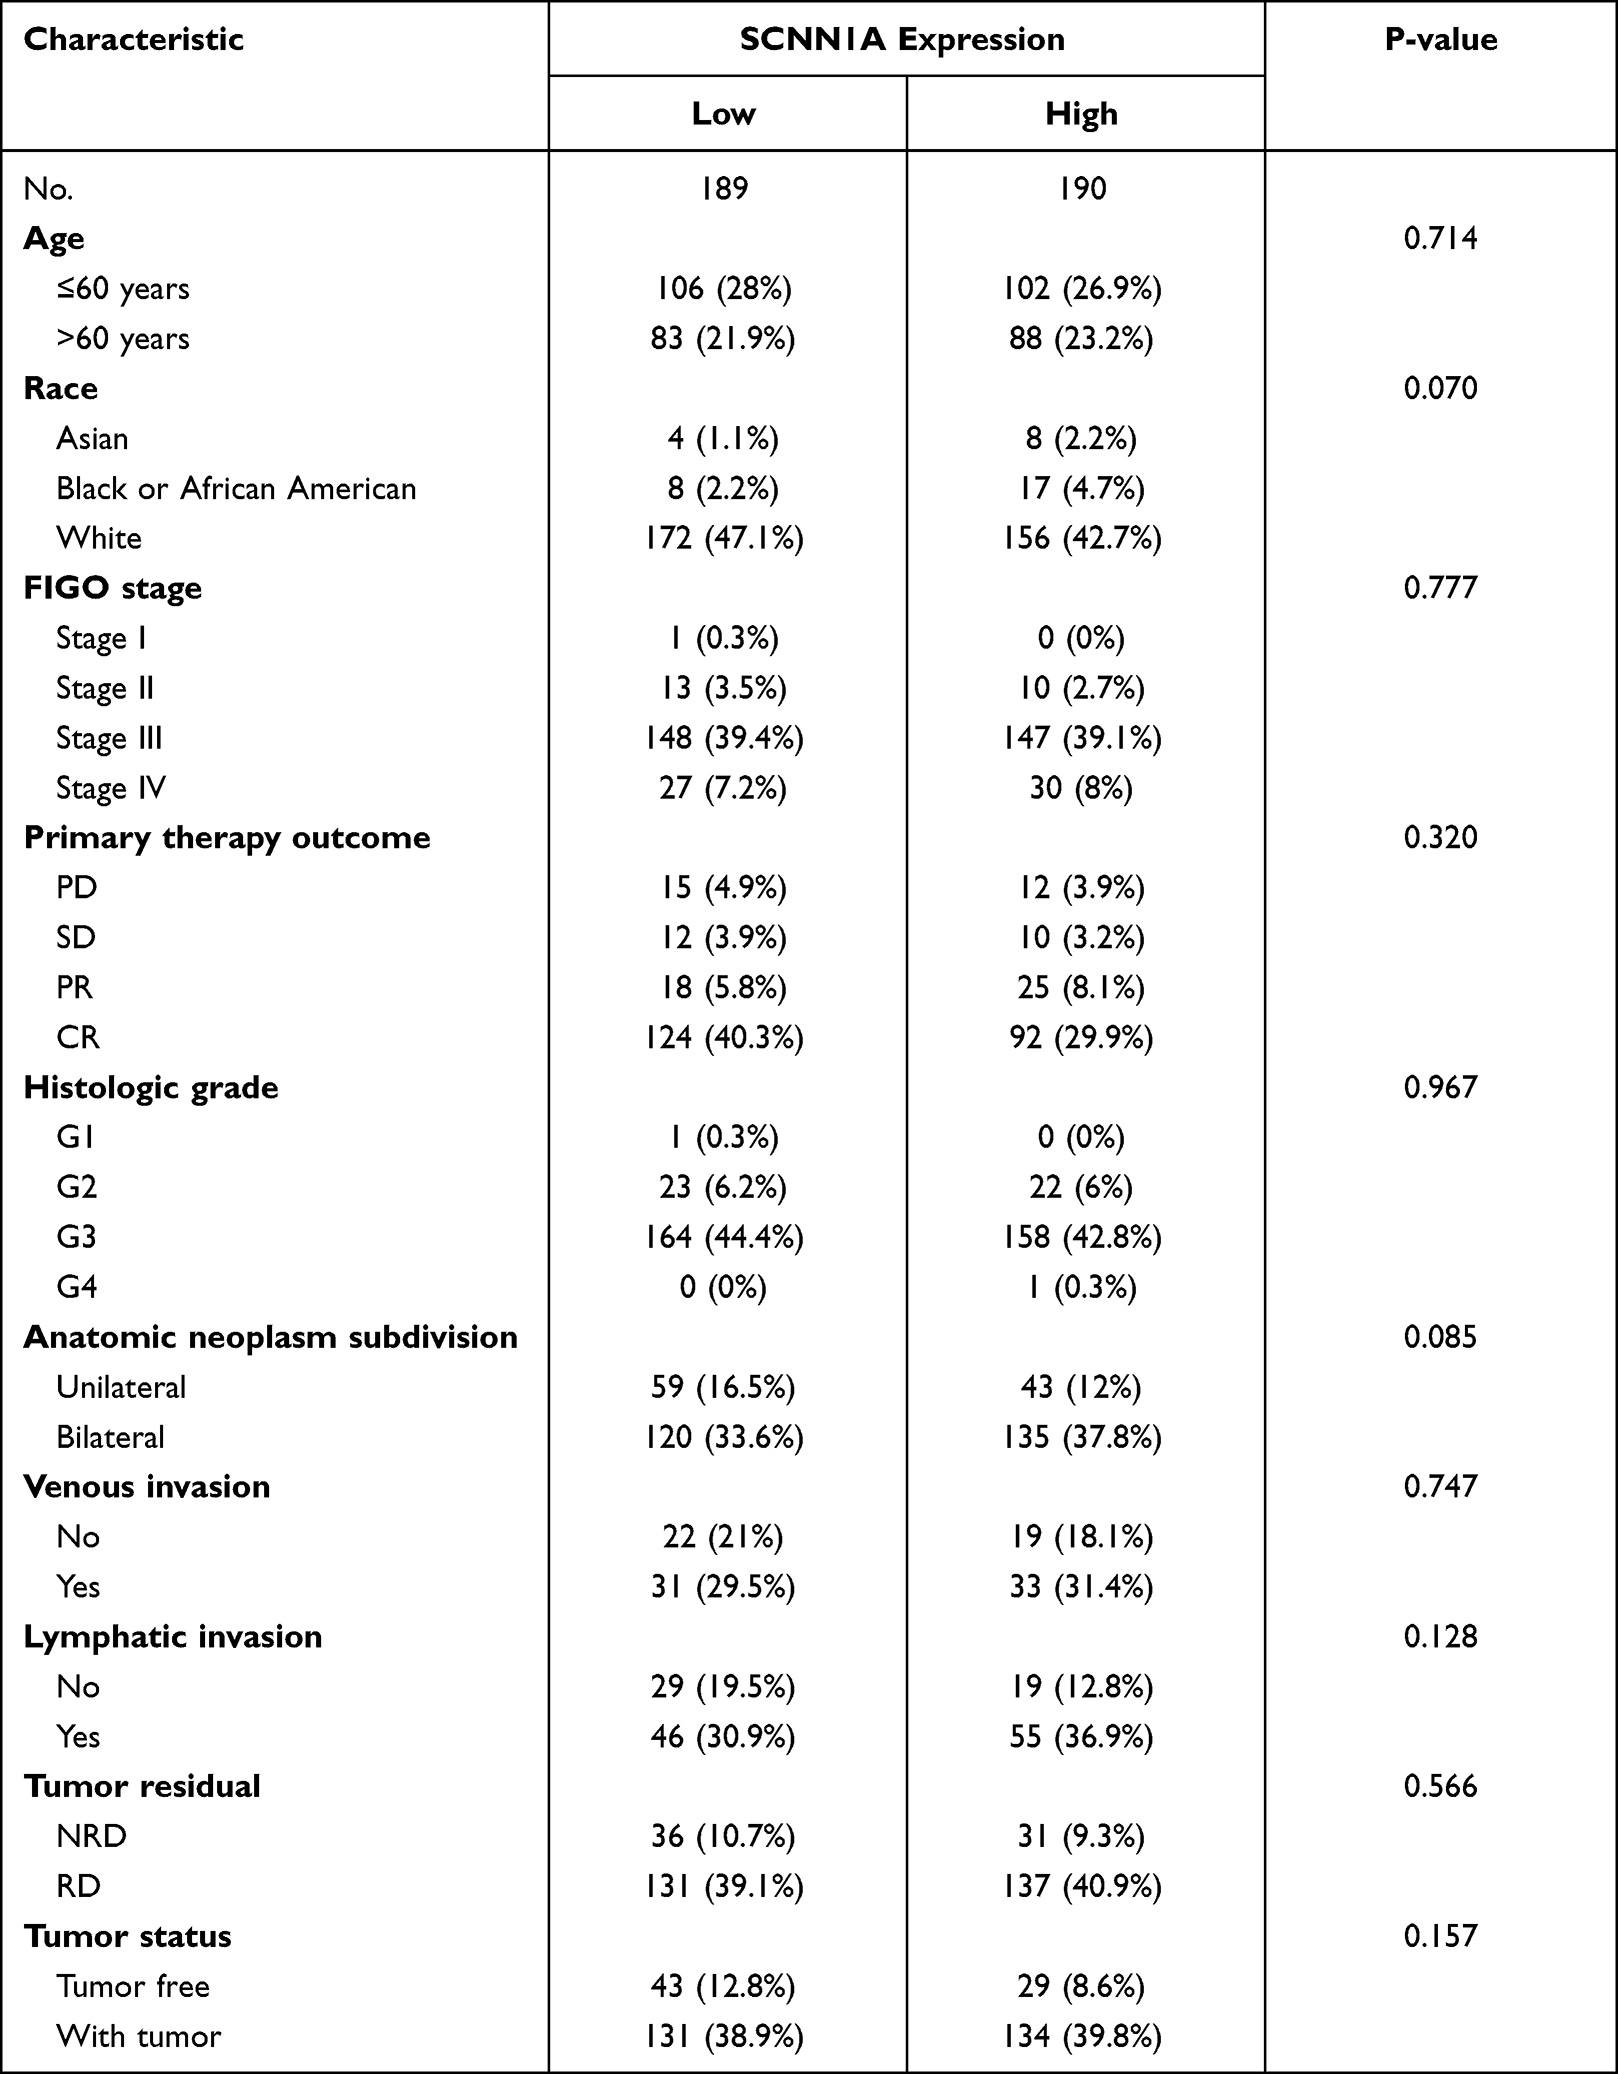 |
Table 1 Clinical Characteristics of the Ovarian Cancer Patients (TCGA) |
Effect of High SCNN1A Expression on Prognosis of OV Patients with Different Clinicopathological Status
To better comprehend the correlation and mechanisms of SCNN1A expression in OV, we performed univariate Cox analysis to study the relationship between SCNN1A expression and clinical characteristics in OV (Figure 6). The result revealed that higher SCNN1A expression was related to a shorter OS (HR: 1.585; 95% CI: 1.221–2.057; P < 0.001). Other clinicopathologic factors associated with low overall survival included age (>60), primary therapy outcome (PD&SD&PR), tumor residual (RD) and tumor status (with tumor). And the clinicopathologic variables that associated with inferior disease-specific survival (DSS) consisted race, primary therapy outcome (PD&SD&PR), and tumor residual (with tumor).
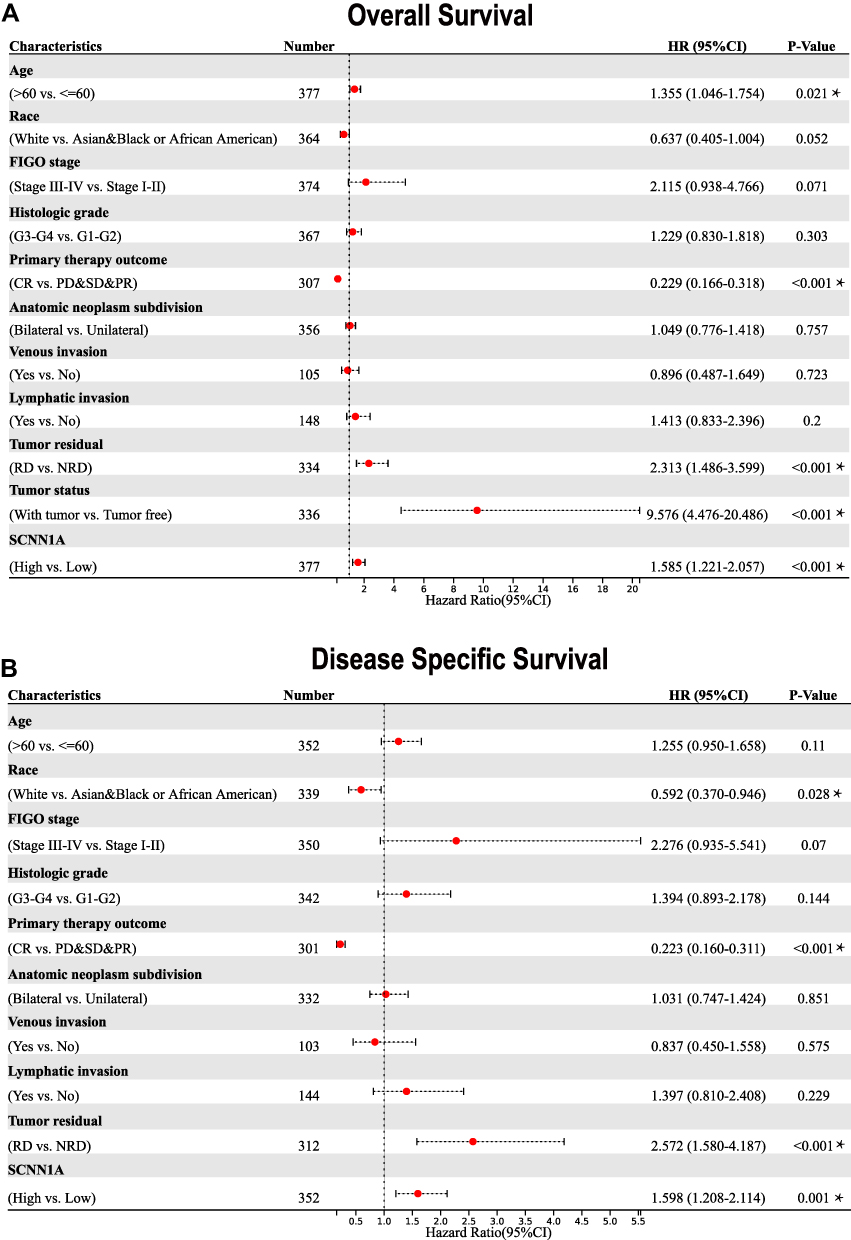 |
Figure 6 Forest plots of the univariate Cox regression analysis for OV patients in TCGA. (A) Overall survival. (B) Disease-specific survival. *P < 0.05. |
Prognostic Performance of SCNN1A in the Ovarian Cancer Clinicopathological Subgroups
Subsequently, we tried to ascertain the predictive value of SCNN1A for clinical outcomes in a few clinicopathological subgroups. Cox regression analysis was performed in specific subgroups. As presented in the forest diagram (Figure 7A), SCNN1A was a strong risk factor for OS in patients of age ≤60 years (HR = 1.75, P = 0.003), FIGO stage III–IV (HR = 1.57, P = 0.001), histologic stage G3-G4 (HR = 1.59, P = 0.001), anatomic neoplasm subdivision (bilateral) (HR = 1.45, P = 0.02), and tumor status (with tumor) (HR = 1.36, P = 0.032). Moreover, similar observations occurred for disease-specific survival (Figure 7B). Kaplan–Meier survival curves of high- and low- SCNN1A expression in different subgroups of ovarian cancer patients can be seen in Supplementary Figure 1.
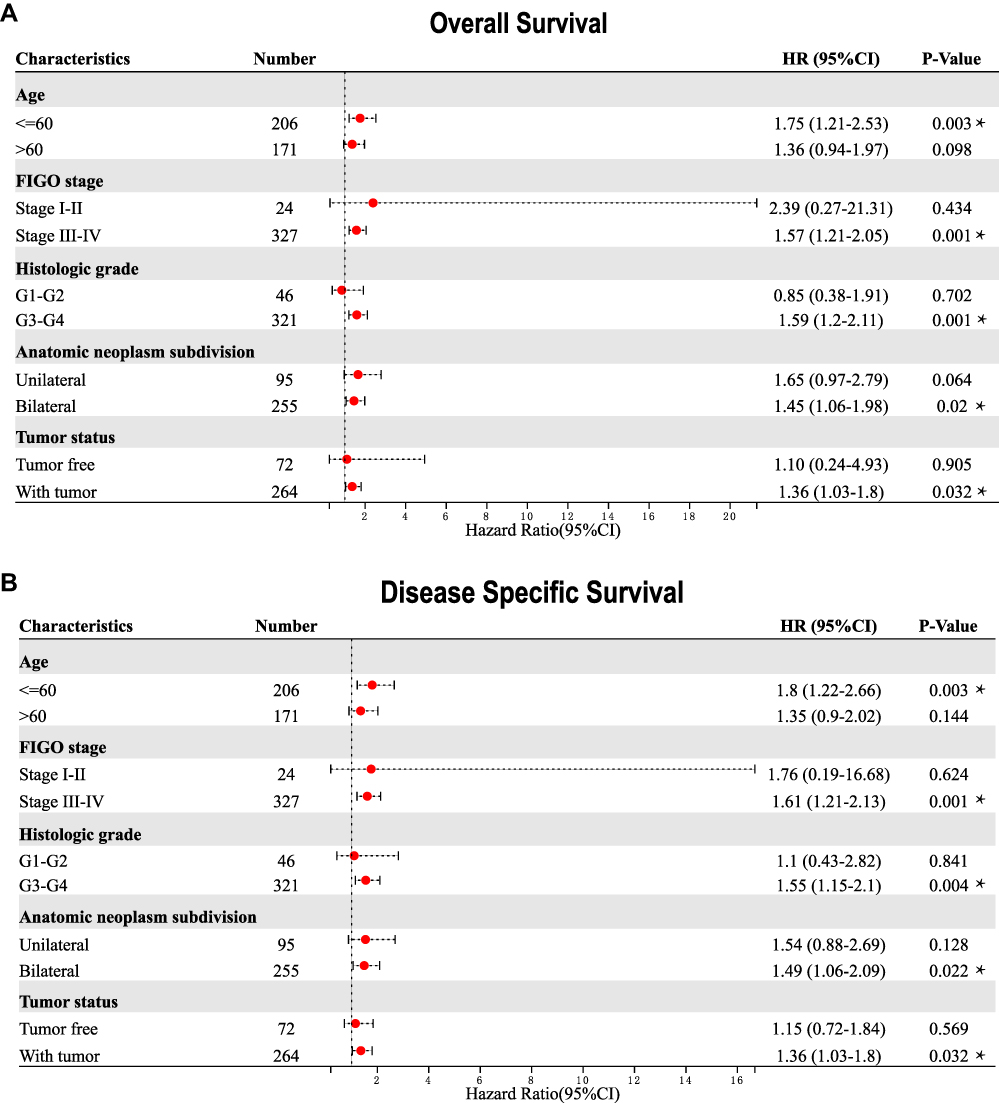 |
Figure 7 Correlation of SCNN1A mRNA expression level and prognosis in OV patients with different clinicopathological factors. (A) Overall survival. (B) Disease-specific survival. *P < 0.05. |
Construction of a Prognostic Model Based on SCNN1A and Clinical Variables
Moreover, we validated the prognostic value of SCNN1A expression in ovarian cancer by Kaplan–Meier plotter website. High SCNN1A level was related to poorer prognosis in OV (OS: HR=1.15, P = 0.037; PFS: HR=1.34, P =1.1e-05) (Figure 8A and B). Then, a prognostic nomogram was built based on the statistically significant prognostic factors in Cox regression analysis, and we plotted the calibration curves to check on the validity of the nomogram. FIGO stage, primary therapy outcome, tumor status, as well as SCNN1A, were involved in the nomogram to forecast overall survival (Figure 8C). A higher point on the nomogram meant a worse prognostic factor. We explored the prediction efficiency of this nomogram, and the outcome showed that the C-index of this model was 0.712 (CI: 0.693–0.732), indicating the prediction efficiency of this nomogram was moderately precise. Calibration curves of 3 and 5 years showed a satisfactory performance for our constructed nomogram (Figure 8D and E). In conclusion, the nomogram can be a better model for forecasting survival of OV patients compared to single prognostic factors.
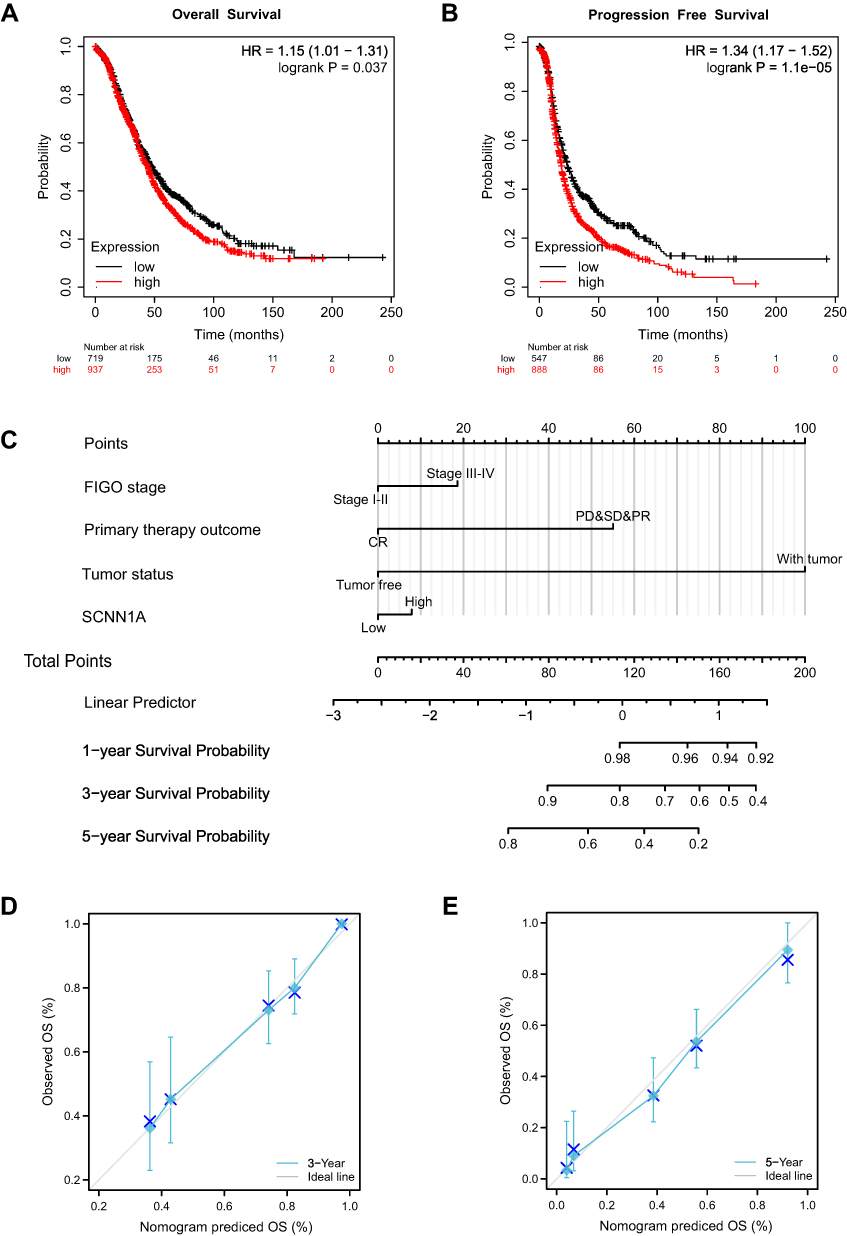 |
Figure 8 Survival curve assessing the prognostic value of SCNN1A and an SCNN1A expression-based nomogram. (A and B) Survival curves of OS and PFS. (C) Nomogram of 1-, 3-, and 5-year overall survival for OV patients. (D and E) Calibration plots of the nomogram for predicting the OS likelihood. |
Prognostic Analysis of SCNN1A Expression Based on Immune Cells in OV Patients
Because the expression of SCNN1A is significantly associated with immune system process and inferior prognosis in OV, we examined whether SCNN1A level influenced the survival of OV due to immune infiltration. We conducted Kaplan–Meier plotter analysis of SCNN1A expression in OV by basophils, B cells, CD4+ memory T cells, CD8+ T cells, eosinophils, macrophages, mesenchymal stem cells, NK T cells, Treg T cells, Th1 cells, Th2 cells. As presented in Figure 9A and B, ovarian cancer patients with high level of SCNN1A had a low survival in most of the subgroups. The above results indicate that SCNN1A might influence the survival of OV patients in part through immune infiltration.
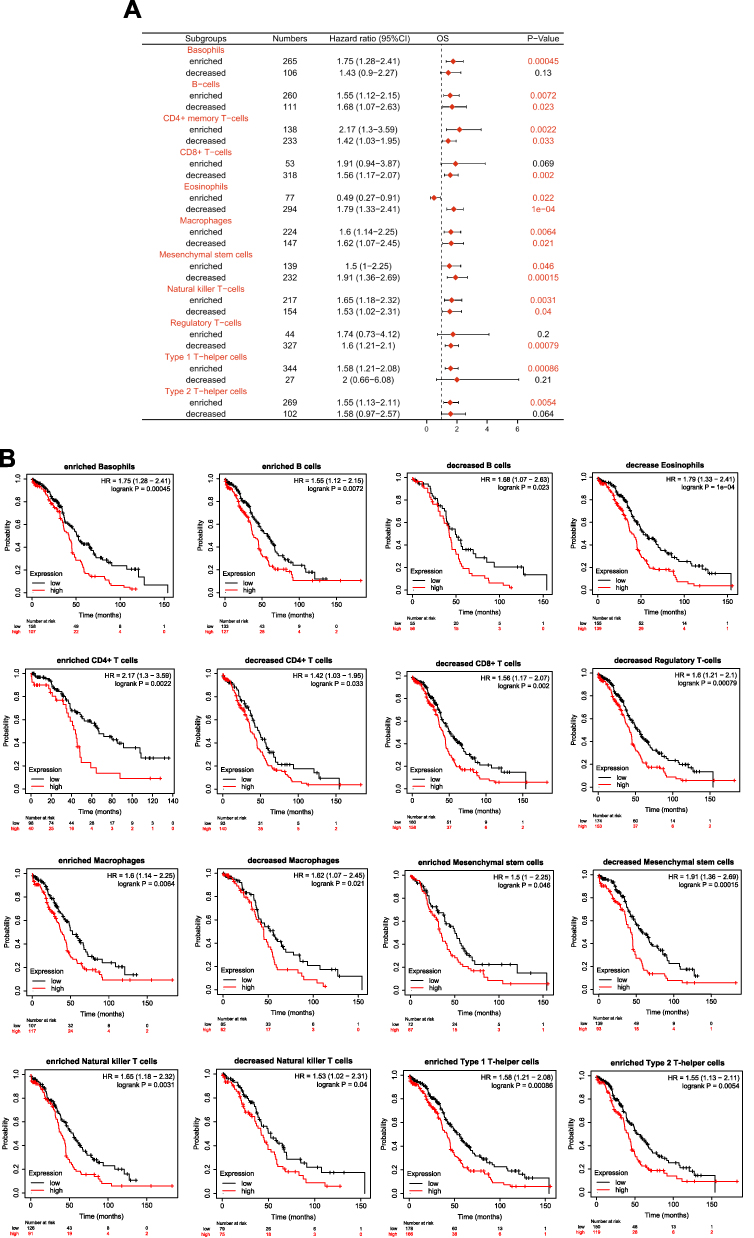 |
Figure 9 Kaplan-Meier survival curves according to high and low level of SCNN1A in different immune cell subgroups in OV patients. (A) The forest plot reveals the prognostic value of SCNN1A level based on various immune cell subgroups. (B) Association between SCNN1A expression and OS in various immune cell subgroups. |
The Correlation Between SCNN1A Expression and Immune Infiltration
Since that both GO and prognostic analysis revealed that SCNN1A might be involved in tumor immune process, we performed ssGSEA to explore the association between the SCNN1A mRNA expression and the infiltration level of 24 immune cells. The relationship between immune cells infiltration and the SCNN1A mRNA expression is presented in Figure 10. The outcome suggested that SCNN1A mRNA expression was closely linked to the infiltration of Tcm cells (R = 0.240, P < 0.001), Th17 cells (R = 0.160, P = 0.002), Tem cells (R = 0.150, P = 0.004), NK cells (R = 0.110, P = 0.035) and Eosinophils (R = 0.120, P = 0.025). ssGSEA also displayed a negative correlation between SCNN1A expression and Th2 cells’ infiltration (R = −0.170, P = 0.001).
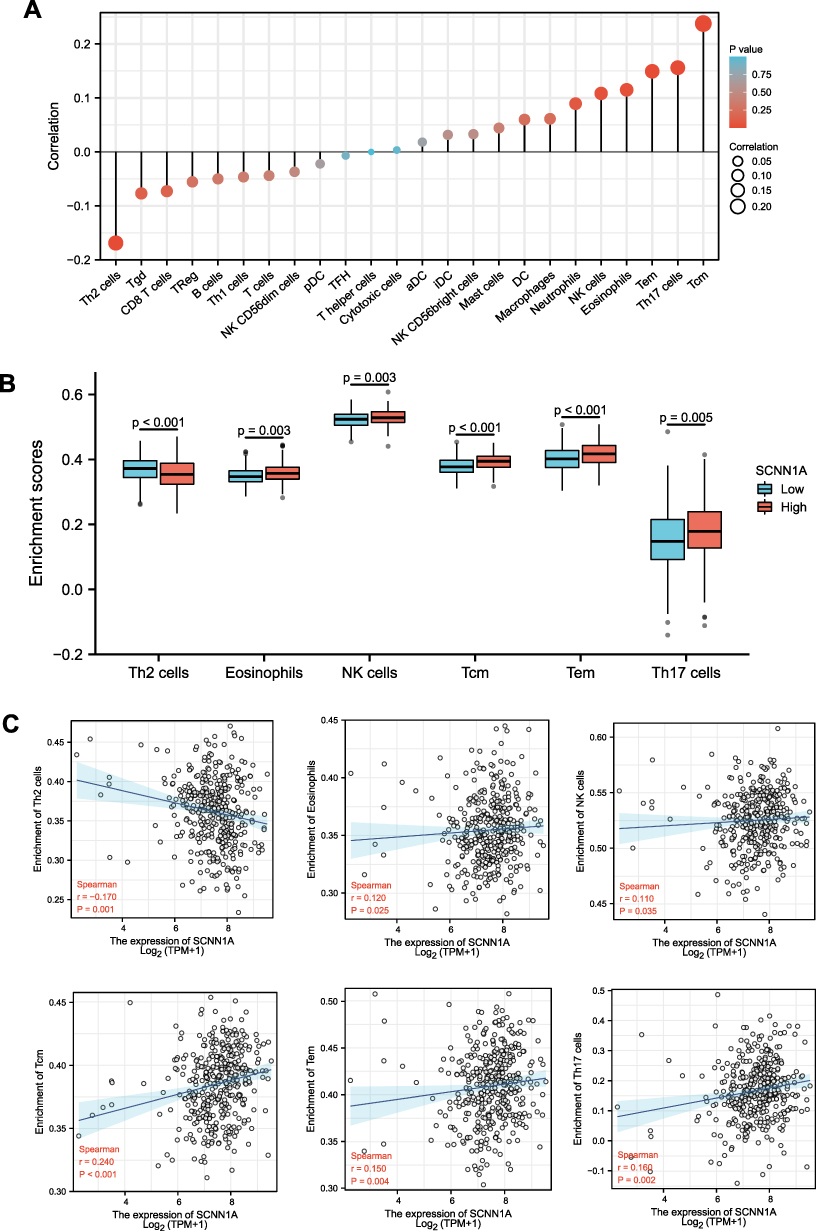 |
Figure 10 Association of immune cell infiltration and SCNN1A expression in OV patients. (A) Relationships among infiltration levels of 24 immune cell types and SCNN1A expression. (B and C) Box plots and correlation diagrams displaying the difference of Th2 cells, eosinophils, NK cells, Tcm, Tem, Th17 cells infiltration level between SCNN1A-high and -low cohorts. Abbreviations: Th, T helper cells; Th2 cells, type 2 Th cells; Tgd, T gamma delta; TReg, regulatory T cells; Th1 cells, type 1 Th cells; pDC, plasmacytoid DCs; TFH, T follicular helper; aDC, activated DC; iDC, immature DC; DC, dendritic cell; NK cells, natural killer cells; Tem, T effector memory; Th17 cells, type 17 Th cells; Tcm, T central memory. |
Relationships Between SCNN1A Expression and Immune Markers
The association between SCNN1A expression and tumor-infiltrating immune cell gene marker levels in OV tissues was evaluated through TIMER. The outcome revealed that the SCNN1A level in OV tissues related to immune markers of monocytes, M1 Macrophage, M2 Macrophage, T cell (general), TAM, Tfh, Th2, Th17, and neutrophil cells (Table 2 and Supplementary Figure 2). Furthermore, we evaluated the association between SCNN1A expression and these markers in OV by GEPIA, which revealed similar relationship between SCNN1A and markers of monocytes, neutrophils, TAMs, Th1, Th2, Treg, and T cell exhaustion to those in TIMER (Table 3 and Supplementary Figure 3). Thus, these results support our conjecture that SCNN1A expression in OV is related to immune cell infiltration in various ways, which helps to interpret the differences in patients’ survival.
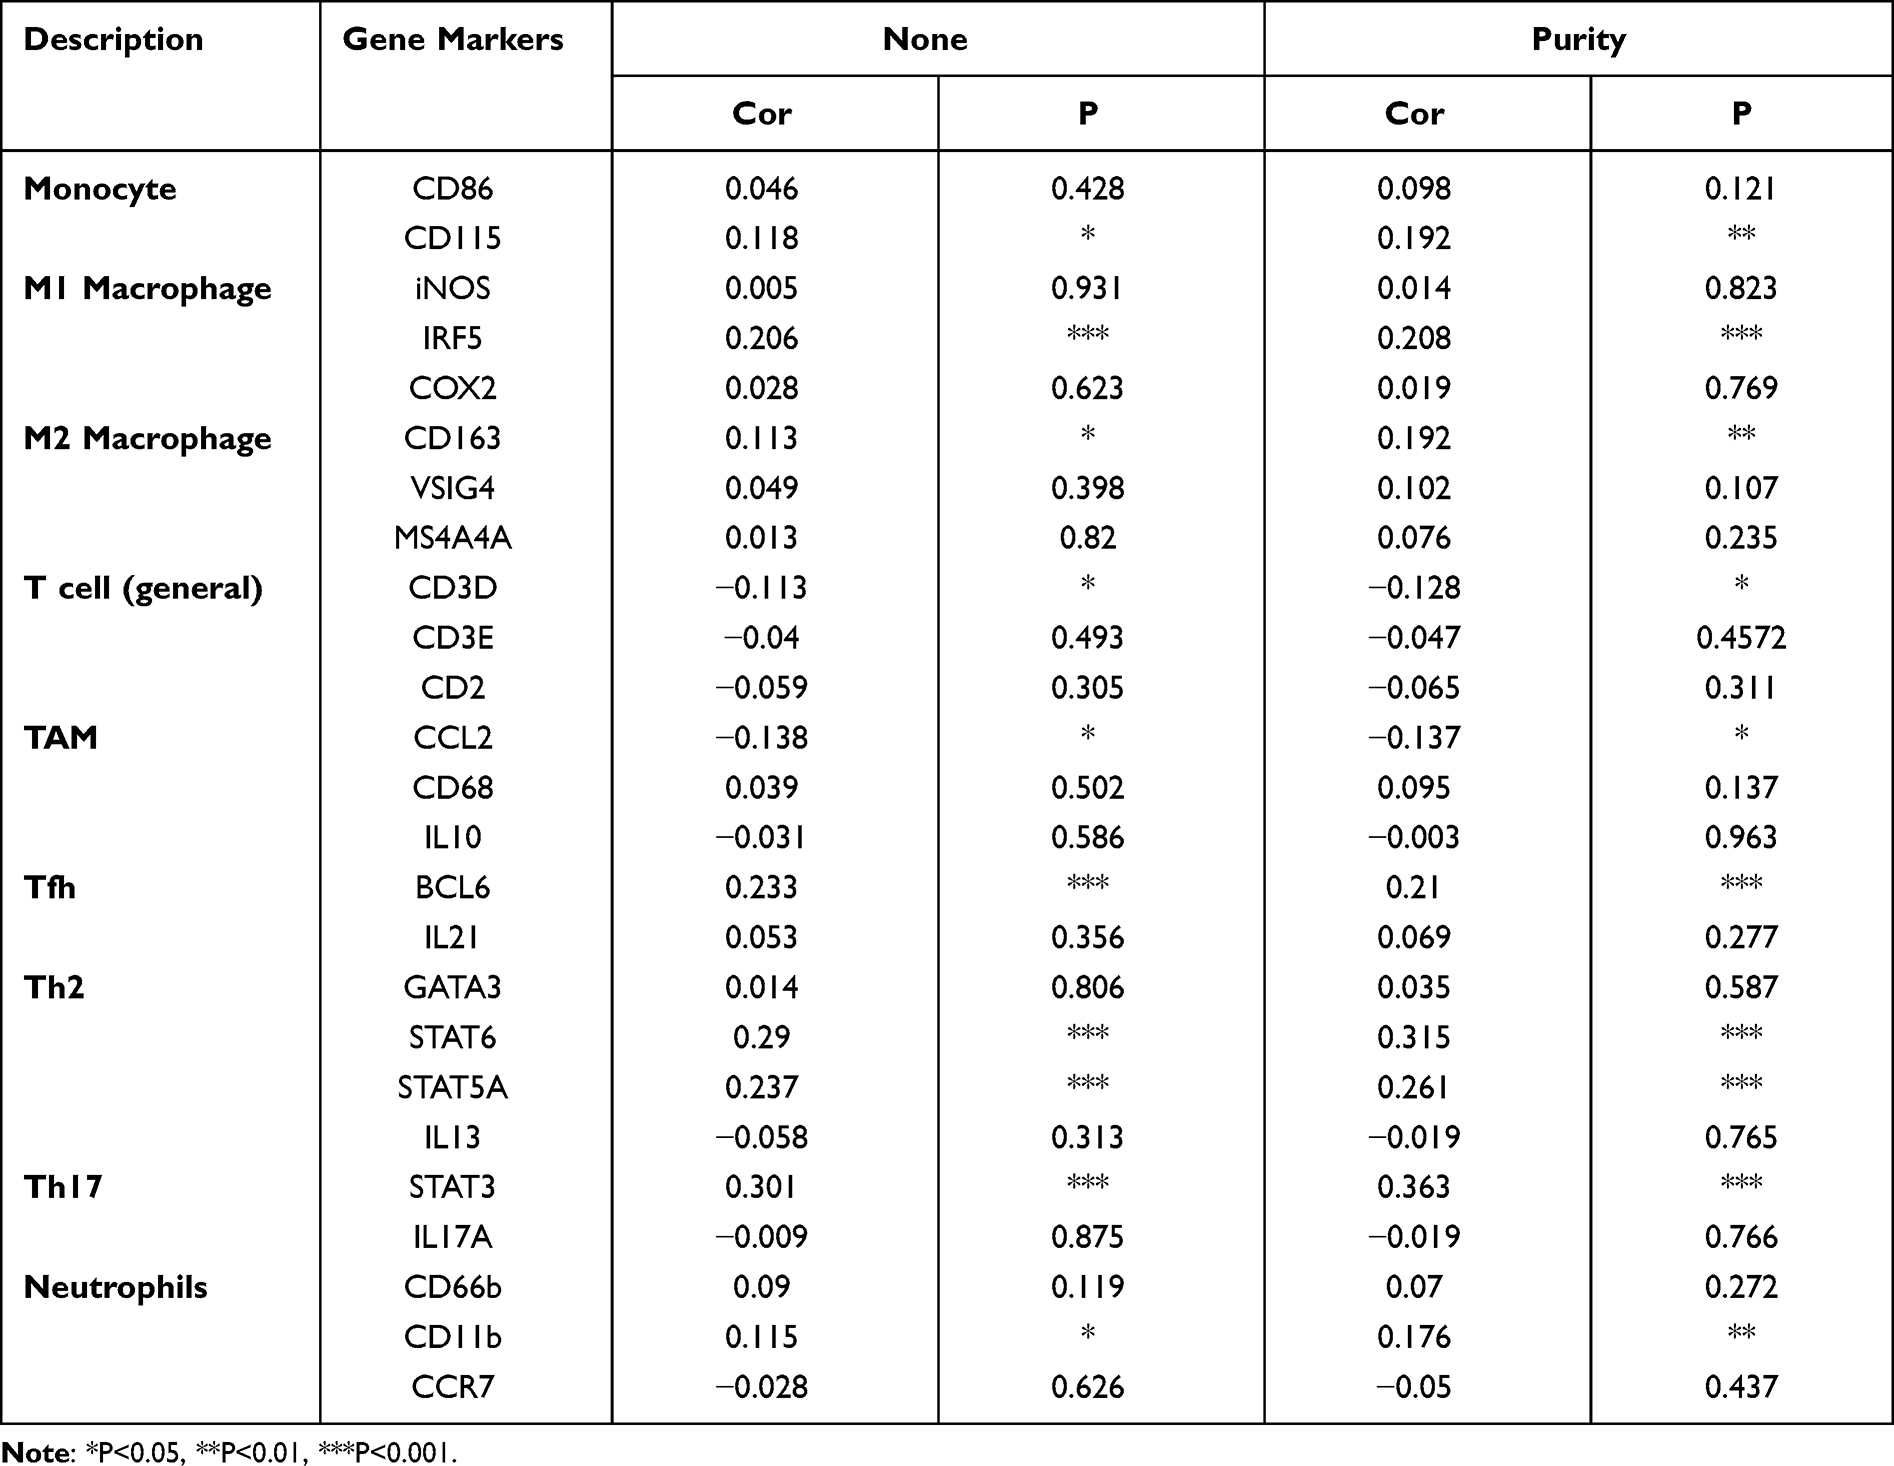 |
Table 2 Correlation Analysis Between SCNN1A and Gene Markers of Immune Cells in TIMER |
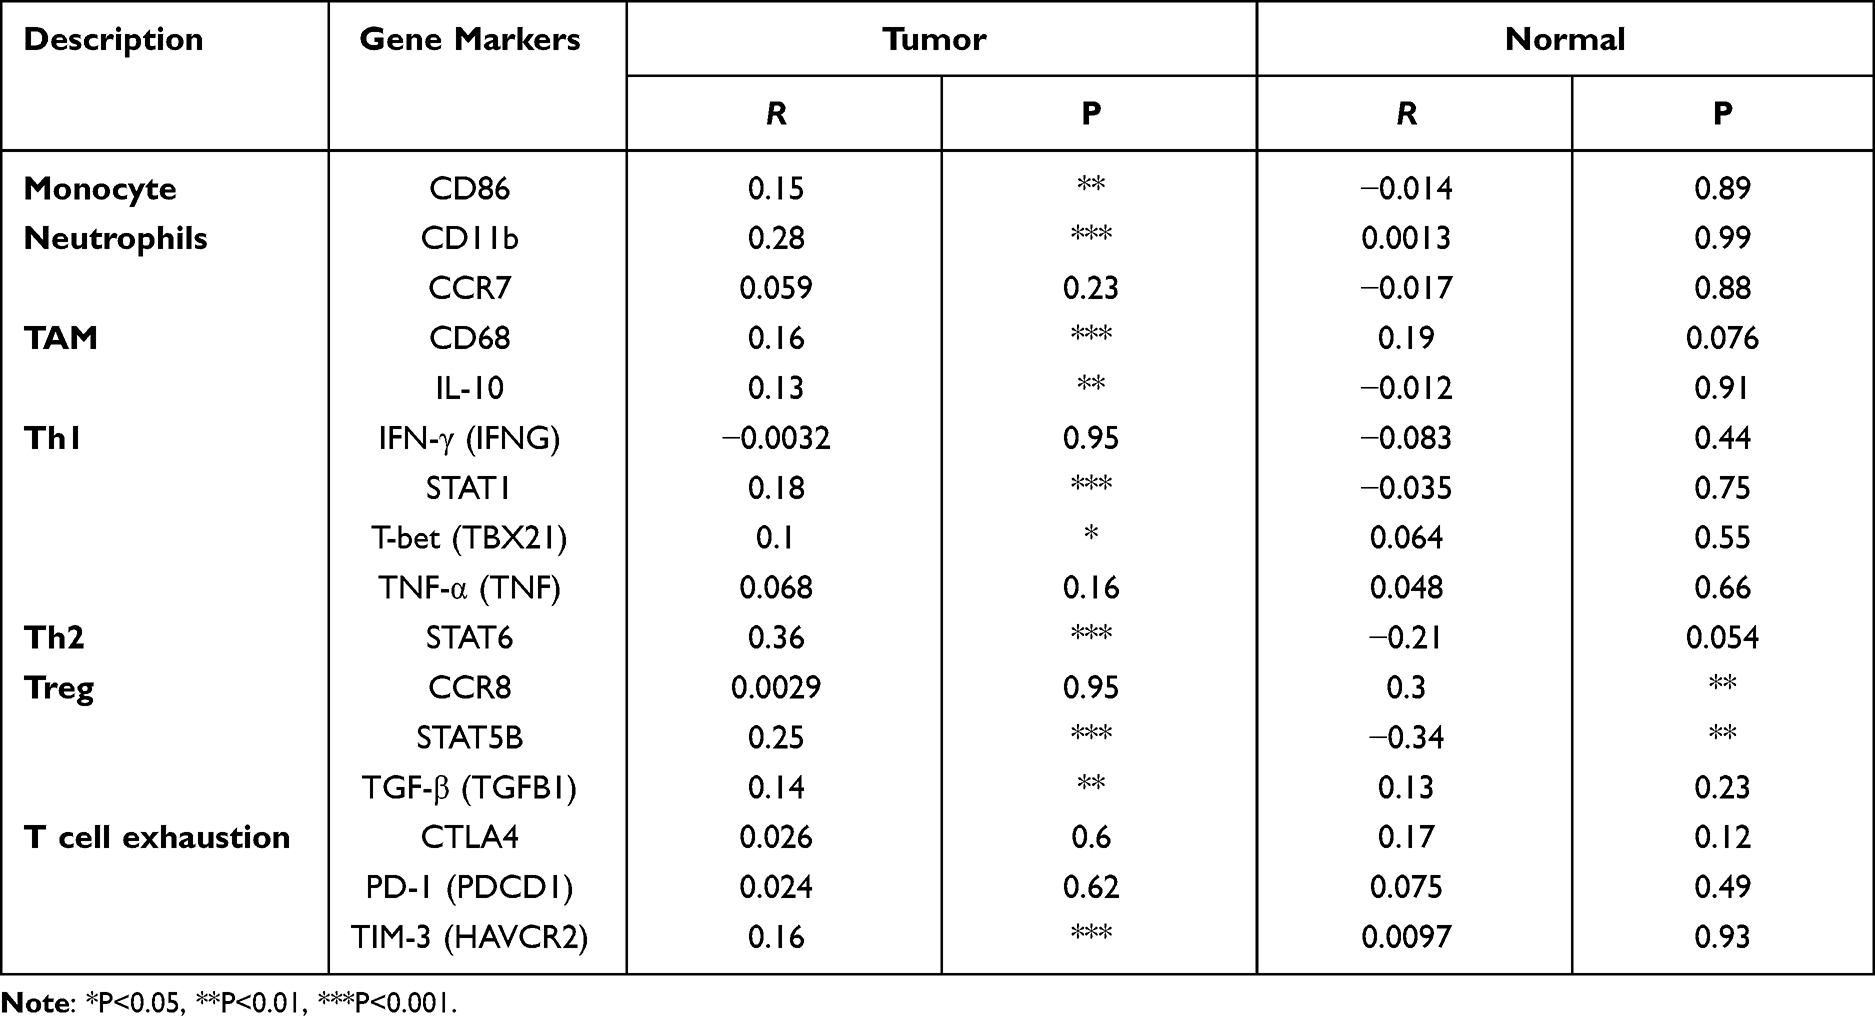 |
Table 3 Correlation Analysis Between SCNN1A and Marker Genes of Immune Cells in GEPIA |
Discussion
Due to the lack of early typical clinical symptoms and effective diagnostic methods, most OV patients are diagnosed at late stages.23 Additionally, a high rate of disease recurrence contributes to inferior outcomes in the majority of OV patients. Although surgery and treatment drugs have improved, the latest treatments still do not improve survival in ovarian cancer patients.24 Hence, it is of great significance to further study the molecular mechanisms of OV pathogenesis and develop new therapeutic methods for improving prognosis. It is imperative to search stable and reliable biomarkers for advancing the prognosis of ovarian cancer. In our bioinformatics analysis, we focused on epithelial ovarian cancer, which accounts for the majority of ovarian cancer cases. SCNN1A codes one of the subunits of the epithelial sodium channel (ENaC), a sodium-permeable ion channel expressed in epithelial tissues. Previous researches have revealed that SCNN1A has multiple functional roles in a variety of malignancies. In ovarian cancer, whether SCNN1A is involved in tumor progression and tumor immunity remains to be studied. Although some studies have found that SCNN1A is overexpression and is a potential biomarker of OV,12,25 the prognostic value and the potential function of SCNN1A in OV were unclear and not fully understood.
In the present study, we carried out prognosis and clinical correlation analysis to investigate the underlying diagnostic and prognostic value of SCNN1A; the biological functions were determined by molecular interaction network analysis and enrichment analysis. The biological roles of SCNN1A were assessed by Metascape database and GSEA. We performed Kaplan–Meier analysis, Cox regression analysis and nomograms to assess the predictive value of SCNN1A for clinical outcomes in OV patients. Finally, single-sample GSEA was conducted to study the relationship between SCNN1A and immune cell infiltration.
Herein, we discovered that both mRNA and protein level of SCNN1A were overexpressed in ovarian cancer (Figures 1 and 2A, B). Significantly, high SCNN1A expression was correlated with poorer OS, progression-free survival (PFS), and disease-specific survival (DSS) of ovarian cancer patients. Moreover, the ROC curve for SCNN1A discrimination of OV diagnosis had an AUC of 0.990, firmly implying that SCNN1A was a promising biomarker for ovarian cancer (Figure 1D). In addition, high SCNN1A expression was correlated with inferior survival of OV in FIGO stage III–IV, histologic stage G3-G4, anatomic neoplasm subdivision (bilateral), and tumor status (with tumor) subgroups, with higher HR for poor OS and DSS when SCNN1A was highly expressed in OV (Figure 7). We discovered that SCNN1A expression remained a strong prognostic predictor in these subgroups, indicating that SCNN1A was independent of these important clinicopathological factors. In this article, a nomogram plot was constructed to visually display the relationship between four clinicopathologic variables (FIGO stage, primary treatment outcome, tumor status, and SCNN1A) and 1-, 3-, and 5-year overall survival. After the evaluation of C-index, ROC and calibration curves, the SCNN1A-based nomogram showed pleasing performance (Figure 8).
As is known to all, DNA methylation is a frequent epigenetic mechanism that occurs in a variety of cancers.26 Improvement in technology to study DNA methylation has begun to uncover how epigenetics contributes to the etiology, chemotherapy response and prognosis of OV patients.27 Although there are a lot of mechanisms that can lead to the upregulation of gene level, hypomethylation is one of the major regulatory mechanisms of gene expression. By exploring cBioPortal and UCSC Xena databases, we found that SCNN1A DNA amplification and hypomethylation may conduce to SCNN1A upregulation, and SCNN1A DNA amplification and genetic alteration are related to inferior outcome (Figure 3). Thus, differentially methylated genes may serve as promising biomarkers or therapeutic targets in ovarian cancer.
Considering the limited functional data on SCNN1A, we executed functional enrichment analysis based on GO and GESA. The results revealed that SCNN1A may participate in metabolic process, immune system process, and cellular process (Figure 4). These findings were consistent with the ssGSEA results shown in this study and reinforced the link between SCNN1A and immune infiltrates (Figure 10). Moreover, GSEA displayed that SCNN1A was significantly associated with M phase, cell cycle checkpoints, cellular senescence, epigenetic regulation of gene expression, signaling by nuclear receptors, and transcriptional regulation by RUNX1 (Figure 5). A disrupted cell cycle is a hallmark of many tumors. Disruption of the cell cycle can lead to abnormal cell proliferation, which is closely associated with tumors, including ovarian cancer. Cellular senescence has been reported to be associated with several aspects of ovarian cancer.28 Platinum chemotherapy induces cellular senescence, which promotes chemoresistance by inducing the production of cancer stem-like cells (CSCs).29 RUNX1 was upregulated in ovarian cancer and high expression of RUNX1 is related to lower survival in OV patients. A study confirmed that knockdown of RUNX1 in ovarian cancer cells can remarkably inhibited cell proliferation, cell migration and invasion.30 In addition, Xiao et al constructed RUNX1-knockout clones using CRISPR/Cas9 technology and found that depletion of RUNX1 gene promoted cisplatin-induced apoptosis in ovarian cancer cells.31 These findings will help to better understand the mechanism of SCNN1A and RUNX1 in OV.
Tumor microenvironment (TME) comprises tumor cells, stromal cells, extracellular matrix, and infiltrating immune cells.32 Some studies have covered different important roles of tumor-infiltrating immune cells (TIICs) in tumor development. TIICs develop a complex network of intercellular interaction that helps facilitate and sustain the immunosuppressive microenvironment and foster immune escape, thereby contributing to tumor progression.33,34 We revealed an underlying association between SCNN1A expression and immune cell infiltration. Our results demonstrated that SCNN1A expression in OV was positively associated with multiple types of immune cell infiltration, for example, Tcm, Tem, Th17, NK, and eosinophil cells (Figure 10). However, SCNN1A expression was negatively related to Th2 cells. Recent studies have reported that eosinophils infiltrate multiple tumors and are equipped to regulate tumor progression either directly by interacting with tumor cells or indirectly by shaping the TME. In ovarian cancer, higher eosinophil count was predictive of both recurrence and mortality.35 NK cells are cytotoxic lymphocytes and characterized by strong antitumor activities, involving production of IFN-γ and direct cytotoxicity against cancer cells. Latest studies have shown that abnormal molecules caused by the ovarian cancer TME could interfere with the antitumor response of NK cells. For instance, some researchers have found and characterized a group of mature NK cells that overexpressed programmed death 1 (PD-1) in the ascites of OV patients.36,37 PD-1+ NK cells show inferior proliferative reaction to exogenous cytokines and display diminished antitumor activity involving decreased cytokine production and reduced cytotoxic/degrangulation activity.36 Tumor-infiltrating Tcm cells have been described in a variety of cancers and they often display dysfunctional phenotypes correlated with tumor progression. This could be interpreted that excessive neoantigen exposure induced functional changes in Tcm cells, shifting the anti-tumor response toward non-responsiveness. Besides, a remarkable association between SCNN1A and various immune cell marker set was noticed in ovarian cancer (Tables 2 and 3). In addition, SCNN1A could influence the survival of ovarian cancer patients partly via immune cell infiltration (Figure 9). The above observations highlight the apparent role of SCNN1A in tumorigenesis and suggest that SCNN1A might play a vital role in the regulation of immune cell infiltration in ovarian cancer. Nonetheless, the exact functions of SCNN1A in the TME still need to be fully explored.
Although this study enhanced our comprehension of the correlation between SCNN1A and ovarian cancer, there were several limits. Firstly, the expression and prognostic implication of SCNN1A were determined using online public databases, and further studies with clinical samples are required to confirm these results. Secondly, to further explore the detailed mechanism of the effect of SCNN1A on immune infiltration in OV, in vivo/vitro experiments need to be designed.
In conclusion, SCNN1A mRNA and protein expression were overexpressed in OV, while methylation of SCNN1A was decreased in OV. This research provides new insights into the potential mechanisms of OV tumorigenesis and reveals SCNN1A as a promising diagnostic and prognostic biomarker for OV. Our results provide an underlying mechanism that SCNN1A expression may mediate tumor immunity by modulating the infiltration of immune cells in OV. Taken together, this study suggests that SCNN1A may influence the prognosis of OV patients by interacting with infiltrating immune cells. The biological impact of SCNN1A in OV remains to be further verified.
Ethics Statement
The study has been approved by the Ethics Committee of Guangxi Medical University Hospital and is considered to be in compliance with the requirements of medical ethics. Approval number: LW2021101. This trial was conducted in accordance with the Declaration of Helsinki.
Acknowledgments
I sincerely appreciate my tutor’s help in research direction and paper writing. We greatly thank TCGA and GEO websites for providing platforms and acknowledge the researchers for uploading useful data.
Author Contributions
All authors made significant contributions to conception and design, data acquisition, or data analysis and interpretation; participated in the drafting of the article or made critical revisions to important intellectual content; agreed to submit to the current journal; gave final approval of the version to be published; and agree to be responsible for all aspects of the work.
Funding
This research was financially supported by the Thousand-Hundred-Ten Talent Project of Guangxi Province, the 139 Medical High-level Talents Training Plan of Guangxi Province and the Medical and Health Appropriate Technology Development and Promotion Application Project of Guangxi Province (NO.2015226, G201903032, S2018031).
Disclosure
The authors state that there are no conflicts of interest about this study.
References
1. Bray F, Ferlay J, Soerjomataram I, Siegel RL, Torre LA, Jemal A. Global cancer statistics 2018: GLOBOCAN estimates of incidence and mortality worldwide for 36 cancers in 185 countries. CA Cancer J Clin. 2018;68(6):394–424. doi:10.3322/caac.21492
2. Kuroki L, Guntupalli SR. Treatment of epithelial ovarian cancer. BMJ. 2020;371:m3773. doi:10.1136/bmj.m3773
3. Matulonis UA, Sood AK, Fallowfield L, Howitt BE, Sehouli J, Karlan BY. Ovarian cancer. Nat Rev Dis Primers. 2016;2:16061. doi:10.1038/nrdp.2016.61
4. Torre LA, Trabert B, DeSantis CE, et al. Ovarian cancer statistics, 2018. CA Cancer J Clin. 2018;68(4):284–296. doi:10.3322/caac.21456
5. Hanukoglu I, Hanukoglu A. Epithelial sodium channel (ENaC) family: phylogeny, structure-function, tissue distribution, and associated inherited diseases. Gene. 2016;579(2):95–132. doi:10.1016/j.gene.2015.12.061
6. Pierandrei S, Truglio G, Ceci F, et al. DNA methylation patterns correlate with the expression of SCNN1A, SCNN1B, and SCNN1G (epithelial sodium channel, ENaC) genes. Int J Mol Sci. 2021;22(7):3754. doi:10.3390/ijms22073754
7. Carén H, Djos A, Nethander M, et al. Identification of epigenetically regulated genes that predict patient outcome in neuroblastoma. BMC Cancer. 2011;11:66. doi:10.1186/1471-2407-11-66
8. He M, Liu S, Gallolu Kankanamalage S, et al. The epithelial sodium channel (αENaC) is a downstream therapeutic target of ASCL1 in pulmonary neuroendocrine tumors. Transl Oncol. 2018;11(2):292–299. doi:10.1016/j.tranon.2018.01.004
9. Chang J, Hu X, Nan J, Zhang X, Jin X. HOXD9‑induced SCNN1A upregulation promotes pancreatic cancer cell proliferation, migration and predicts prognosis by regulating epithelial‑mesenchymal transformation. Mol Med Rep. 2021;24(5):819. doi:10.3892/mmr.2021.12459
10. Geng Y, Zhao S, Jia Y, et al. miR‑95 promotes osteosarcoma growth by targeting SCNN1A. Oncol Rep. 2020;43(5):1429–1436. doi:10.3892/or.2020.7514
11. Ware AW, Harris JJ, Slatter TL, Cunliffe HE, McDonald FJ. The epithelial sodium channel has a role in breast cancer cell proliferation. Breast Cancer Res Treat. 2021;187(1):31–43. doi:10.1007/s10549-021-06133-7
12. Wu L, Ling ZH, Wang H, Wang XY, Gui J. Upregulation of SCNN1A promotes cell proliferation, migration, and predicts poor prognosis in ovarian cancer through regulating epithelial-mesenchymal transformation. Cancer Biother Radiopharm. 2019;34(10):642–649. doi:10.1089/cbr.2019.2824
13. Tang Z, Li C, Kang B, Gao G, Li C, Zhang Z. GEPIA: a web server for cancer and normal gene expression profiling and interactive analyses. Nucleic Acids Res. 2017;45(W1):W98–W102. doi:10.1093/nar/gkx247
14. Uhlén M, Fagerberg L, Hallström BM, et al. Proteomics. Tissue-based map of the human proteome. Science. 2015;347(6220):1260419. doi:10.1126/science.1260419
15. Love MI, Huber W, Anders S. Moderated estimation of fold change and dispersion for RNA-seq data with DESeq2. Genome Biol. 2014;15(12):550. doi:10.1186/s13059-014-0550-8
16. Szklarczyk D, Gable AL, Lyon D, et al. STRING v11: protein-protein association networks with increased coverage, supporting functional discovery in genome-wide experimental datasets. Nucleic Acids Res. 2019;47(D1):D607–D613. doi:10.1093/nar/gky1131
17. Gao J, Aksoy BA, Dogrusoz U, et al. Integrative analysis of complex cancer genomics and clinical profiles using the cBioPortal. Sci Signal. 2013;6(269):pl1. doi:10.1126/scisignal.2004088
18. Goldman MJ, Craft B, Hastie M, et al. Visualizing and interpreting cancer genomics data via the Xena platform. Nat Biotechnol. 2020;38(6):675–678. doi:10.1038/s41587-020-0546-8
19. Zhou Y, Zhou B, Pache L, et al. Metascape provides a biologist-oriented resource for the analysis of systems-level datasets. Nat Commun. 2019;10(1):1523. doi:10.1038/s41467-019-09234-6
20. Yu G, Wang LG, Han Y, He QY. clusterProfiler: an R package for comparing biological themes among gene clusters. OMICS. 2012;16(5):284–287. doi:10.1089/omi.2011.0118
21. Li T, Fan J, Wang B, et al. TIMER: a web server for comprehensive analysis of tumor-infiltrating immune cells. Cancer Res. 2017;77(21):e108–e110. doi:10.1158/0008-5472.CAN-17-0307
22. Hänzelmann S, Castelo R, Guinney J. GSVA: gene set variation analysis for microarray and RNA-seq data. BMC Bioinform. 2013;14:7. doi:10.1186/1471-2105-14-7
23. Lheureux S, Braunstein M, Oza AM. Epithelial ovarian cancer: evolution of management in the era of precision medicine. CA Cancer J Clin. 2019;69(4):280–304. doi:10.3322/caac.21559
24. Armstrong DK, Alvarez RD, Bakkum-Gamez JN, et al. NCCN guidelines insights: ovarian cancer, version 1.2019. J Natl Compr Canc Netw. 2019;17(8):896–909. doi:10.6004/jnccn.2019.0039
25. Zhang X, Su Y, Wu X, et al. Integrative analysis of the common genetic characteristics in ovarian cancer stem cells sorted by multiple approaches. J Ovarian Res. 2020;13(1):116. doi:10.1186/s13048-020-00715-7
26. Ding W, Chen G, Shi T. Integrative analysis identifies potential DNA methylation biomarkers for pan-cancer diagnosis and prognosis. Epigenetics. 2019;14(1):67–80. doi:10.1080/15592294.2019.1568178
27. Natanzon Y, Goode EL, Cunningham JM. Epigenetics in ovarian cancer. Semin Cancer Biol. 2018;51:160–169. doi:10.1016/j.semcancer.2017.08.003
28. Książek K. Where does cellular senescence belong in the pathophysiology of ovarian cancer? Semin Cancer Biol. 2020. doi:10.1016/j.semcancer.2020.11.021
29. Nacarelli T, Fukumoto T, Zundell JA, et al. NAMPT inhibition suppresses cancer stem-like cells associated with therapy-induced senescence in ovarian cancer. Cancer Res. 2020;80(4):890–900. doi:10.1158/0008-5472.CAN-19-2830
30. Keita M, Bachvarova M, Morin C, et al. The RUNX1 transcription factor is expressed in serous epithelial ovarian carcinoma and contributes to cell proliferation, migration and invasion. Cell Cycle. 2013;12(6):972–986. doi:10.4161/cc.23963
31. Xiao L, Peng Z, Zhu A, et al. Inhibition of RUNX1 promotes cisplatin-induced apoptosis in ovarian cancer cells. Biochem Pharmacol. 2020;180:114116. doi:10.1016/j.bcp.2020.114116
32. Jiang Y, Wang C, Zhou S. Targeting tumor microenvironment in ovarian cancer: premise and promise. Biochim Biophys Acta Rev Cancer. 2020;1873(2):188361. doi:10.1016/j.bbcan.2020.188361
33. Hinshaw DC, Shevde LA. The tumor microenvironment innately modulates cancer progression. Cancer Res. 2019;79(18):4557–4566. doi:10.1158/0008-5472.CAN-18-3962
34. Anderson NM, Simon MC. The tumor microenvironment. Curr Biol. 2020;30(16):R921–R925. doi:10.1016/j.cub.2020.06.081
35. Grisaru-Tal S, Itan M, Klion AD, Munitz A. A new dawn for eosinophils in the tumour microenvironment. Nat Rev Cancer. 2020;20(10):594–607. doi:10.1038/s41568-020-0283-9
36. Pesce S, Greppi M, Tabellini G, et al. Identification of a subset of human natural killer cells expressing high levels of programmed death 1: a phenotypic and functional characterization. J Allergy Clin Immunol. 2017;139(1):335–346.e3. doi:10.1016/j.jaci.2016.04.025
37. Mariotti FR, Petrini S, Ingegnere T, et al. PD-1 in human NK cells: evidence of cytoplasmic mRNA and protein expression. Oncoimmunology. 2018;8(3):1557030. doi:10.1080/2162402X.2018.1557030
 © 2022 The Author(s). This work is published and licensed by Dove Medical Press Limited. The full terms of this license are available at https://www.dovepress.com/terms.php and incorporate the Creative Commons Attribution - Non Commercial (unported, v3.0) License.
By accessing the work you hereby accept the Terms. Non-commercial uses of the work are permitted without any further permission from Dove Medical Press Limited, provided the work is properly attributed. For permission for commercial use of this work, please see paragraphs 4.2 and 5 of our Terms.
© 2022 The Author(s). This work is published and licensed by Dove Medical Press Limited. The full terms of this license are available at https://www.dovepress.com/terms.php and incorporate the Creative Commons Attribution - Non Commercial (unported, v3.0) License.
By accessing the work you hereby accept the Terms. Non-commercial uses of the work are permitted without any further permission from Dove Medical Press Limited, provided the work is properly attributed. For permission for commercial use of this work, please see paragraphs 4.2 and 5 of our Terms.