")
Back to Journals » Diabetes, Metabolic Syndrome and Obesity » Volume 13
Salivary Amylase Gene Copy Number Is Associated with the Obesity and Inflammatory Markers in Children
Authors Selvaraju V, Venkatapoorna CMK, Babu JR, Geetha T
Received 27 February 2020
Accepted for publication 29 April 2020
Published 19 May 2020 Volume 2020:13 Pages 1695—1701
DOI https://doi.org/10.2147/DMSO.S251359
Checked for plagiarism Yes
Review by Single anonymous peer review
Peer reviewer comments 2
Editor who approved publication: Prof. Dr. Juei-Tang Cheng
Vaithinathan Selvaraju,1 Chandra MK Venkatapoorna,1 Jeganathan R Babu,1,2 Thangiah Geetha1,2
1Department of Nutrition, Dietetics, and Hospitality Management, Auburn University, Auburn, AL, USA; 2Boshell Metabolic Diseases and Diabetes Program, Auburn University, Auburn, AL, USA
Correspondence: Thangiah Geetha
Department of Nutrition, Dietetics, and Hospitality Management, Auburn University, Auburn, AL, USA
Tel +1 334 844 7418
Fax +1 334 844 3268
Email [email protected]
Background: We have recently shown that the copy number of salivary amylase (AMY1) gene was significantly decreased, and the obesity-related salivary biomarkers resistin, MCP-1, TNF-α, IL-6, and CRP were significantly increased in overweight/obese children compared to normal weight. This study aimed to evaluate the association of AMY1 copy number variant (CNV) with obesity and inflammatory markers. Seventy-six participants aged between 6 and 10 years have participated, and the saliva samples were collected along with the anthropometric measurements.
Methods: AMY1 copy number was analyzed by 3D digital PCR, and obesity-related biomarkers were performed with a Bioplex multiplex analyzer.
Results: The mean AMY1 copy number was higher in normal weight (7.90 ± 0.38) compared to the overweight/obese group (6.20 ± 0.29). The association of AMY1 CNV with obesity and inflammatory markers showed significant negative correlation [CRP, β = − 0.238 (p < 0.05); resistin, β = − 0.25 (p < 0.05); MCP-1, β = − 0.304 (p < 0.01)] except for complement factor D, TNF α and IL-6. The anti-inflammatory cytokine, IL-10 reported a positive correlation with AMY1 copy number with a β = 0.268 (p < 0.05). The multivariable model adjusted with age and gender depicted a similar correlation with obesity markers.
Conclusion: Our results report that AMY1 CNV is associated with obesity and inflammatory biomarkers in children’s saliva sample.
Keywords: AMY1 copy numbers, obesity-related markers, inflammatory markers, childhood obesity, body mass index
Introduction
Obesity is one of the complex and multifaceted disorders in humans, which may lead to other complications, including diabetes and cardiovascular disease.1,2 The occurrence of obesity has increased three times compared to 1975 and projected to persist in the future.3 Even though obesity is known as an imbalance between energy expenditure and food intake, there are several genetic and non-genetics factors such as environmental, behavioral factors involved in obesity.4,5 Within an individual family, there can be a 40 to 70% inter-individual variability in body mass index (BMI), as a result of accredited to the involvement of genetic factors.6 In recent years, Genome-Wide Association Studies (GWAS) is a useful approach to detect single nucleotide polymorphisms (SNPs) and copy number variants (CNV) associated with increased BMI and obesity. From these analyses, numerous genetic variants involved in metabolic disorders were reported.7 There are numerous genes intricate in the energy homeostasis of the body system that contributes to the development of obesity. Recent studies showed that genomic copy number variants are the major contributors to several metabolic disorders.8 Copy number variants are used as an essential genetic load for several metabolic diseases.9,10 The genetic connection between AMY1 CNV and obesity showed that low AMY1 copy number significantly associated with high BMI.4,5,11-13 Recently from our lab, we showed the inverse association of AMY1 copy number and the obesity measurement in children.13 Falchi et al first reported the association of AMY1 CNV and the high risk of obesity in a longitudinal study. AMY1 gene CNV showed a positive correlation with salivary amylase gene expression as well as serum amylase levels. However, AMY1 CNV showed a negative association with obesity measures.14 Despite these findings, some studies showed no association with obesity or in a reverse manner.15,16 In one study, only obese females were found to have the lowest AMY1 copy number and exhibited a negative association.5
Additionally, obesity is known to increase the risk of developing metabolic dysregulation, such as type-2 diabetes and cardiovascular diseases. Recent findings from our lab showed the obesity salivary biomarkers such as CRP, resistin, MCP-1, TNF-α, and IL-6 were found to be significantly increased in overweight/obese children.17 There is a present gap in research to thoroughly understand the relationship between AMY1 CNV and obesity-related biomarkers.5,18 This study examines the gap in the relationship between AMY1 CNV and obesity-related biomarkers with some low-grade inflammatory markers. It is aimed to elucidate the association of obesity-related salivary biomarkers such as C-reactive protein, resistin, CCL2/MCP-1, TNF-α, IL-6, complement factor-D, and IL-10 with a gold standard measure of AMY1 CNV by digital PCR.
Materials and Methods
Study Population
This study was designed to assess the correlation of obesity markers and a genetic marker AMY1 copy number variation (CNV) in children’s salivary samples to measure the extent of obesity within the sample of children. Auburn University Institute Review Board (IRB) approval was obtained, and written consent from all the participants and parents were obtained in accordance with Declaration of Helsinki. Briefly, the participants were recruited through social network and by posting flyers. The initial phone survey was collected from parents, and children were excluded from the study if they have a history of diabetes or cardiovascular disease. In the study group, 76 participants (40 normal weight [NW] and 36 overweight/obese [OW/OB]) joined in the study group ages between 6 and 10 years from Lee County and Macon County, Alabama. The baseline characteristics of the participants are described in our previously published article.17
Measurement of Anthropometric Parameters
Anthropometric measurements were collected as described previously.17 Briefly, Children’s body weight and height was measured using a Tanita digital scale attached with a stadiometer with the minimal dress, without shoes. Body mass index (BMI) was calculated from participants’ weight and height [weight in kg/height in m2]. BMI z-score, also known as BMI standard deviation (s. d.) score, is the relative weight adjusted for child age and gender. BMI z-score was calculated using the World Health Organization3 growth reference 2017 SPSS macro,19 Waist circumference (WC) was measured using stretch-resistant tape, WC z-score, and waist circumference adjusted height ratio (WHtR) z-score were calculated with R macro package.20
Saliva Collection
The participants were asked not to have any food or any drinks for 30 min before sample collection. The saliva was collected during the daytime in the Auburn University facility. The salivary samples for obesity biomarker analysis were directly collected in sterile cryovials using a saliva collection aid (SalivaBio LLC, PA, USA). Samples were centrifuged with an rpm of 2800 at 4°C for 20 min to remove the debris and cells. Saliva samples were collected and stored at −80°C until further analysis.17 For analysis of AMY1 copy number variant (CNV), the saliva samples were collected in the DNA GenoTek Saliva Collection kit (Ontario, Canada) and stored in room temperature until the DNA isolation.
Salivary Biomarkers Measurements
Salivary obesity-related biomarkers were analyzed using the Luminex magnetics multiplex assay kit, Obesity Panel-7plex (catalog # LOBM000, R&D systems, MN, USA) for 7 analytes: C-reactive protein, resistin, CCL2/MCP-1, TNF-α, IL-6, complement factor-D, and IL-10. The detailed protocol of these analytes measurements was described in our previous publication.17 Briefly, 50 µL of diluted saliva samples were incubated with 50 µL of diluted microparticle cocktail for 3 h at room temperature (RT) in plate shaker at a fixed speed. The sample and bead complex was washed with wash buffer three times using a handheld magnetic washer, incubated with a biotin-antibody complex for 1 h at RT, and washed three times with 1 x wash buffer. The complex was incubated with 50 µL diluted streptavidin-PE at RT for 1 h in the horizontal plate shaker. After incubation, the beads were washed three times, added 100 µL of wash buffer, and read within 90 min with a Bio-Plex 3D analyzer. The data was collected from the five parametric logistics (5-PL) curves and analyzed.
Digital PCR Analysis of Salivary AMY1 CNV
Isolation of DNA, and the detailed protocol for digital PCR was provided in our earlier publication.13 In brief, the isolation genomic DNA was carried out using the PrepIT-L2P kit (DNA GenoTek, Ontario, Canada). The saliva sample was incubated at 50°C for a minimum of 1 h and transferred to a new tube. To this, 20 µL of PrepIT-L2P was added, vortexed, incubated for 10 min in room temperature (RT), and centrifuged to remove the impurities. The DNA was precipitated by inverting and incubating with absolute alcohol and washed using 70% ethanol and diluted the pellet with TE buffer. The DNA was diluted, and quality was determined by agarose gel electrophoresis. The copy number variant of the AMY1 gene was analyzed by digital PCR (QuantStudio 3D digital PCR) comprising of AMY1 (FAM-labeled) and RNase P (VIC labeled), the two TaqMan assay kit. The reaction mix was prepared with 10 ng/µL DNA sample and loaded 14.5 µL into the QuantStudio 3D Digital PCR chip. The digital PCR assay was performed, and the chip was scanned in the QuantStudio 3D Digital PCR instrument. The data were acquired and analyzed using QuantStudio 3D Analysis Suite software.
Statistical Analysis
The number of participants in the study group has been determined by the power analysis calculation using G-Power 3.1 software, assuming a two-sided statistical test and a significance level of 5%. With the sample size of forty and thirty-six, the assumption of a two-group t-test will have 80% power to detect moderate effect sizes of 0.654 as statistically significant. The two-group comparison was performed by Graph pad prism (8.0, GraphPad Software, CA, USA) for the unpaired t-test and the data was represented as mean ± SEM. Highly skewed obesity parameters were transformed by natural logarithm transformation before statistical analysis to achieve normality using SPSS (version 24, IBM, Armonk, NY, USA). The linear regression analysis model was designed based on the variables and levels of measurements, to create the natural log-transformed variables. Linear regression was performed between unrounded AMY1 CNV and less skewed log-transformed obesity measures to determine the significantly associated biomarkers. Accuracy was calculated, and model accuracy was compared. The scattered plot showed the directionality and correlation of the data. The data was fit to run a regression analysis. The β-coefficient obtained was used to quantify the association of the parameters. The determined variables known to impact obesity risk were added as covariates in the multivariable linear regression model covariates include gender and age.
Results
Difference in AMY1 Copy Number Between NW and OW/OB Groups
Seventy-six participants aged in the range of 6–10 years were included in the study. Based on the anthropometric measurements, participants were separated into normal weight (NW) group (n = 40) and overweight/obese (OW/OB) group (n = 36). The characteristics of the participants are shown in our previous study,17 The AMY1 copy number of the participants was calculated and shown in the graph. The OW/OB participants showed a significant decrease in the mean AMY1 copy number of 6.6 (p < 0.01) with a median of 6.1 compared to NW participants with a mean of 7.9 and median of 7.98 CNV (Figure 1A). The copy numbers frequency in NW ranges from 4.0 to 16.25 and in OW/OB group from 2.95 to 10.94. The distribution of copy number frequency rounded to the nearest integer is shown in Figure 1B for NW and OW/OB group. Additionally, the median difference between the groups performed by the non-parametric Mann Whitney test showed a significant difference in AMY1 CNV between NW and OW/OB group (p < 0.05).
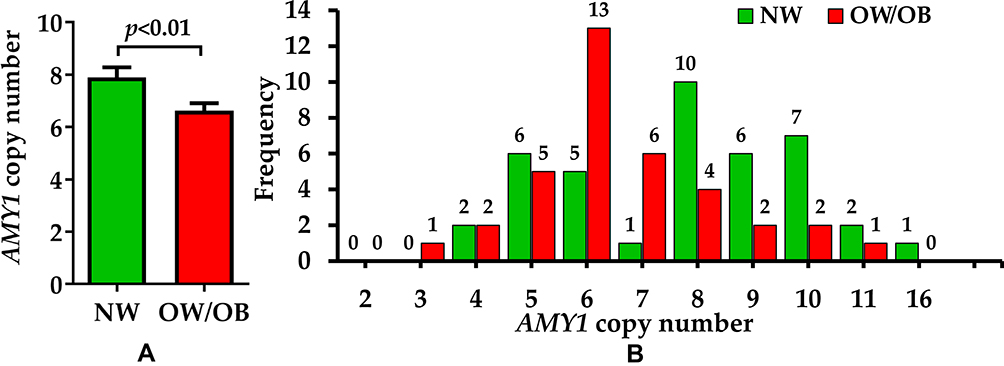 |
Figure 1 AMY1 copy number and obesity. (A) AMY1 copy number variation in NW and OW/OB participants salivary DNA. (B) The frequency graph shows the distribution of AMY1 copy numbers (nearest whole number) in NW and OW/OB participants. |
Association of AMY1 CNV with Anthropometric Measurements and Obesity Markers
The multivariable linear regression model showed a significant negative association of AMY1 CNV distribution and the anthropometric measurements such as BMI z-score (p < 0.001), WC z-score (p < 0.01), and WHtR z-score (p < 0.01) after adjusting with age and gender of the participants (Table 1). The expression of the salivary obesity-related markers of these participants measured by Magnetic Luminex performance assay was reported in our previous study.17 The results showed a significantly high expression of resistin, CCL2/MCP-1, TNF-α, IL-6, and CRP in the OW/OB group when compared to NW group participants. However, the expression of IL-10 and complement factor D (CFD) did not show any significant difference in OW/OB compared to the NW group.17 In this study, these obesity-related biomarkers were correlated with AMY1 CNV with an adjusted model. The adjusted multivariable linear regression model showed significant association for CRP (p < 0.05), resistin (p < 0.05), CCL-2/MCP-1 (p < 0.01) and IL-10 (p < 0.05). There was no significant association of TNF-α, IL-6, and complement factor D/Adipsin with AMY1 CNV, as shown in Table 1.
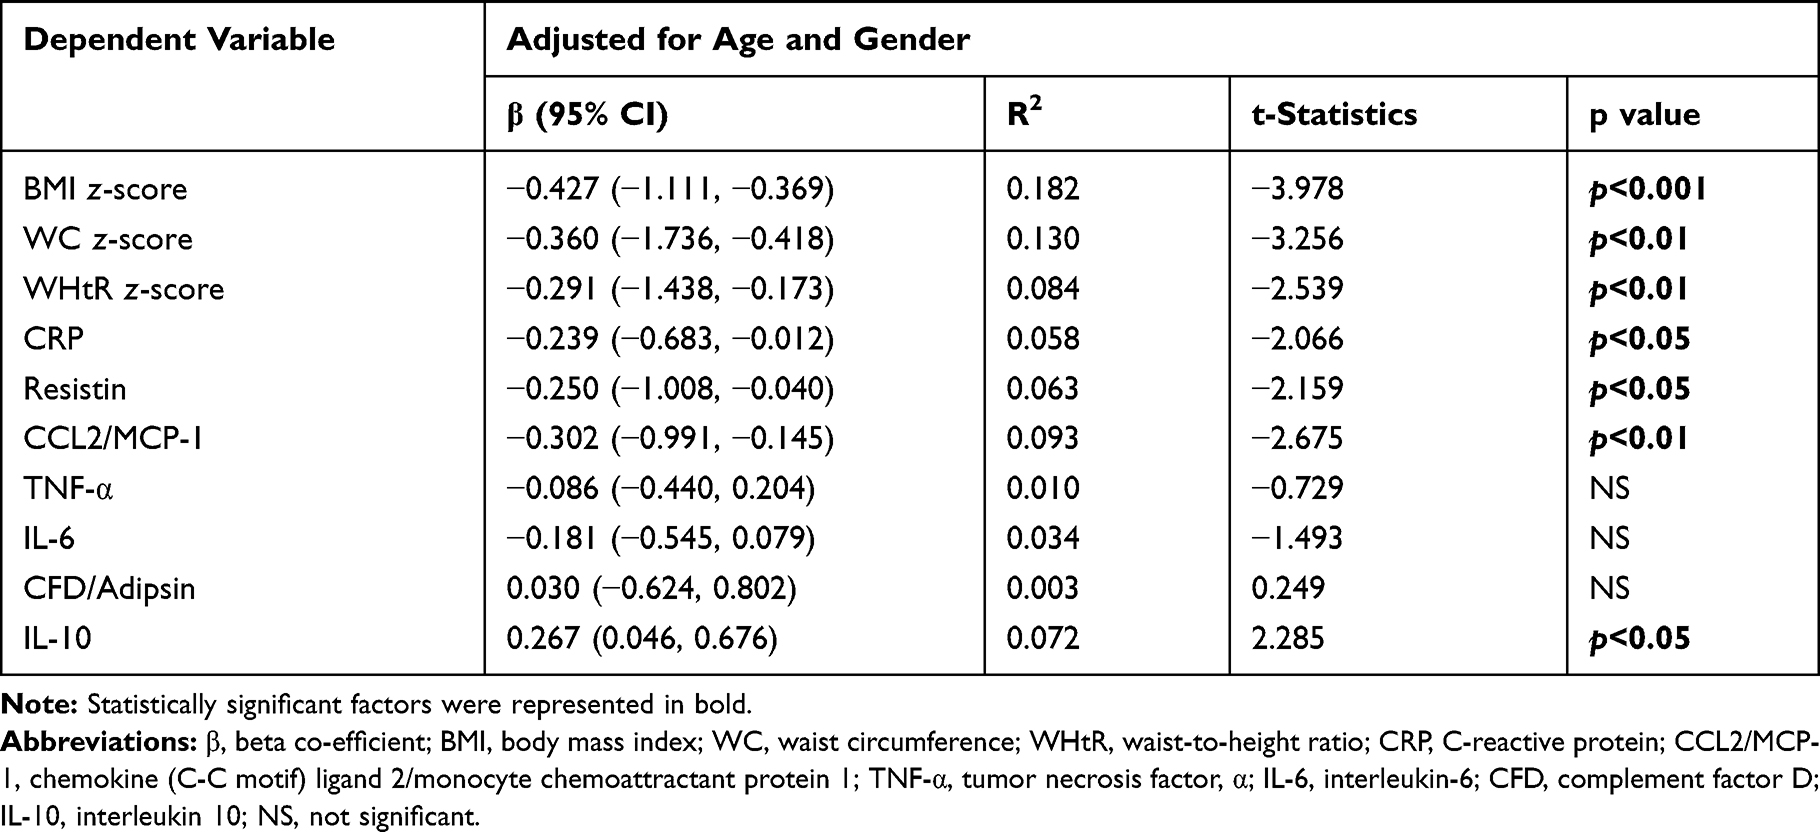 |
Table 1 Multivariable Linear Regression Models for the Associations Between Anthropometric Measures, Obesity Markers and AMY1 CNV Adjusted with Age and Gender |
In addition, linear regression analysis showed a significant negative association of AMY1 CNV with CRP (β = −0.238; p < 0.05), resistin (β = −0.250; p < 0.05), and CCL2/MCP-1 (β = −0.304; p < 0.01). IL-10, an anti-inflammatory cytokine, showed a positive correlation with AMY1 copy number (β = 0.268; p < 0.05) as shown in Figure 2. AMY1 copy number is not significantly associated with TNF-α, IL-6, and complement factor D/Adipsin. Even though the linear regression analysis of CRP, resistin, CCL2/MCP, and IL-10 showed a significant association, the scattered plot shows the weak association with AMY1 CNV.
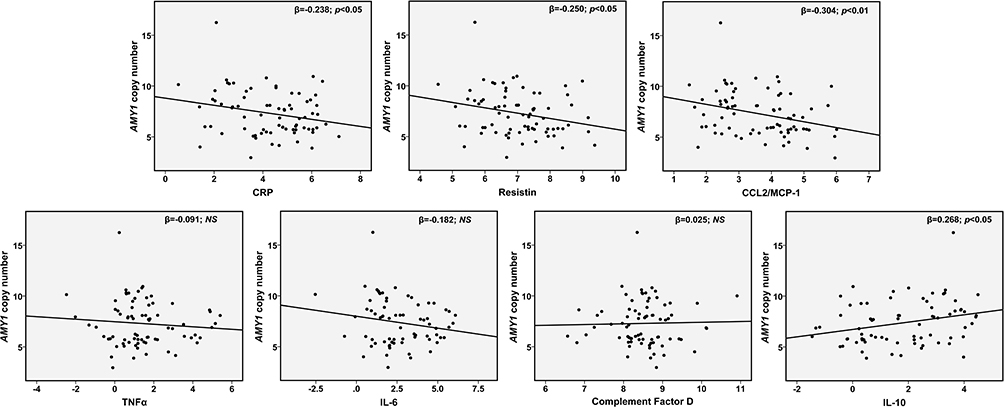 |
Figure 2 Association of AMY1 copy number with obesity salivary markers CRP, resistin, MCP-1, TNFα, IL-6, Complement factor D and IL-10. Abbreviation: NS, not significant. |
Discussion
The main focus of this study is to determine the association of AMY1 CNV and obesity-related biomarkers in saliva samples from normal weight and overweight/obese children. Our results of obesity measures and AMY1 CNV correlate with several cross-sectional studies that showed a negative relationship between BMI and AMY1 CNV.12,14,18,21 Obesity is known to increase the chances of developing metabolic syndromes, such as insulin resistance, type 2 diabetes and cardiovascular diseases.
In our previous findings, we showed that the concentration of salivary biomarkers such as CRP, resistin, MCP-1, TNF-α, and IL-6 was significantly increased in overweight/obese children compared to normal weight.17 In this study, we found that AMY1 CNVs were negatively associated with the obesity-related biomarkers CRP, resistin, and CCL2/MCP-1. CRP is a low-grade inflammatory marker, and an increased level is a risk for developing cardiovascular complications.22–24 Resistin levels are shown to increase in insulin resistance, type 2 diabetes, and cardiovascular disease,25–31 MCP-1 levels have found to be associated in obese participants with metabolic syndrome.32–34 The release of interleukins and other inflammatory markers enhances the negative effect of obesity by infiltrating adipose tissues.24 AMY1 is expressed in adipose tissue,14 and the expression/CNV or activity of AMY1 may affect cytokines and adipokines in adipocytes or immune cells. Furthermore, resistin and MCP-1 are reported to systemically regulate glucose or lipid metabolism,35 and this may be due to the impact of AMY1 CNV on these metabolisms. Previous studies show the association between AMY1 CNV and glycemic outcomes as well as higher LDL.18,36 A recent study demonstrates the low copy number of salivary AMY1 gene is related to the metabolic changes of lipid-based energy production and plays a role in a glucose update.37
Recently Marquina et al found that adults with AMY1 CNV less than four had increased serum levels of LDL-cholesterol, IL-6, IL-1β, TNF-α, and MCP-1.18 These results suggested that overweight or obese adults with low AMY1 CNVs have increased risk of inflammation and cardiovascular disease.18 In a cohort study, low AMY1 CNVs found to be correlated with insulin resistance in Korean men. In addition, the AMY1 CNV was negatively associated with homeostatic model assessment–insulin resistance (HOMA‐IR).36
The critical finding of this study is that overweight/obese participants with lower AMY1 CNV had a higher level of salivary low-grade inflammatory markers CRP and MCP-1 with a decreasing trend in IL-6 and TNF-α. The adipocyte-specific obesity marker resistin showed a negative association with AMY1 CNV, however, the anti-inflammatory IL-10 had a positive association with AMY1 CNV. There was a similar kind of association obtained when adjusted with age and gender. The advantage of this study was that both AMY1 CNVs and obesity-related biomarkers were analyzed in non-invasive saliva samples of elementary school-aged children. These findings will help to detect early in children the risk factors to develop metabolic syndrome. Only a few studies have reported the association between obesity, chronic low inflammatory markers, dyslipidemia, and cardiometabolic risk factors. More studies are warranted to confirm this relationship with AMY1 CNV.
The limitations of the present work are this needs to be confirmed with a large number of participants, whether AMY1 CNV can be used as a genetic biomarker for obesity-related problems. This is a secondary analysis of our previous studies, and the participant size is small. The current study is known as secondary analysis due to difference in the research questions raised, analytic method, and conclusion from our previous studies. The participants used in this study are not consuming any medication or any other disease conditions. In conclusion, our result advocates that OW/OB participants with low AMY1 copy number showed higher obesity markers and low-grade inflammatory markers in saliva. Further research is required for the extrapolation of the AMY1 gene CNV with obesity and inflammation.
Acknowledgments
We would like to thank all the children for their participation and Dr. Cinzia Mastrorilli, Discipline Chair for Microbiology and Immunology, Edward Via College of Osteopathic Medicine, Auburn Campus for helping us with the use of Bio-Plex 3D analyzer.
Disclosure
The authors report no conflicts of interest in this work.
References
1. Barnes AS. The epidemic of obesity and diabetes: trends and treatments. Tex Heart Inst J. 2011;38:142–144.
2. Hubert HB, Feinleib M, McNamara PM, et al. Obesity as an independent risk factor for cardiovascular disease: a 26-year follow-up of participants in the Framingham Heart Study. Circulation. 1983;67:968–977. doi:10.1161/01.CIR.67.5.968
3. WHO. Obesity and overweight fact sheet. Geneva, Switzerland: World Health Organization; 2018. Available from: https://www.who.int/news-room/fact-sheets/detail/obesity-and-overweight.
4. Shorter E. Current research into the association between DNA copy number variation (CNV) and obesity. Biosci Horiz. 2017;10.
5. Viljakainen H, Andersson-Assarsson JC, Armenio M, et al. Low copy number of the AMY1 locus Is associated with early-onset female obesity in Finland. PLoS One. 2015;10:e0131883. doi:10.1371/journal.pone.0131883
6. Bell CG, Walley AJ, Froguel P. The genetics of human obesity. Nat Rev Genet. 2005;6:221–234. doi:10.1038/nrg1556
7. Moleres A, Martinez JA, Marti A. Genetics of obesity. Curr Obes Rep. 2013;2:23–31. doi:10.1007/s13679-012-0036-5
8. Stankiewicz P, Lupski JR. Structural variation in the human genome and its role in disease. Annu Rev Med. 2010;61:437–455. doi:10.1146/annurev-med-100708-204735
9. Beckmann JS, Estivill X, Antonarakis SE. Copy number variants and genetic traits: closer to the resolution of phenotypic to genotypic variability. Nat Rev Genet. 2007;8:639–646. doi:10.1038/nrg2149
10. Girirajan S, Campbell CD, Eichler EE. Human copy number variation and complex genetic disease. Annu Rev Genet. 2011;45:203–226. doi:10.1146/annurev-genet-102209-163544
11. Leon-Mimila P, Villamil-Ramirez H, Lopez-Contreras BE, et al. Low salivary amylase gene (AMY1) copy number is associated with obesity and gut Prevotella abundance in Mexican children and adults. Nutrients. 2018;10(11):1607. doi:10.3390/nu10111607
12. Marcovecchio ML, Florio R, Verginelli F, et al. Low AMY1 gene copy number is associated with increased body mass index in prepubertal boys. PLoS One. 2016;11:e0154961. doi:10.1371/journal.pone.0154961
13. Venkatapoorna CMK, Ayine P, Parra EP, et al. Association of salivary amylase (AMY1) gene copy number with obesity in Alabama elementary school children. Nutrients. 2019;11:1379. doi:10.3390/nu11061379
14. Falchi M, El-Sayed Moustafa JS, Takousis P, et al. Low copy number of the salivary amylase gene predisposes to obesity. Nat Genet. 2014;46(5):492–497. doi:10.1038/ng.2939
15. Rukh G, Ericson U, Andersson-Assarsson J, et al. Dietary starch intake modifies the relation between copy number variation in the salivary amylase gene and BMI. Am J Clin Nutr. 2017;106:256–262. doi:10.3945/ajcn.116.149831
16. Yong RY, Mustaffa SB, Wasan PS, et al. Complex copy number variation of AMY1 does not associate with obesity in two East Asian cohorts. Hum Mutat. 2016;37:669–678. doi:10.1002/humu.22996
17. Selvaraju V, Babu JR, Geetha T. Association of salivary C-reactive protein with the obesity measures and markers in children. Diabetes Metab Syndr Obes. 2019;12:1239–1247. doi:10.2147/DMSO.S211624
18. Marquina C, Mousa A, Belski R, et al. Increased inflammation and cardiometabolic risk in individuals with low AMY1 copy numbers. J Clin Med. 2019;8(3):382. doi:10.3390/jcm8030382
19. de Onis M, Onyango AW, Borghi E, et al. Development of a WHO growth reference for school-aged children and adolescents. Bull World Health Organ. 2007;85:660–667. doi:10.2471/BLT.07.043497
20. Sharma AK, Metzger DL, Daymont C, et al. LMS tables for waist-circumference and waist-height ratio Z-scores in children aged 5–19 y in NHANES III: association with cardio-metabolic risks. Pediatr Res. 2015;78:723–729. doi:10.1038/pr.2015.160
21. Mejia-Benitez MA, Bonnefond A, Yengo L, et al. Beneficial effect of a high number of copies of salivary amylase AMY1 gene on obesity risk in Mexican children. Diabetologia. 2015;58:290–294. doi:10.1007/s00125-014-3441-3
22. Fortmann Stephen P, Ford E, Criqui Michael H, et al. CDC/AHA Workshop on markers of inflammation and cardiovascular disease: application to Clinical and Public Health Practice: report from the population science discussion group. Circulation. 2004;110:e554–e559. doi:10.1161/01.CIR.0000148982.95775.BF
23. Hubacek JA, Peasey A, Pikhart H, et al. APOE polymorphism and its effect on plasma C-reactive protein levels in a large general population sample. Hum Immunol. 2010;71:304–308. doi:10.1016/j.humimm.2010.01.008
24. Mathur N, Pedersen BK. Exercise as a mean to control low-grade systemic inflammation. Mediators Inflamm. 2008;2008:109502. doi:10.1155/2008/109502
25. Burnett MS, Devaney JM, Adenika RJ, et al. Cross-sectional associations of resistin, coronary heart disease, and insulin resistance. J Clin Endocrinol Metab. 2006;91:64–68. doi:10.1210/jc.2005-1653
26. Chen BH, Song Y, Ding EL, et al. Circulating levels of resistin and risk of type 2 diabetes in men and women: results from two prospective cohorts. Diabetes Care. 2009;32:329–334. doi:10.2337/dc08-1625
27. Heidemann C, Sun Q, van Dam RM, et al. Total and high-molecular-weight adiponectin and resistin in relation to the risk for type 2 diabetes in women. Ann Intern Med. 2008;149:307–316. doi:10.7326/0003-4819-149-5-200809020-00005
28. Liu GL, Fu XH, Jiang LH, et al. Serum resistin concentration and insulin resistance in obese children. Zhonghua Er Ke Za Zhi. 2006;44:114–117.
29. Norata GD, Ongari M, Garlaschelli K, et al. Plasma resistin levels correlate with determinants of the metabolic syndrome. Eur J Endocrinol. 2007;156:279–284. doi:10.1530/eje.1.02338
30. Osawa H, Ochi M, Tabara Y, et al. Serum resistin is positively correlated with the accumulation of metabolic syndrome factors in type 2 diabetes. Clin Endocrinol (Oxf). 2008;69:74–80. doi:10.1111/j.1365-2265.2007.03154.x
31. Singh AK, Tiwari S, Gupta A, et al. Association of resistin with metabolic syndrome in Indian subjects. Metab Syndr Relat Disord. 2012;10:286–291. doi:10.1089/met.2011.0128
32. Christiansen T, Richelsen B, Bruun JM. Monocyte chemoattractant protein-1 is produced in isolated adipocytes, associated with adiposity and reduced after weight loss in morbid obese subjects. Int J Obes (Lond). 2005;29:146–150. doi:10.1038/sj.ijo.0802839
33. Fu CP, Sheu WH, Lee IT, et al. Weight loss reduces serum monocyte chemoattractant protein-1 concentrations in association with improvements in renal injury in obese men with metabolic syndrome. Clin Chem Lab Med. 2015;53:623–629. doi:10.1515/cclm-2014-0468
34. Sartipy P, Loskutoff DJ. Monocyte chemoattractant protein 1 in obesity and insulin resistance. Proc Natl Acad Sci U S A. 2003;100:7265–7270. doi:10.1073/pnas.1133870100
35. Cao H. Adipocytokines in obesity and metabolic disease. J Endocrinol. 2014;220:T47–T59. doi:10.1530/JOE-13-0339
36. Choi YJ, Nam YS, Yun JM, et al. Association between salivary amylase (AMY1) gene copy numbers and insulin resistance in asymptomatic Korean men. Diabet Med. 2015;32:1588–1595. doi:10.1111/dme.12808
37. Arredouani A, Stocchero M, Culeddu N, et al. Metabolomic profile of low-copy number carriers at the salivary alpha-amylase gene suggests a metabolic shift toward lipid-based energy production. Diabetes. 2016;65:3362–3368. doi:10.2337/db16-0315
 © 2020 The Author(s). This work is published and licensed by Dove Medical Press Limited. The full terms of this license are available at https://www.dovepress.com/terms.php and incorporate the Creative Commons Attribution - Non Commercial (unported, v3.0) License.
By accessing the work you hereby accept the Terms. Non-commercial uses of the work are permitted without any further permission from Dove Medical Press Limited, provided the work is properly attributed. For permission for commercial use of this work, please see paragraphs 4.2 and 5 of our Terms.
© 2020 The Author(s). This work is published and licensed by Dove Medical Press Limited. The full terms of this license are available at https://www.dovepress.com/terms.php and incorporate the Creative Commons Attribution - Non Commercial (unported, v3.0) License.
By accessing the work you hereby accept the Terms. Non-commercial uses of the work are permitted without any further permission from Dove Medical Press Limited, provided the work is properly attributed. For permission for commercial use of this work, please see paragraphs 4.2 and 5 of our Terms.