")
Back to Journals » Drug Design, Development and Therapy » Volume 15
Safety, Tolerability and Pharmacokinetics of Single and Multiple Ascending Doses of Benfotiamine in Healthy Subjects
Authors Sheng L , Cao W, Lin P, Chen W, Xu H, Zhong C, Yuan F, Chen H , Li H, Liu C , Yang M, Li X
Received 23 December 2020
Accepted for publication 19 February 2021
Published 9 March 2021 Volume 2021:15 Pages 1101—1110
DOI https://doi.org/10.2147/DDDT.S296197
Checked for plagiarism Yes
Review by Single anonymous peer review
Peer reviewer comments 2
Editor who approved publication: Professor Anastasios Lymperopoulos
Lei Sheng,1,* Wei Cao,2,* Pingping Lin,3 Weili Chen,1 Hongrong Xu,1 Chunjiu Zhong,4 Fei Yuan,1 Hanjing Chen,1 Hui Li,1 Chao Liu,1 Mengjie Yang,1 Xuening Li1
1Department of Clinical Pharmacology, Zhongshan Hospital, Fudan University, Shanghai, 200032, People’s Republic of China; 2Shanghai Rixin Biotechnology Co., Ltd, Shanghai, 200237, People’s Republic of China; 3Phase I Clinical Research Center, The Affiliated Hospital of Qingdao University, Shandong, 266071, People’s Republic of China; 4Department of Neurology, Zhongshan Hospital, Fudan University, Shanghai, 200032, People’s Republic of China
*These authors contributed equally to this work
Correspondence: Xuening Li
Department of Clinical Pharmacology, Zhongshan Hospital, Fudan University, 180 FengLin Road, Shanghai, 200032, People’s Republic of China
Tel +86 21 3158 7860
Fax +86 21 6443 7963
Email [email protected]
Purpose: Safety, tolerability and pharmacokinetics of single and multiple ascending doses (SADs/MADs) of benfotiamine were assessed after oral administration in two randomized, double-blind, placebo-controlled, phase I trials.
Methods: Healthy subjects were sequentially enrolled into one of five SAD (150– 1200 mg) or three MAD (150, 300 or 600 mg) cohorts. In SAD study, each cohort of 12 subjects (n = 10, active; n = 2, placebo) were administrated once-daily doses. In MAD study, each cohort of 16 subjects (n = 12, active; n = 4, placebo) were administrated once-daily on day 1 and twice-daily on day 4– 9, followed by a single morning dose on day 10.
Results: In the SAD study, the median time to reach maximum concentration (Tmax) arrived 1.0 to 2.0 h for thiamine (TM), 3.5 to 8.0 h for thiamine monophosphate (TMP), and 8.0 to 24.0 h for thiamine diphosphate (TDP) after administration of benfotiamine. The area under concentration-time curve from 0 to last measurable concentration (AUC0-t) or maximum observed concentration (Cmax) of TM, TMP, and TDP was less or more dose proportional over the single dose studied except Cmax of TM. Food consumption did not increase the level of TM and TDP at baseline. TM exhibited a relatively long elimination half-life (t1/2) in all doses studied, resulting in accumulation ratio (Rac) of 1.96 to 2.11 and accumulation ratio based on Cmax (Rac, Cmax) of 1.60 to 1.88 following 7 days of multiple dosing. Comparable accumulation results were also obtained for TDP after multiple dosing. The incidence and severity of adverse events (AEs) were similar between benfotiamine and placebo. The commonly reported drug-related AEs were increased ALT and urinary WBC.
Conclusion: Both SAD and MAD studies of benfotiamine in healthy subjects were safe and well tolerated. TM and TDP exhibited moderate accumulation on repeated administration of benfotiamine.
Keywords: Alzheimer’s disease, benfotiamine, thiamine, thiamine diphosphate, pharmacokinetics
Introduction
Alzheimer’s disease (AD) is typically characterized as a sever, chronic and multifactorial neurodegenerative disease that causes progressive memory loss and cognitional dysfunction.1 Unfortunately, the currently approved drugs for AD used as cholinesterase inhibitors (rivastigmine, donepezil, and galantamine), N-methyl-D-aspartate antagonist (memantine) or even combinations of multiple agents have led to a temporary decline in the loss of cognitive function and a short improvement of quality of life, and have not stopped the deteriorating progression of AD.2 To date, an increasing number of drug candidates aiming to treat AD have failed during phase I to III clinical trials.3–5 As such, it is urgent to develop promising therapies that treat affected patients and to prevent, slow the progression, or improve cognitive and behavioral symptoms of AD.
Benfotiamine (S-benzoylthiamine O-monophosphate), a synthetic S-acyl derivative of thiamine, has been proved to have multifaceted therapeutic potential through multiple ways.6 Benfotiamine is mainly dephosphorylated in the intestinal mucosal cells to generate a lipid-soluble compound, S-benzoythiamine.7 S-benzoythiamine can be promptly transformed to water-soluble thiamine (TM) and further transformed to several phosphorylated metabolites, such as thiamine monophosphate (TMP) and thiamine diphosphate (TDP).8,9 A growing body of evidence has demonstrated that benfotiamine appears to have a therapeutic role in type 2 diabetes and diabetic complications, including neuropathies and nephropathies.6,8,10,11 Other reports suggest that benfotiamine can reverse cardiomyocyte contractile dysfunction and reduce the neuropathic pain.12–14
In spite of beneficial effects mentioned above, it also has been proposed as a protective agent for AD treatment based on the prevention of abnormal glucose metabolism.10,15 Previous studies have demonstrated that benfotiamine could attenuate the glucose-induced increase in Aβ synthesis in in vitro studies,15,16 and that it also could decrease the tau hyperphosphorylation and improve cognitive deficits in animal AD model.15,17 Further study has shown that it has cognitive improvement in patients with mild to moderate AD.18,19
The present article describes the results of these two randomized, double-blinded, placebo-controlled, phase I studies to evaluate the safety, tolerability, and pharmacokinetics of benfotiamine following oral administration of single and multiple ascending doses, and to explore the effect of food on benfotiamine metabolites in healthy volunteers.
Methods
Investigational Products
Benfotiamine is S-benzoylthiamine O-monophosphate, a synthetic S-acyl derivative of thiamine provided by Shanghai Rixin Biotechnology Co., Ltd (Shanghai, China) with a purity level of 97.6%. Benfotiamine and its matching placebo were formulated by shanghai shynedc pharmaceutical Co., Ltd (Shanghai, China) as immediate-release 50 mg tablets for oral administration. Study drugs were stored according to the manuscripts’ instruction at a controlled room temperature.
Study Design
These randomized, double-blinded, placebo-controlled, phase I studies consisted of two studies: the single ascending dose (SAD) study (clinical trial registration number: CTR20170293) and the multiple ascending dose (MAD) study (clinical trial registration number: CTR20171266).
Both studies were conducted at a single study site, Phase I clinical trial ward, Zhongshan Hospital, Fudan University, Shanghai, China. The two studies were approved by an Independent Ethics Committee of Zhongshan Hospital of Fudan University in Shanghai, China (approval number: 2017-092; 2017-014R) and conducted in accordance with the International Conference of Harmonisation for Good Clinical Practice and the Declaration of Helsinki. Subjects provided written informed consents prior to initiation of any study-specific procedures. The main objectives of the studies were to evaluate the safety, tolerability, and pharmacokinetics of SAD and MAD of benfotiamine. Because TM, TMP and TDP are endogenous compounds in humans, it was hypothesized that daily food consumption may have an impact on the baseline concentration of benfotiamine metabolites. Therefore, sampling collection on day-1 was added to explore the effect of the standard meal on the baseline concentration of benfotiamine metabolites in the SAD study.
Male and female subjects were eligible for participation if they were aged 18–45 years with a body weight (BMI) between 18 and 26 kg/m2, and if considered by the investigator to be in good health based on medical history, complete physical examination, vital signs, electrocardiogram (ECG) and clinical laboratory tests. Subjects were excluded from the study if they had a history of alcohol abuse, had a history of psychotropic drug or tobacco use, or had participated in any other investigational drug study within three months. Additionally, subjects were excluded if they had a QTcB interval > 450 msec as calculated by ECG equipment and evaluated by the investigator, and if they were unwilling or unable to practice an acceptable method of contraception in the next three months after the end of the study. Female subjects were excluded if they were breastfeeding or pregnant, as determined by human chorionic gonadotropin (HCG) test during screening or prior to receiving the first dose (day-2, SAD study; day-1, MAD study).
In the SAD study, eligible subjects were sequentially assigned to one of five dose (150, 300, 600, 900 or 1200 mg) cohorts. Each cohort of subjects were randomly assigned in a 5:1 ratio to receive either a single oral dose of active (n = 10) or placebo (n = 2) treatment. All subjects were admitted to the study site in the afternoon of day-3 (admission day, 3 days before dosing) to standardize lifestyle. The inclusion/exclusion criteria including vital signs and 12-lead ECG were finally checked on day-2. After fasting overnight for at least 10 h, blood samples for pharmacokinetics were collected in a period of 12 h on day-1 in fed and fasting condition. Benfotiamine or matching placebo was administrated on day 1 in the same fasting condition, followed by another pharmacokinetic sampling period of 48 h. Subjects were discharged from the study site on day 3.
The MAD study consisted of three dose (150, 300, 600 mg) cohorts in which subjects received once-daily dose on day 1 and twice daily doses (BID) at 12-hourly intervals on day 4–9 with a last dose on the morning of day 10. Subjects were randomized in a 3:1 ratio to benfotiamine (n = 12) or placebo (n = 4). All subjects were admitted to the study site on day-2 and discharged on day 13 after completion of the final assessment. The inclusion/exclusion criteria were checked before randomization on day-1.
In both studies, standard breakfast, lunch and dinner were served after examination and sampling. Dose escalation occurred after review of safety, tolerability of previous dose levels. Subjects were assigned to treatment doses according to a randomization list provided by an independent pharmacist.
Safety Assessments
Safety monitoring was performed during the study by using vital signs (pulse rate, blood pressure, respiratory rate and ear temperature) and 12-lead ECG before dosing and at selected times. Physical examination and clinical laboratory tests (hematology, blood biochemistry and urinalysis) were also performed at screening and at the end of the study. Adverse events (AEs) were monitored and evaluated by the investigator throughout the study. The AEs were defined in accordance with the Common Terminology Criteria for Adverse Events (CTCAE) version 4.03.
Pharmacokinetic Methods
During the SAD study, serial blood samples for metabolites (TM, TMP and TDP) of benfotiamine were collected on day-1 (predose, 0.25, 0.5, 1, 1.5, 2, 2.5, 3, 3.5, 4, 6, 8, and 12 h) and day 1 (predose, 0.25, 0.5, 1, 1.5, 2, 2.5, 3, 3.5, 4, 6, 8, 12, 24, 36, and 48 h). For the MAD cohorts, serial blood samples were collected on day 1 and day 10 (predose, 0.25, 0.5, 1, 1.5, 2, 2.5, 3, 3.5, 4, 6, 8, 12, 24, 36, 48, and 72 h), and before the morning dose on day 7–9.
The collected blood samples were immediately transferred under the ice water condition. After transferring, an aliquot (800 μL) of each blood sample was pipetted into a polypropylene tube, vortexed at room temperature accompanied by the addition of an equal volume (800 μL) of 6.8% perchlorate. After a thorough mixing of the 1.6 mL acidulated blood sample by vortexing, an aliquot (800 μL) of the sample was pipetted into a second polypropylene tube and stored at −70°C until analysis. TM, TMP and TDP concentrations in whole blood were determined using a validated HPLC-fluorescence detector (HPLC-FLD) with Lower Limit of Quantification (LLOQ) of 1.5 ng/mL, 1.0 ng/mL, and 40 ng/mL, respectively.
Pharmacokinetic and Statistical Analyses
In the SAD study, the baseline-adjusted concentration of each benfotiamine metabolite (TM, TMP or TDP) was calculated as the difference between the concentration at the selected time point on day 1–3 and the concentration at the corresponding time point on day-1. For instance, the baseline-adjusted concentration of TM at 36 h after dosing was calculated as the difference between the unadjusted concentration of TM at 36 h after dosing and the concentration of TM at 12 h on day-1; the baseline-adjusted concentration of TM at 24 h after dosing was calculated as the difference between the unadjusted concentration of TM at 24 h after dosing and the concentration of TM at predose on day-1. In the MAD study, the baseline-adjusted concentration of each benfotiamine metabolite (TM or TDP) was calculated as the difference between the unadjusted concentration of each metabolite at the selected time point after dosing and the concentration of each metabolite at predose before dosing.
PK parameters for TM, TMP, and TDP after oral single and multiple doses of benfotiamine were calculated via non-compartmental methods using Phoenix WinNonlin software version 6.2.1 (Pharsight Corporation, Mountain View, CA, USA). For TM, TMP, and TDP, the pharmacokinetic parameters for SAD were as follows: the area under concentration-time curve from 0 to last measurable concentration (AUC0-t), maximum observed concentration (Cmax), time to reach maximum concentration (Tmax), apparent oral clearance (CL/F), elimination half-life (t1/2), and apparent volume of distribution (Vd/F). For MAD study, AUC0-t, Cmax, Tmax, t1/2, CL/F, Vd/F, the area under the curve during one dosing interval at the steady state (AUC0-τ), minimum concentration at the steady state (Cmin), the average steady-state concentration during multiple dosing (Cav), accumulation ratio (Rac), and accumulation ratio based on Cmax (Rac,Cmax) on TM and TDP were estimated. The Cmax and Tmax were obtained directly from the observed data.
All subjects who received at least one dose were evaluated for tolerability. All subjects received benfotiamine who had at least one measurable PK concentration were included in PK analysis. Cmax, AUC0-t, and AUC0-τ were logarithmically transformed before analysis. Dose proportionality for Cmax, AUC0-t, and AUC0-τ was assessed using a power model from which the mean slope was estimated and the corresponding 90% confidence interval (CI) was calculated by restricted maximum likelihood using SPSS19.0. Dose proportionality was observed if the slope was not statistically significantly different from unity. Placebo data were pooled and analyzed from the SAD or MAD study. Differences in PK parameters were assessed between groups using analysis of variance, while differences in PK parameters were assessed between male and female subjects using student’s t-test.
Results
Subject Disposition and Demographics
In the studies, healthy Chinese subjects (33 males and 27 females, SAD study; 24 males and 24 females, MAD study) were enrolled into treatment groups and completed the study as planned. In the MAD study, one subject in the 150 mg group who completed the study as planned is included in safety analysis, not in PK analysis, because of QTcB > 450 msec at baseline (day-1) that meets the criteria for exclusion. Their demographic and baseline characteristics appeared to be comparable across treatment groups (Table 1).
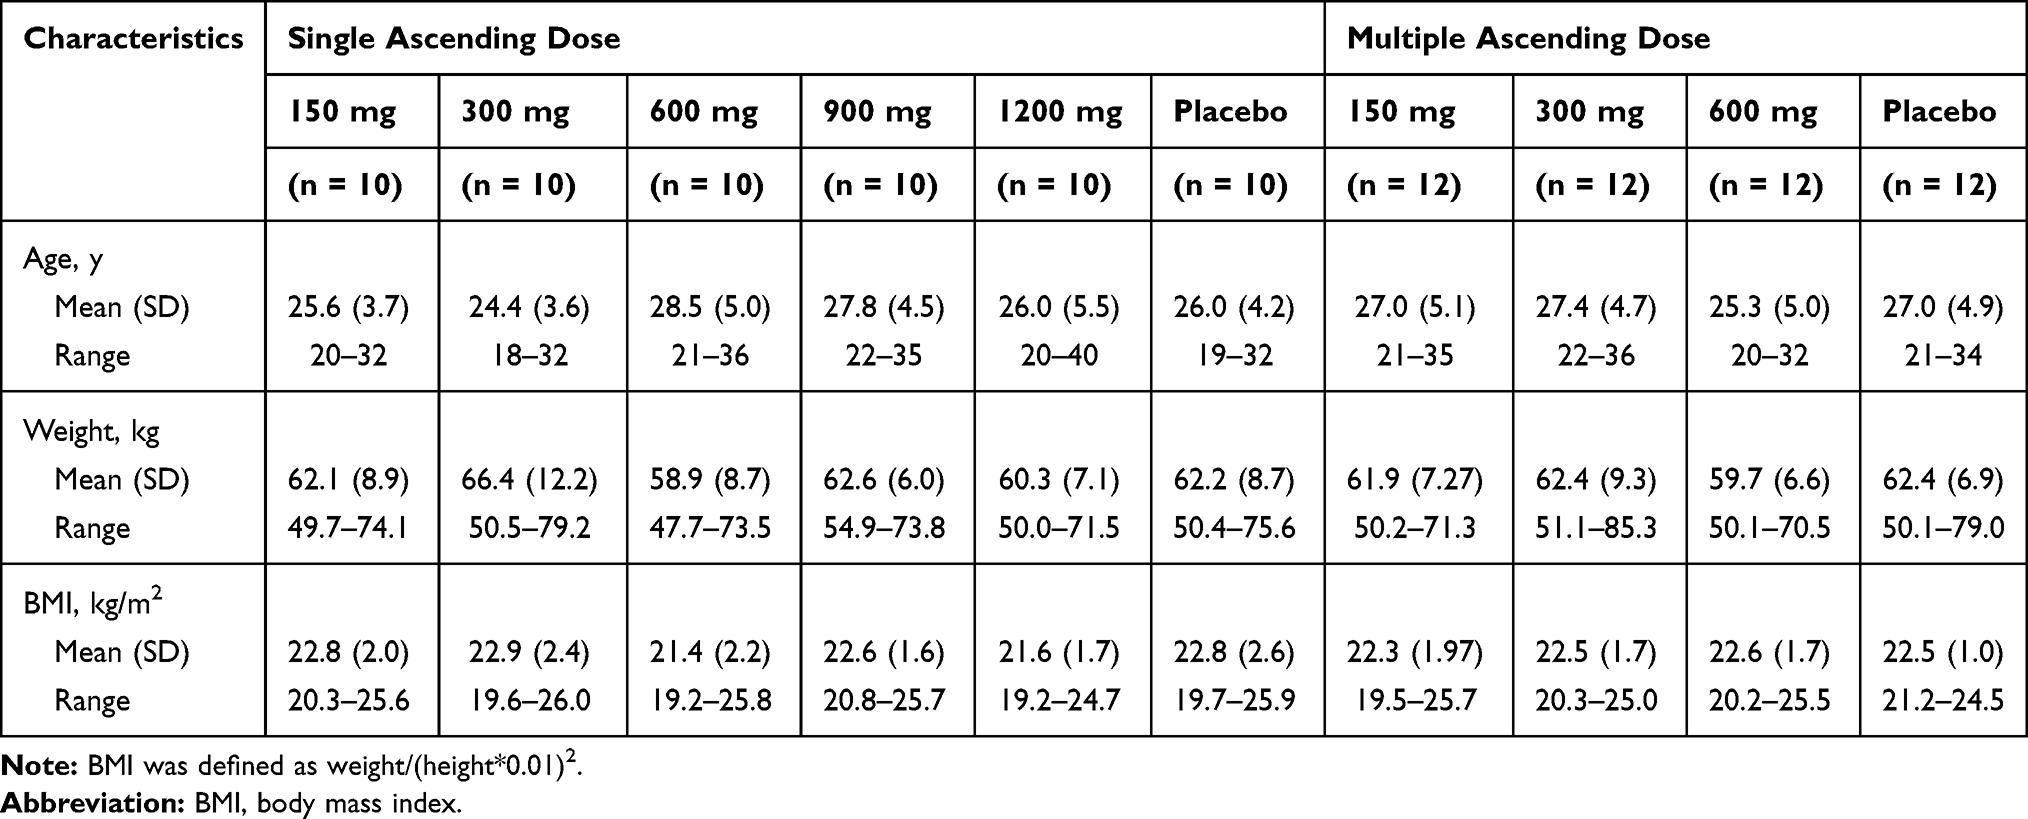 |
Table 1 Demographics and Baseline Characteristics |
Safety
A total of 12 (20%) subjects reported at least one AE during the SAD study. Twelve subjects reported AEs that were considered to be drug-related, including 9 (18%) of 50 subjects with the treatment of benfotiamine and 3 (30%) of 10 subjects with the treatment of placebo (Table 2). The most frequently reported drug-related AE was increased ALT, which was reported by 2 (4%) benfotiamine subjects and 1 (10%) placebo subject. Urinary WBC was reported by 2 (4%) of 32 subjects who received the active treatment. The overall incidence of AEs with benfotiamine was similar to that reported with placebo (20%).
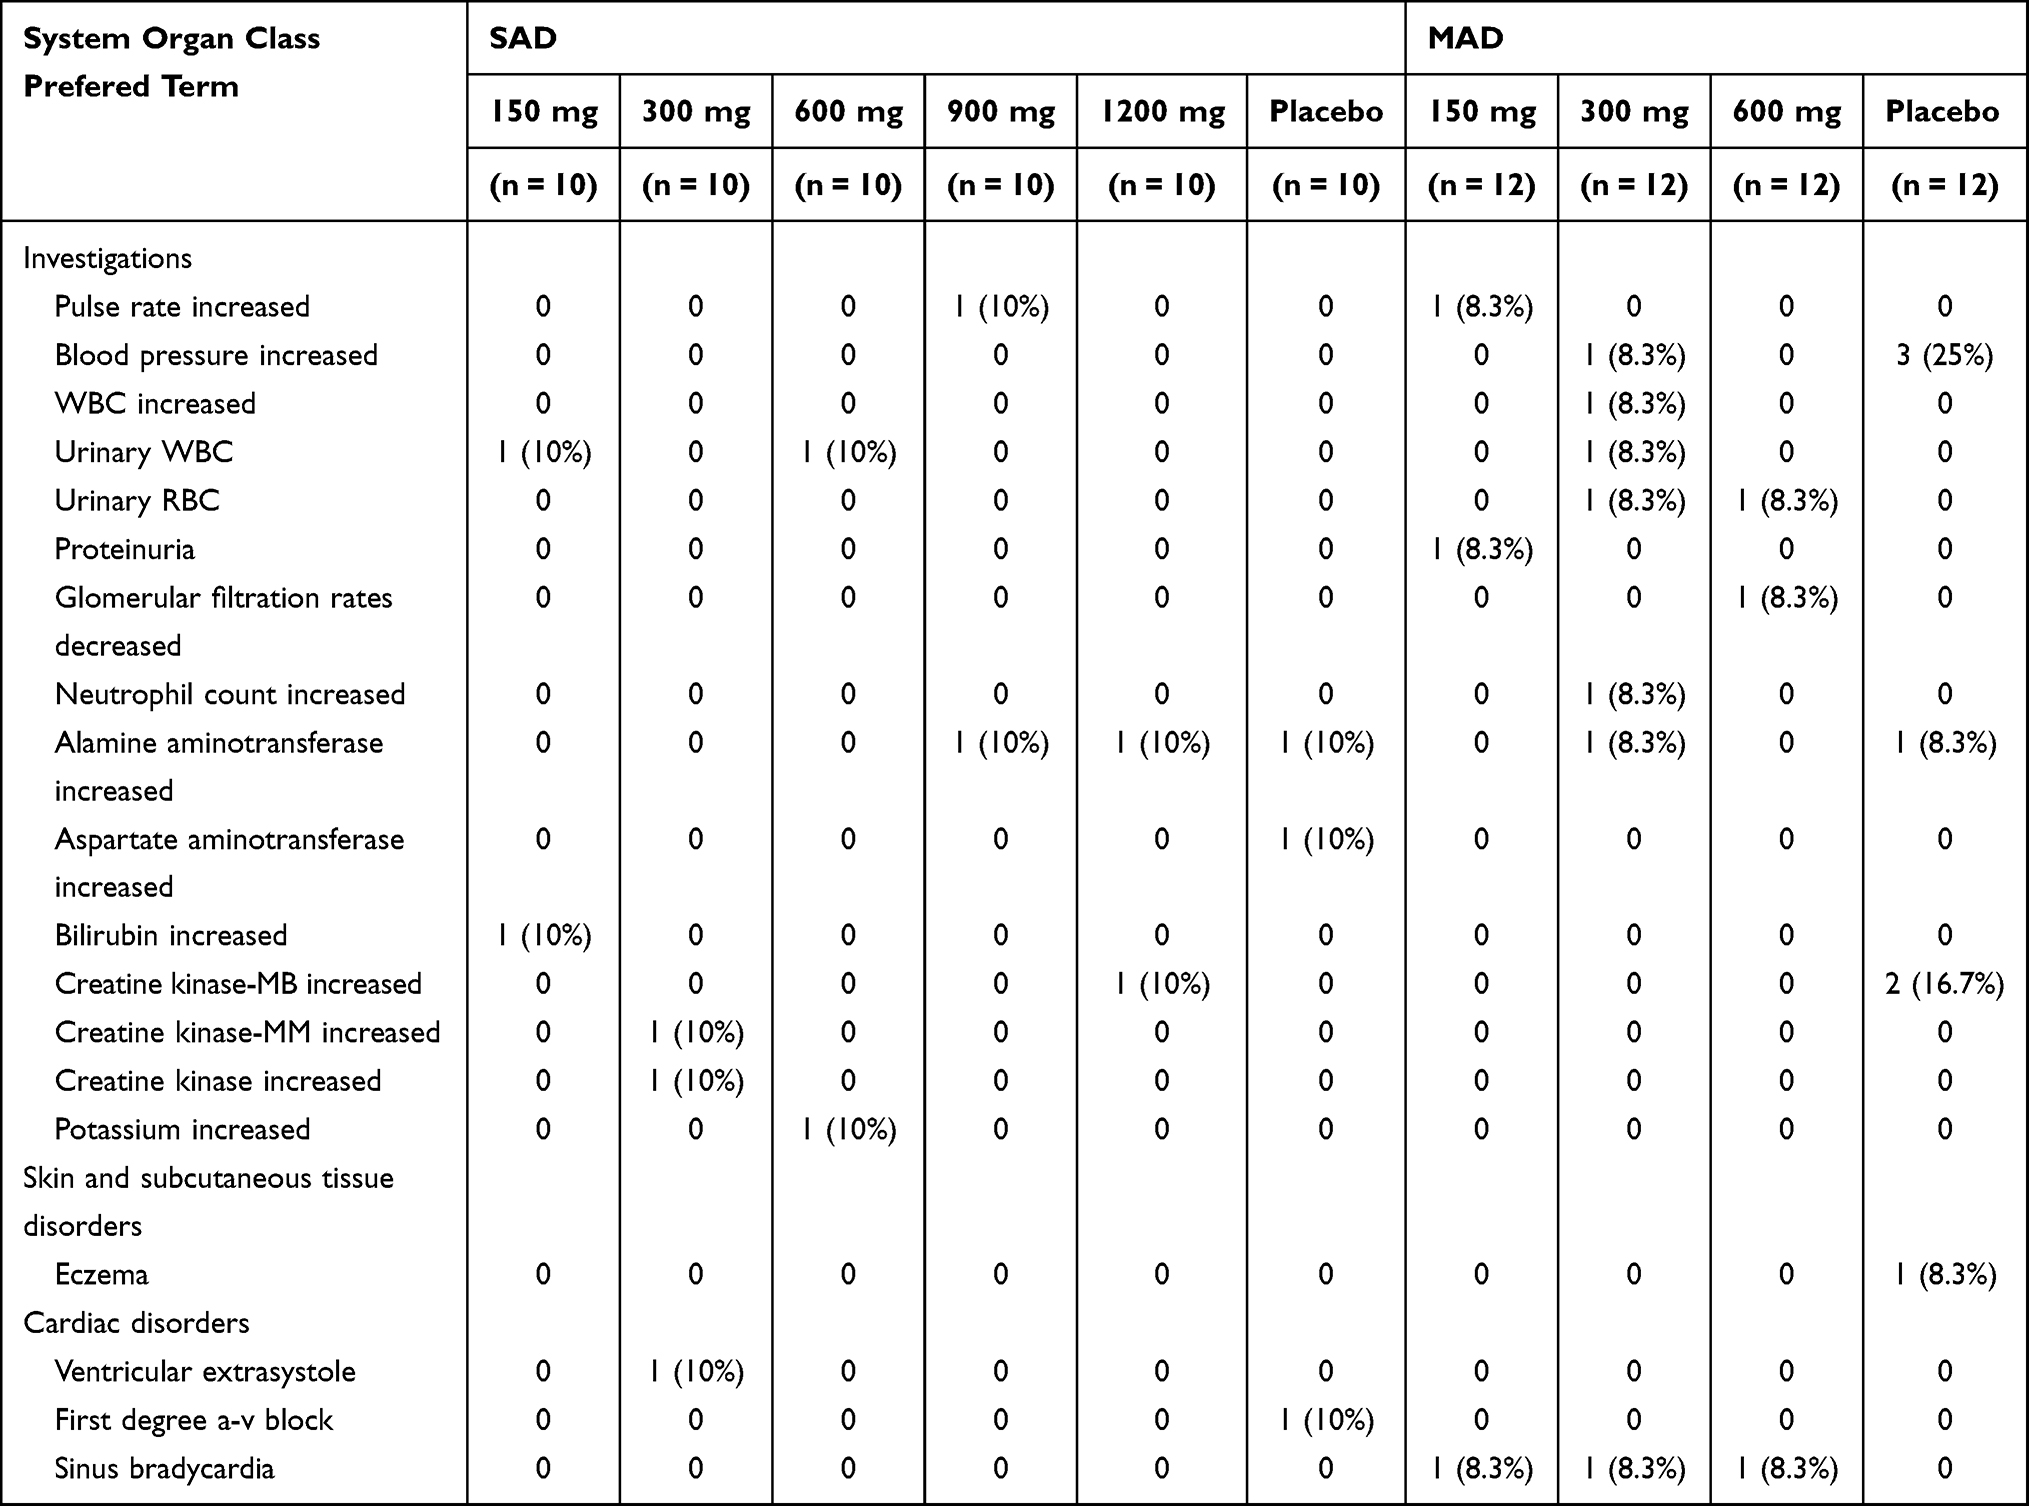 |
Table 2 Adverse Events Following Single and Multiple Ascending Doses (SADs/MADs) of Benfotiamine in Healthy Subjects |
Of the 48 subjects, 17 (35%) reported a total of 23 AEs following multiple doses of 150 (4/12), 300 (5/12), 600 mg (3/12) benfotiamine, and placebo (5/12), respectively (Table 2). The most frequently reported drug-related AE was increased blood pressure, reported by 1 (3%) of 36 subjects who received the active treatment and 3 (25%) of 12 subjects who received the placebo treatment. Sinus bradycardia and urinary RBC were reported by 3 (8%) and 2 (6%) of 36 subjects who received benfotiamine, respectively. Increased pulse rate, increased WBC, urinary WBC, proteinuria and increased ALT were each reported in 1 (3%) of 36 subjects who received benfotiamine. The incidence of AEs at the 300 mg dose level was similar to that at the placebo (41.7%); the lower incidence reported in the 150 and 600 mg dose level was 33.3% and 25.0%, respectively.
Overall, all reported AEs in both studies were mild or moderate in severity. There were no serious AEs, and no subjects discontinued because of an AE in both SAD and MAD study.
Pharmacokinetic Results
Mean main metabolite (TM, TMP and TDP) concentration versus time following SAD and MAD of benfotiamine is presented in Figures 1 and 2, and its derived pharmacokinetic characteristics are summarized descriptively in Tables 3 and 4.
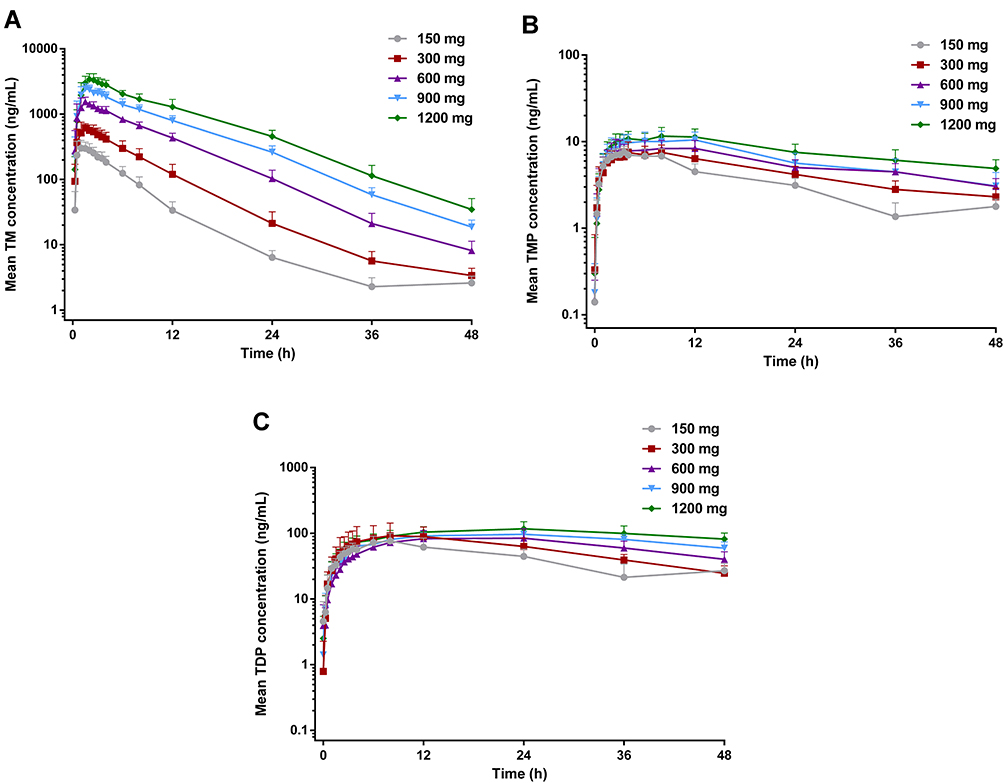 |
Figure 1 Mean blood concentrations of TM (A), TMP (B), and TDP (C) versus time after a single oral administration to healthy subjects at five different doses (n=10 per dose group). |
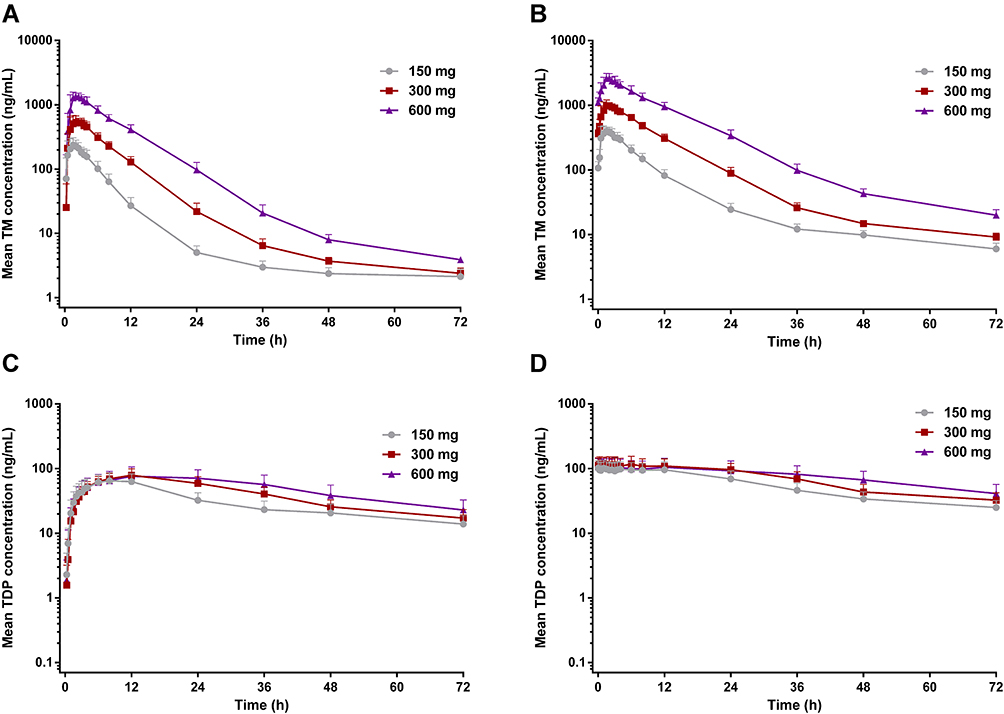 |
Figure 2 Mean blood concentrations of TM and TDP versus time after the first dose on day 1 (A and C) and the last dose on day 10 (B and D) to healthy subjects at three different doses (n=12 per dose group). |
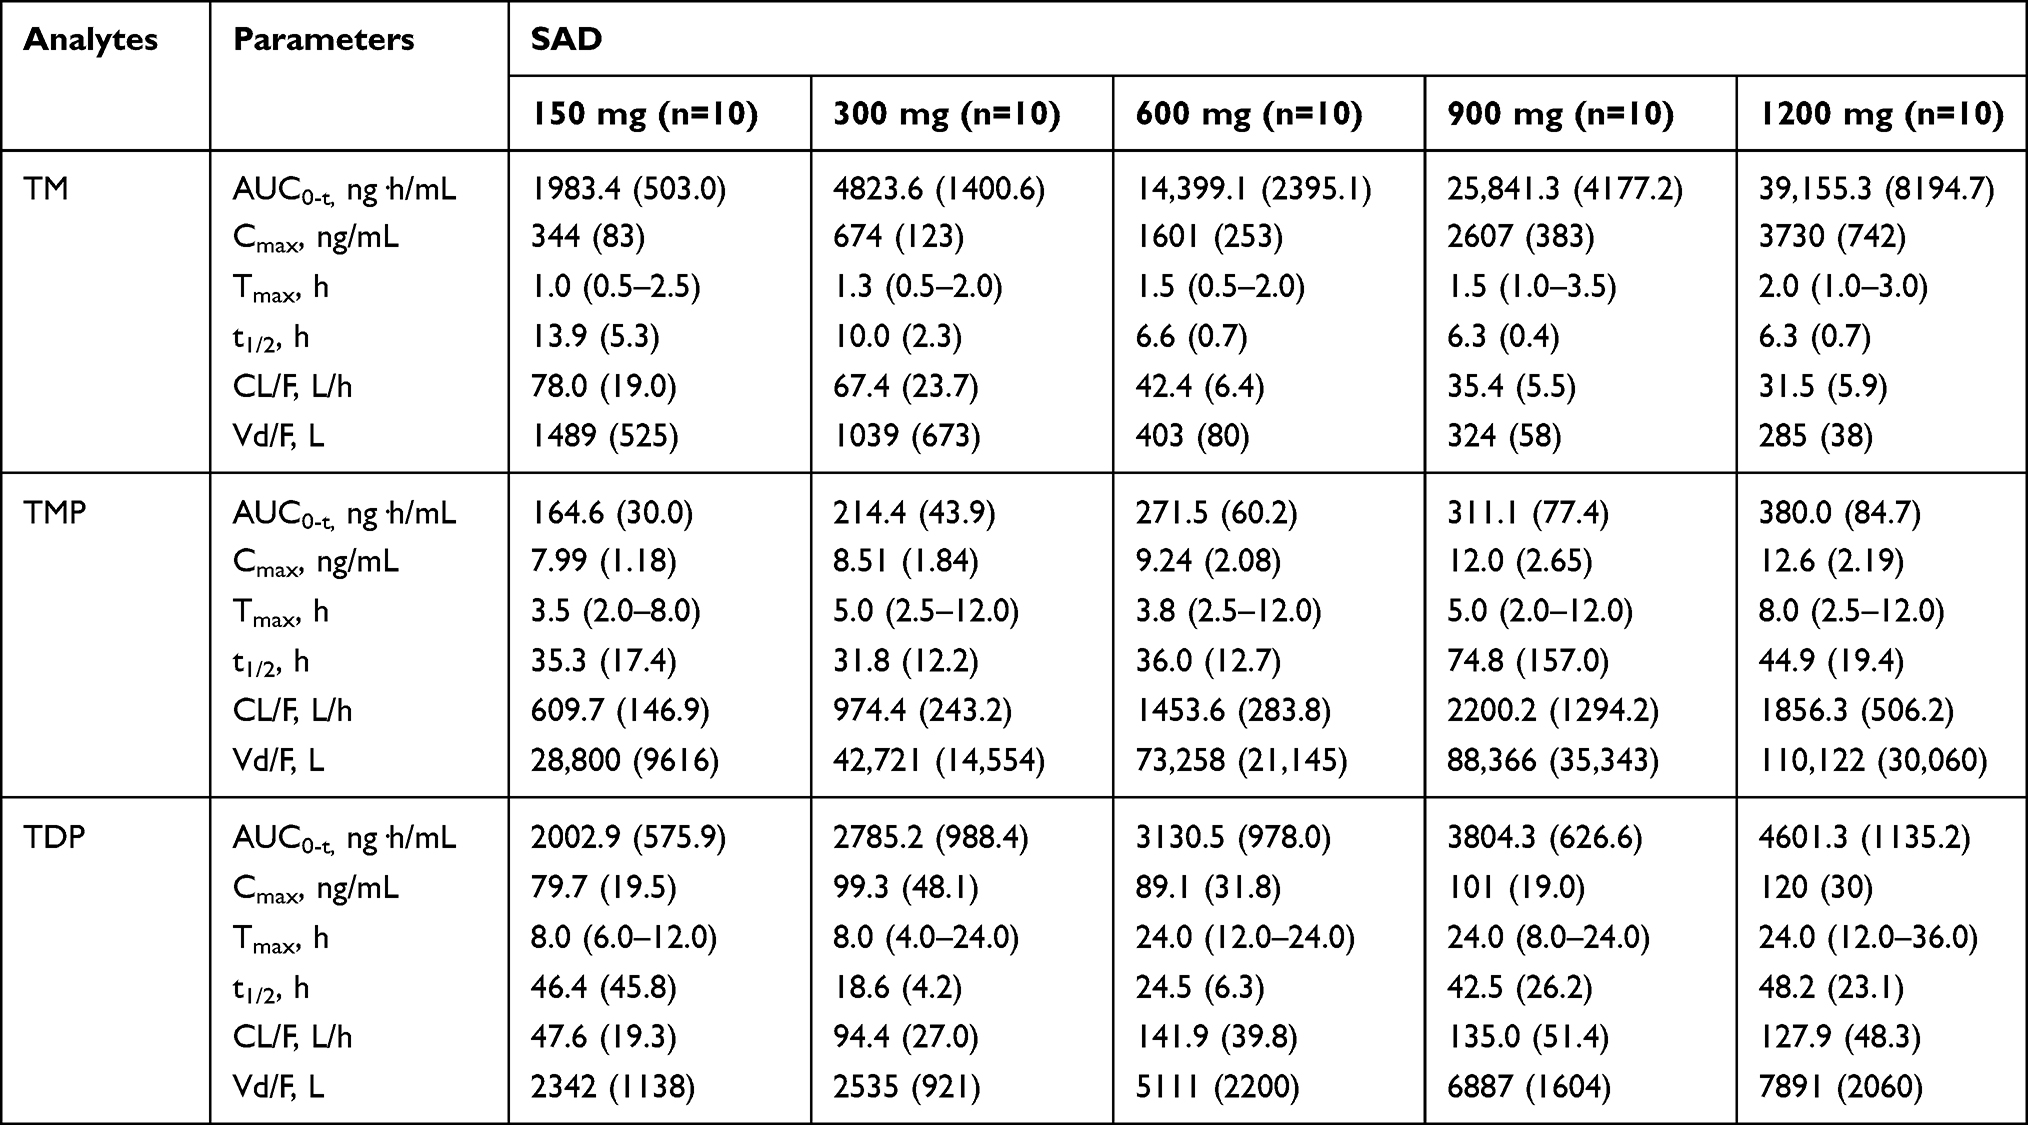 |
Table 3 Summary of Pharmacokinetic Parameters for Single Ascending Dose (SAD) of Benfotiamine |
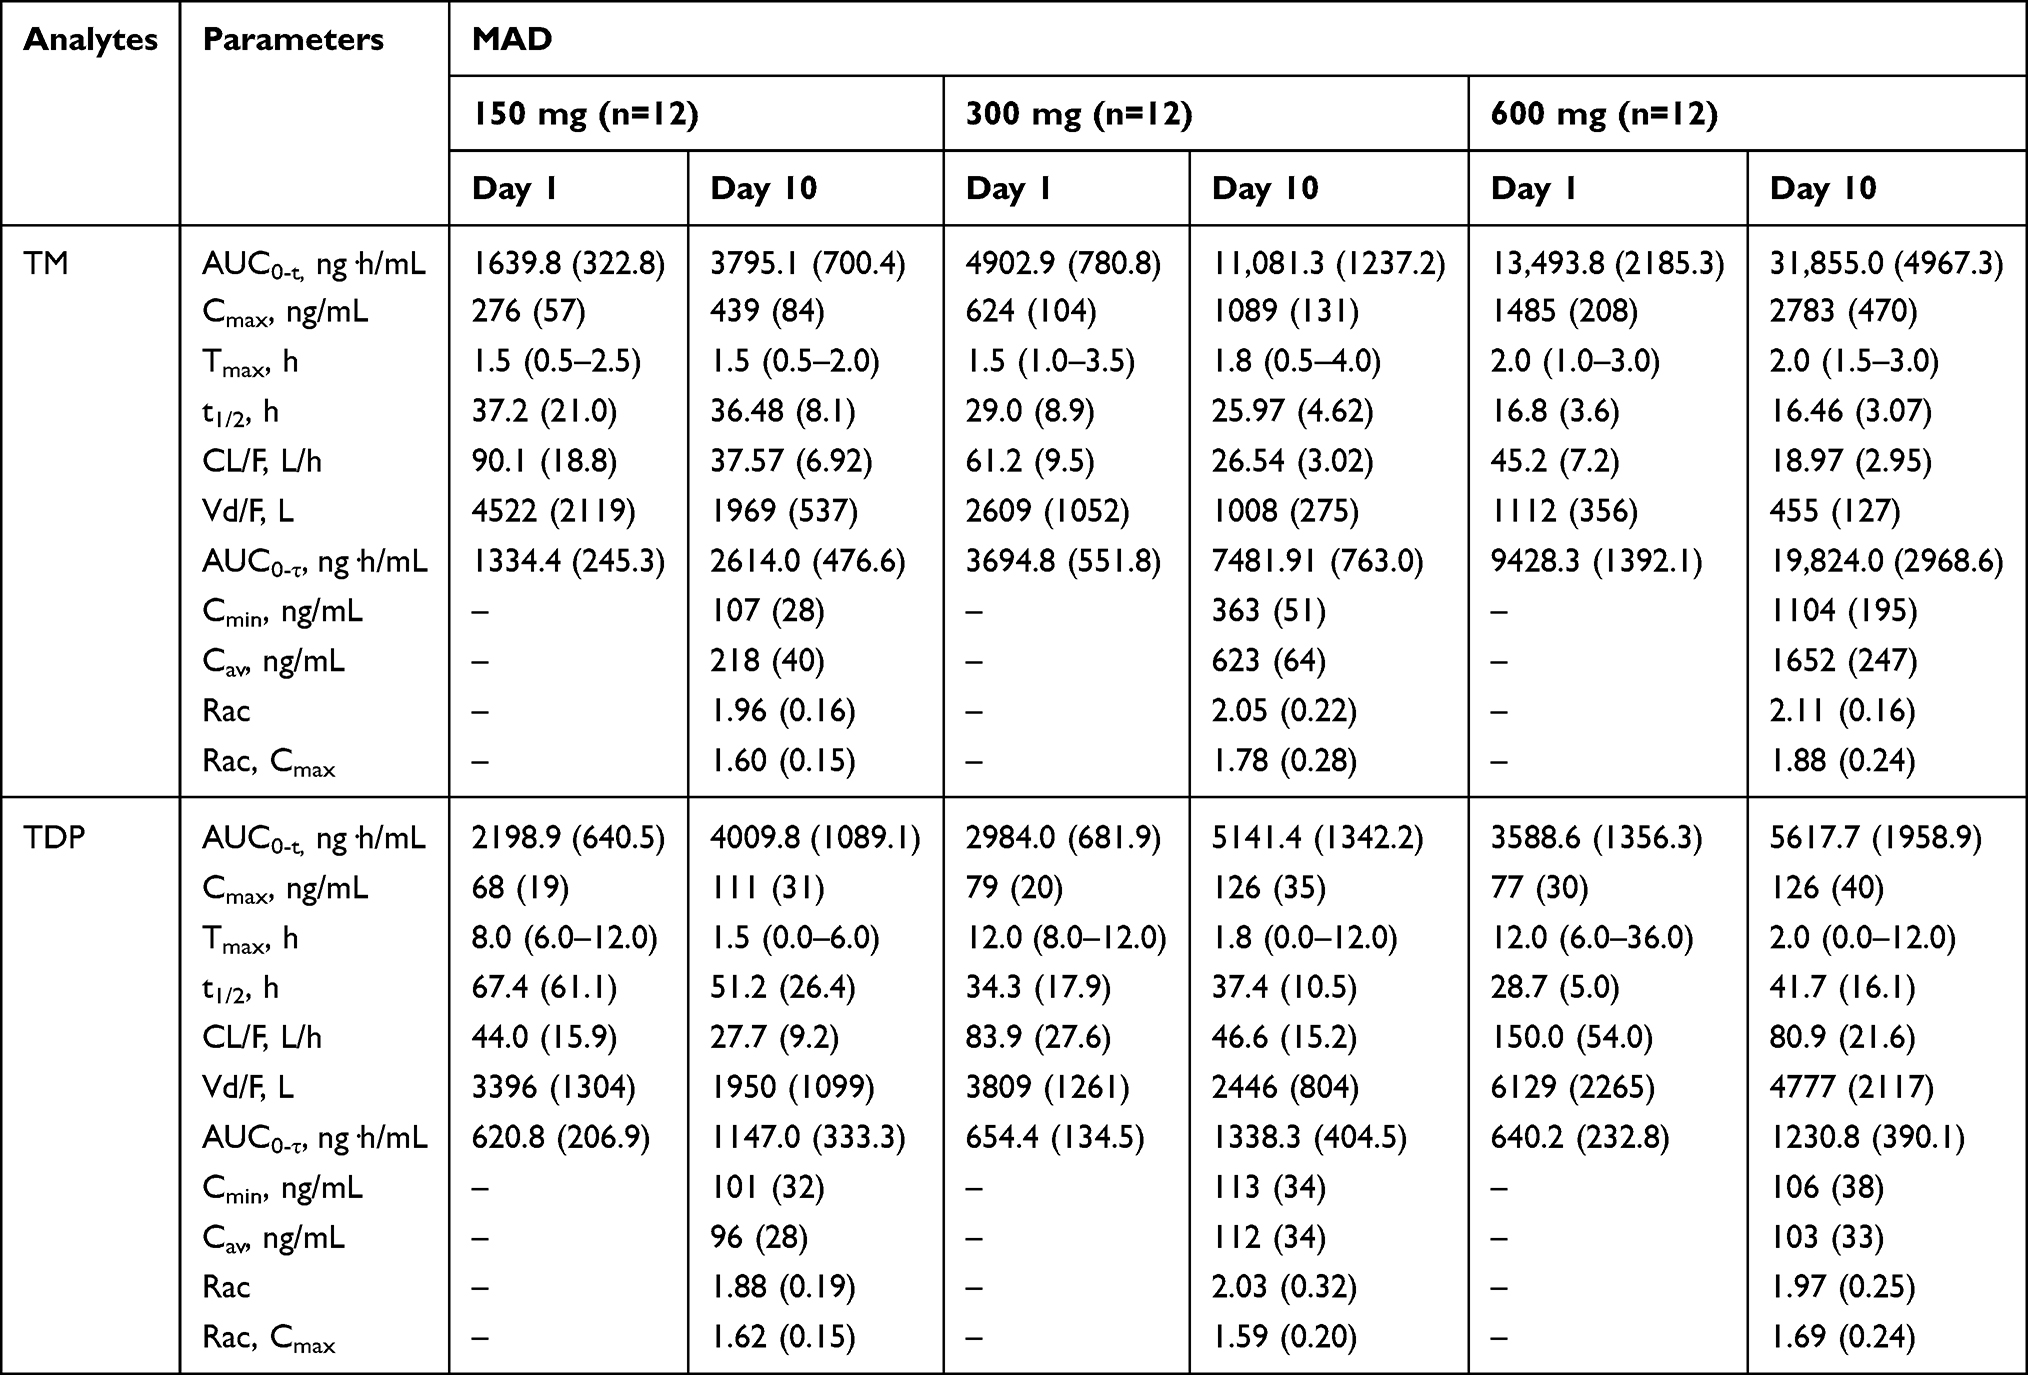 |
Table 4 Summary of Pharmacokinetic Parameters for Multiple Ascending Dose (MAD) of Benfotiamine |
Food Effect on the Main Metabolites in the SAD Study
In the SAD study, TM concentration on day-1 at collected time points was still below the LLOQ either under the fasted or fed state except very few time points (~ 2.6%), while mean level of TMP in the fasted or fed condition was 1.6 or 2.3 ng/mL, respectively, indicating an obvious increase of TMP concentration after meals. As for TDP concentration, it had a minor increase after meals, with the percentage change ranged from 0.88 to 4.86% (data not shown).
Single Ascending Doses
In the SAD study, median Tmax arrived 1.0 to 2.0 h for TM, 3.5 to 8.0 h for TMP, and 8.0 to 24.0 h for TDP after administration of benfotiamine. At each dose group, the exposure of TM was the highest among these metabolites of benfotiamine; AUC0-t of TM was 12.1 to 103 or 0.99 to 8.51 times higher than the corresponding AUC0-t of TMP or TDP, respectively. Similar to the AUC0-t, Cmax of TM was 43.1 to 295 or 4.32 to 31.2 times higher than the corresponding Cmax of TMP or TDP, respectively. After attainment of Cmax, the disposition of TM generally revealed a multiphasic rise with a mean t1/2 of 13.9 to 10.0 h at the lower doses (150 and 300 mg), and a shorter t1/2 of 6.6 to 6.3 h was observed at the higher doses (600–1200 mg). Compared with TM, the other metabolites were eliminated slowly, with the mean t1/2 > 31.8 h for TMP and t1/2 > 18.6 h for TDP at the same dose range (Table 3).
The proportionality coefficients for AUC0-t and Cmax of TM were 1.462 (90% CI, 1.392–1.532) and 1.163 (90% CI, 1.106–1.220), respectively, indicating more than proportional increase in AUC0-t and dose-proportional increase in Cmax with increasing dose. As for TMP and TDP, there were less than proportional increases in AUC0-t and Cmax with increasing doses. Furthermore, no gender-related difference was found in the pharmacokinetic properties, except in Cmax of TDP in the 600 mg dose group or AUC0-t and Cmax of TMP in the 900 mg dose group.
Multiple Ascending Doses
The PK parameters of TM and TDP following repeated administration were comparable from what was observed in the SAD study, except mean t1/2 and Vd/F of TM. In the MAD study, the mean t1/2 of TM was > 2 times higher than that in the SAD study. TM and TDP concentrations reached steady state on day 7 over the multiple doses studied. TM exhibited a long t1/2 in all dose studies, resulting in accumulation ratio (Rac) of 1.96 to 2.11 and accumulation ratio based on Cmax (Rac,Cmax) of 1.60 to 1.88 following 7 days of multiple dosing. Comparable accumulation results were obtained for TDP after multiple dosing (Table 4).
Consistent with the result of the SAD study, the proportionality coefficient for AUC0-t of TM after the first dose on the morning of day 1 was 1.464 (90% CI, 1.389–1.539), suggesting AUC0-t of TM increased in a more than dose-proportional manner. As for Cmax of TM following the first dose, the proportionality coefficient was 1.221 (90% CI, 1.134–1.308), which indicated more than proportional increases the same as AUC0-t of TM. After the last dose on the morning of day 10, the proportionality coefficients for AUC0-τ and Cmax of TM were 1.464 (90% CI, 1.389–1.539) and 1.336 (90% CI, 1.255–1.417), respectively, indicating more than proportional increases in AUC0-τ or Cmax with increasing doses. In contrast, there were less than proportional increases in AUC0-τ or Cmax of TDP with increasing doses.
Discussion
In these studies, benfotiamine was generally safe and well tolerated in healthy subjects over the dose range tested. No trends in the incidence and severity of AEs were observed after single or multiple ascending doses of benfotiamine.
A comparison between the fasted and fed state on day-1 was made based on the result of the SAD study. Standard meals had no effect on the baseline concentration of TM and TDP, and tended to increase TMP concentration that was close to the LLOQ. Therefore, it is appropriate to adjust each concentration of benfotiamine metabolites by each concentration at predose before dosing in further MAD study, rather than by each concentration at the corresponding time point on day-1. Furthermore, the exposure of TM and TDP, such as AUC0-t and Cmax, was much higher than that of TMP, indicating TMP was not the main metabolite of benfotiamine in whole blood. Thus, these metabolites of benfotiamine would be analysed in further MAD study except TMP.
As TM is the main metabolite of benfotiamine, the sampling time point was prolongated to 72 h in the MAD study based on the t1/2 of TM obtained in the SAD study. Besides, the duration from the initial dose on day 4 to the morning dose on day 7 is five times longer than the t1/2 of TM. Therefore, sampling collection at predose on day 7–9 (rough levels) was performed in the MAD study.
The exposure of TM was much greater than that of TMP or TDP in both SAD and MAD study, which was consistent with the known properties of benfotiamine metabolites reported previously.20 The PK parameters (AUC0-t, Cmax and Tmax) of TM after a single dose of 300 mg benfotiamine in the present SAD study was comparable to that reported in the same dose level.21 In the previous study, mean t1/2 of TM was 4.6 h after a single oral dose of 300 mg benfotiamine in Chinese volunteers; meanwhile, mean t1/2 of TM and TDP was 4.4 h and 13.8 h, respectively, in Korean male volunteers administrated by a multivitamin preparation contained 50 mg benfotiamine.20,21 However, mean t1/2 of TM and TDP in this SAD study was 10 h and 18.6 h, respectively; in the MAD study, mean t1/2 of TM and TDP was more than 0.8-fold and 1.9-fold higher following the first dose of 300 mg benfotiamine compared with the SAD study. The difference may have originated from the collected sample time (24 h in previous studies vs. 48 h in this SAD study vs. 72 h in this MAD study). It is plausible that the difference in mean t1/2 primarily due to variability in different collected time, especially considering that the value of t1/2 was calculated from slops obtained by log-linear regression of the terminal concentration-time profile in each metabolite of benfotiamine.
After single and multiple does of benfotiamine, the t1/2 value was shown to be highly variable in TM and TDP at the low dose range of 150–600 mg. The longer t1/2 noted with the lowest doses are thus probably more representative of the elimination phase than the distribution phase. With the higher doses, all samples were reported to be above the LLOQ, therefore allowing a better characterization of the elimination profile of these metabolites of benfotiamine, which could explain why a longer t1/2 was observed in the lowest dose. In addition, the calculation difference of the baseline-adjusted concentration (point-by-point adjustment in the SAD study vs. adjustment at predose in the MAD study) in benfotiamine metabolite may have contributed to the discrepancy.
Conclusion
Single and multiple ascending doses of benfotiamine in healthy Chinese subjects were safe and well tolerated. After single and multiple doses of benfotiamine, the increases in exposure of TM, TMP, and TDP with increasing doses were mainly non-proportional over the studied dose range. TM and TDP exhibited moderate accumulation on repeated administration of benfotiamine.
Data Sharing Statement
The raw data will not be openly shared due to confidentiality concerns.
Acknowledgments
This work was supported by grants from National Major Scientific and Technological Special Project for “Significant New Drugs Development” (grant numbers: 2018ZX09734-001, 2014ZX09101-005-005 and 2009ZX09301-011) and Shanghai Science and Technology Development Foundation (grant number: S2016-023).
Disclosure
Wei Cao reports grants from National Major Scientific and Technological Special Project, during the conduct of the study. Wei Cao and Chunjiu Zhong holds shares of Shanghai Rixin Biotech Ltd Company that dedicates to develop new drugs against Alzheimer’s disease. The other authors have declared that they have no conflicts of interest regarding the context of this article.
References
1. Swerdlow RH. Pathogenesis of Alzheimer’s disease. Clin Interv Aging. 2007;2(3):347.
2. Rygiel K. Novel strategies for Alzheimer’s disease treatment: an overview of anti-amyloid beta monoclonal antibodies. Indian J Pharmacol. 2016;48(6):629–636. doi:10.4103/0253-7613.194867
3. Honig LS, Vellas B, Woodward M, et al. Trial of solanezumab for mild dementia due to Alzheimer’s disease. N Engl J Med. 2018;387(4):321–330. doi:10.1056/NEJMoa1705971
4. Cummings J. Lessons learned from Alzheimer disease: clinical trials with negative outcomes. Clin Transl Sci. 2018;11(2):147–152. doi:10.1111/cts.12491
5. Bachurin SO, Bovina EV, Ustyugov AA. Drugs in clinical trials for Alzheimer’s disease: the major trends. Med Res Rev. 2017;37(5):1186–1225. doi:10.1002/med.21434
6. Balakumar P, Rohilla A, Krishan P, Solairaj P, Thangathirupathi A. The multifaceted therapeutic potential of benfotiamine. Pharmacol Res. 2010;61(6):482–488. doi:10.1016/j.phrs.2010.02.008
7. Volvert ML, Seyen S, Piette M, et al. Benfotiamine, a synthetic S-acyl thiamine derivative, has different mechanisms of action and a different pharmacological profile than lipid-soluble thiamine disulfide derivatives. BMC Pharmacol. 2008;8(1):10. doi:10.1186/1471-2210-8-10
8. Schreeb KH, Freudenthaler S, Vormfelde SV, Gundert-Remy U, Gleiter CH. Comparative bioavailability of two vitamin B1 preparations: benfotiamine and thiamine mononitrate. Eur J Clin Pharmacol. 1997;52(4):319–320.
9. Greb A, Bitsch R. Comparative bioavailability of various thiamine derivatives after oral administration. Int J Clin Pharmacol Ther. 1998;36(4):216–221.
10. Hammes HP, Du X, Edelstein D, et al. Benfotiamine blocks three major pathways of hyperglycemic damage and prevents experimental diabetic retinopathy. Nat Med. 2003;9(3):294–299. doi:10.1038/nm834
11. Varkonyi T, Putz Z, Keresztes K, et al. Current options and perspectives in the treatment of diabetic neuropathy. Curr Pharm Des. 2013;19(27):4981–5007. doi:10.2174/13816128113199990310
12. Nikolic A, Kacar A, Lavrnic D, Basta I, Apostolski S. The effect of benfothiamine in the therapy of diabetic polyneuropathy. Srp Arh Celok Lek. 2009;137(11–12):594–600. doi:10.2298/SARH0912594N
13. Nacitarhan C, Minareci E, Sadan G. The effect of benfotiamine on mu-opioid receptor mediated antinociception in experimental diabetes. Exp Clin Endocrinol Diabetes. 2014;122(3):173–178. doi:10.1055/s-0033-1363977
14. Ceylan-Isik AF, Wu S, Li Q, Li SY, Ren J. High-dose benfotiamine rescues cardiomyocyte contractile dysfunction in streptozotocin-induced diabetes mellitus. J Appl Physiol (1985). 2006;100(1):150–156. doi:10.1152/japplphysiol.00988.2005
15. Pan X, Gong N, Zhao J, et al. Powerful beneficial effects of benfotiamine on cognitive impairment and beta-amyloid deposition in amyloid precursor protein/presenilin-1 transgenic mice. Brain. 2010;133(5):1342–1351. doi:10.1093/brain/awq069
16. Sun XJ, Zhao L, Zhao N, et al. Benfotiamine prevents increased beta-amyloid production in HEK cells induced by high glucose. Neurosci Bull. 2012;28(5):561–566. doi:10.1007/s12264-012-1264-0
17. Tapias V, Jainuddin S, Ahuja M, et al. Benfotiamine treatment activates the Nrf2/ARE pathway and is neuroprotective in a transgenic mouse model of tauopathy. Hum Mol Genet. 2018;27(16):2874–2892. doi:10.1093/hmg/ddy201
18. Pan X, Chen Z, Fei G, et al. Long-term cognitive improvement after benfotiamine administration in patients with Alzheimer’s disease. Neurosci Bull. 2016;32(6):591–596. doi:10.1007/s12264-016-0067-0
19. Gibson GE, Luchsinger JA, Cirio R, et al. Benfotiamine and cognitive decline in Alzheimer’s disease: results of a randomized placebo-controlled Phase IIa clinical trial. J Alzheimers Dis. 2020;78(3):989–1010. doi:10.3233/JAD-200896
20. Park WS, Lee J, Hong T, et al. Comparative pharmacokinetic analysis of thiamine and its phosphorylated metabolites administered as multivitamin preparations. Clin Ther. 2016;38(10):2277–2285. doi:10.1016/j.clinthera.2016.08.009
21. Xie F, Cheng Z, Li S, et al. Pharmacokinetic study of benfotiamine and the bioavailability assessment compared to thiamine hydrochloride. J Clin Pharmacol. 2014;54(6):688–695. doi:10.1002/jcph.261
 © 2021 The Author(s). This work is published and licensed by Dove Medical Press Limited. The full terms of this license are available at https://www.dovepress.com/terms.php and incorporate the Creative Commons Attribution - Non Commercial (unported, v3.0) License.
By accessing the work you hereby accept the Terms. Non-commercial uses of the work are permitted without any further permission from Dove Medical Press Limited, provided the work is properly attributed. For permission for commercial use of this work, please see paragraphs 4.2 and 5 of our Terms.
© 2021 The Author(s). This work is published and licensed by Dove Medical Press Limited. The full terms of this license are available at https://www.dovepress.com/terms.php and incorporate the Creative Commons Attribution - Non Commercial (unported, v3.0) License.
By accessing the work you hereby accept the Terms. Non-commercial uses of the work are permitted without any further permission from Dove Medical Press Limited, provided the work is properly attributed. For permission for commercial use of this work, please see paragraphs 4.2 and 5 of our Terms.