")
Back to Journals » Clinical Ophthalmology » Volume 13
Safety of anti-VEGF treatments in a diabetic rat model and retinal cell culture
Authors Filek R, Hooper P, Sheidow TG , Liu H, Chakrabarti S , Hutnik CML
Received 28 December 2018
Accepted for publication 24 April 2019
Published 1 July 2019 Volume 2019:13 Pages 1097—1114
DOI https://doi.org/10.2147/OPTH.S199771
Checked for plagiarism Yes
Review by Single anonymous peer review
Peer reviewer comments 2
Editor who approved publication: Dr Scott Fraser
Richard Filek,1 Phil Hooper,2,3 Tom G Sheidow,2,3 Hong Liu,3 Subrata Chakrabarti,1 Cindy ML Hutnik1–3
1Department of Pathology and Laboratory Medicine, Western University, London, ON, Canada; 2Department of Ophthalmology, Western University, London, ON, Canada; 3Ivey Eye Institute, St. Joseph’s Health Care London, London, ON, Canada
Purpose: To analyze the safety of different concentrations of anti-VEGF on retinal cells.
Methods: Non-diabetic and streptozotocin (STZ)-induced diabetic rats received intravitreal rat anti-VEGF injections that had final vitreous concentrations of 0, 0.0625, 0.125 (clinical dose), and 0.25 mg/mL. Rats were also injected with the clinical dose of ranibizumab. TUNEL assay was performed on sectioned eyes to evaluate apoptotic cells. In vitro, rat retinal cell cultures were exposed to 0, 0.0625, 0.125 (clinical dose), and 0.25 mg/mL of ranibizumab for 48 and 72 hrs. Cellular metabolic activity was measured by 3-(4,5-dimethylthiazol-2-yl)-2,5-diphenyltetrazolium bromide (MTT) assay, necrosis by lactate dehydrogenase (LDH), and apoptosis by cell death enzyme-linked immunosorbent assay (ELISA).
Results: Diabetic rats had a significant increase (p<0.03) in apoptotic cell death at half the clinical dose, at the clinical dose, and at double the clinical dose. In vitro, MTT showed a significant decrease (p<0.04) in cellular metabolic activity at the clinical dose and double the clinical dose compared to control at 48 and 72 hrs. LDH showed a significant increase (p<0.04) in necrosis at the clinical dose and double the clinical dose compared to control at 48 and 72 hrs. ELISA showed a significant increase (p<0.04) in apoptosis at half the clinical dose, at the clinical dose, and double the clinical dose, compared to control at 48 and 72 hrs.
Conclusions: Anti-VEGF treatment may be potentially detrimental to the retina by decreasing cellular metabolic activity and increasing cytotoxicity of retinal cells. The results provide a cautionary note to monitor both the retina and optic nerve status in patients undergoing frequent injections.
Keywords: diabetic macular edema, diabetes, retina, anti-VEGF, ranibizumab, safety, cytotoxicity
Introduction
Diabetic retinopathy (DR) is the result of microvascular retinal changes caused by hyperglycemia which alter the blood–retinal barrier (BRB). In DR, hyperglycemia results in enhanced production of vascular endothelial growth factors (VEGF), advanced glycated end products, nitric oxide, oxidative stress, and inflammation within the eye.1 The factors increase the permeability of BRB, resulting in accumulation of extracellular fluid within the retina and the development of diabetic macular edema (DME). If the leakage is centralized within the macula, the condition may lead to significant loss of central visual function and acuity.
Inhibition of these factors can reduce the developing leakage, so the gold standard treatment for DME is intravitreal anti-VEGF injections.2 Intravitreal anti-VEGF injections inhibit the action of VEGF, decreasing permeability, leakage, and proliferation of blood vessels. While excess VEGF is harmful, past studies have found that VEGF is involved in neuroprotection by protecting retinal cells against the damaging insults of hypoxia, glutamate excitotoxicity, and deprivation of serum.3–10
Over the past decade, there have been increased clinical reports of diabetic patients on anti-VEGF therapy developing signs of glaucoma and optic neuropathy. Diabetes is already a risk factor for the development of glaucoma, and the use of anti-VEGFs might augment the risk.11 In addition to this, our past research that is currently under review has demonstrated that over 24 months, DME patients undergoing anti-VEGF therapy have increased cup volume, increased vertical cup/disk (C/D) ratio that is dependent on number of injections and show deterioration of peripheral vision. There is an uncertainty in regards to whether eliminating the neuroprotective role of VEGF through anti-VEGF therapy causes optic neuropathy and death of retinal cells. With newer, higher affinity anti-VEGFs being introduced into the market, the question remains whether or not neuronal cells in the diabetic retina may be further affected by the treatment.
The purpose of the following study is to examine whether increased exposure to anti-VEGFs will result in increased retinal cell death. First, the effects of VEGF inhibition on neuronal cells in a streptozotocin (STZ)-induced diabetic rat retina will be evaluated by performing intravitreal anti-VEGF injections of different doses. Second, we will determine whether the exposure to different doses of anti-VEGF alters retinal cells metabolic activity or induces toxicity by various colorimetric assays.
Methods
Diabetic animal model
Experimental protocols were approved by Animal Use Committee of Western University and adhered to the ARVO Statement for the Use of Animals in Ophthalmic and Vision Research. Animals were approved by Animal Care and Veterinary Services (ACVS) of Western University and complied with the NIH Guide for the Care and Use of Laboratory Animals (NIH publication no. 80–23, revised in 1996). Animal care adhered to the Guiding Principles in the Care and Use of Animals.
Male Sprague–Dawley rats (250–300 g, 7–8 weeks old) were obtained from Charles River (Charles River Canada Ltd., Saint-Constant, Quebec, Canada). Diabetes was induced in 25 randomly selected rats by a single intraperitoneal injection of STZ (Sigma-Aldrich, St. Louis, MO, 65 mg/kg in citrate buffer at a pH of 5.6).12 The remaining 25 rats were designated as non-diabetic and were injected with an identical volume of citrate buffer.13,14 Three days following STZ injection, the blood glucose levels for each rat were measured on an automated OneTouch Ultra glucometer (LifeScan Inc., Milpitas, California, USA). A blood glucose reading of >20 mmol/L was considered diabetic and the rat was used for further experimentation. To prevent ketoacidosis, diabetic rats were injected with an insulin implant (2 U/d, Linshin Canada Inc., Toronto, Ontario, Canada) that released small doses of insulin. For the duration of 5 months, diabetic rats were routinely monitored through body weight measurements and monitoring of blood glucose levels. The non-diabetic and diabetic groups were composed of five animals for each experimental procedure.
Drug administration
After 5 months of diabetes, rats received intravitreal injections. For each intravitreal injection, rats were anesthetized with 4% isoflurane during the induction phase and 3% for maintenance level. Prior to the injection, the eye was disinfected with topical povidone-iodine eye drops. A 30 gauge needle was used to administer the intravitreal injection to the inferior temporal quadrant, posterior to the limbus. For each rat, the right eye was the test eye and the left eye was the control, injected with saline. The clinical dose for the injections was based on the concentration of drug in a human eye immediately after injection. With 25 non-diabetic rats and 25 STZ-induced diabetic rats, each group had a n=5 consisting of 5 rats receiving 1 unit of 0.3375 mg/mL (final concentration in the eye being 0.0625 mg/mL, which is half the clinical dose used in human eye injections) injection, 5 rats receiving 1 unit 0.675 mg/mL (final concentration being 0.125 mg/mL, which is the human clinical dose) injection, and 5 rats receiving 1 unit 1.35 mg/mL (final concentration being 0.25 mg/mL-double the clinical dose) injection of rat anti-VEGF (AF564; R&D Systems, Minneapolis, MN, USA). Five rats also received 1 unit of Ranibizumab (Lucentis, 0.5 mg in 0.05 mL solution for injection; Novartis Pharmaceuticals Canada Inc., Quebec, Canada) at 0.675 mg/mL (final concentration being 0.125 mg/mL-clinical dose). These injections were performed once a week for 3 weeks to simulate the injection frequency of human patients receiving injections once a month for the duration of 3 months. The remaining 5 rats received an injection of 1 unit 0.675 mg/mL (final concentration being 0.125 mg/mL-clinical dose) only once to analyze the effects of frequency of injections. The needle remained in the eye for 3–4 seconds before being drawn out to avoid reflux. Once finished, the isoflurane was shut off and the rat was maintained on oxygen until fully recovered. On week 4, rats were euthanized in a carbon dioxide gas chamber, eyes were enucleated, fixed in 4% paraformaldehyde for 24 hrs and placed in 70% ethanol for paraffin embedding.
TUNEL assay
Following paraffin-processing, the eye tissues were sectioned to a thickness of 4 µm along the sagittal plane of the eye and transferred to positively charged, transparent microscope slides (VWR, Radnor, PA). The slides were stored at −80°C until stained. To evaluate tissue integrity, efficacy of tissue preservation, and to determine optic nerve location, every tenth slide was stained with Hematoxylin and Eosin according to standard protocol.
TUNEL Assay was performed to evaluate apoptotic cells. The sections were dewaxed and stained using the TUNEL method according to the manufacturer’s protocol (In Situ Cell Death Detection Kit, Fluorescein; Ref. 11684795910 Roche Applied Science, Indianapolis, Indiana, USA). In the assay, the enzyme terminal deoxynucleotidyl transferase catalyzes the reaction that labels the sites of DNA breaks with deoxyuridine. Slides were counterstained with 1 µM DAPI for 10 mins at room temperature to identify nuclei and washed with phosphate-buffered saline (PBS) before being put under cover glass. Sections were imaged with a Zeiss LSM 510 META confocal microscope equipped with an AxioCam MR3 (Carl Zeiss Canada, North York, Ontario, Canada). To quantify the number of TUNEL-positive cells in the retina for the non-diabetic and diabetic rats, cell bodies were counted in each layer by two graders. The graders were masked to the type of animal and purpose of the study.
Mixed retinal cell culture
Eyes from 1 week old Sprague–Dawley rats were enucleated en bloc and placed in CO2-independent medium supplemented with 0.1% antibiotic-antimycotic (Ref. 15240096 Thermo Fisher Scientific, Waltham, Massachusetts, USA) and 4mM L-glutamine. Eyes were dissected and retinas were extracted within 1 hr of enucleation. Retinal cells were washed with Hank’s Balanced Salt Solution supplemented with 1% penicillin, placed in a 0.2% papain activated solution, and incubated in a 37°C water bath for 20 mins with gentle stirring every 5 mins. Digestion was stopped with the addition of 0.5 μL of DNAse1 (114 U/μL) and 1 mL of warm Neurobasal A medium (NBA) supplemented with 2% fetal bovine serum (FBS), 0.5 mM L-glutamine, and 2% B-27 (Ref. 17504044 Thermo Fisher Scientific, Waltham, Massachusetts, USA). Retinal cells were dissociated by trituration in NBA and the suspension was centrifuged at 68×g for 4 mins. The cell pellet was resuspended in fresh NBA. The cells were seeded at 5×10⁵ cells per well onto 24-well plates containing 12-mm glass coverslips precoated sequentially with poly-D-lysine (2μg/cm2 for 2 hrs at 37°C) and laminin (1 μg/cm2 overnight at 37°C). Cells were maintained at 37°C in a 5% CO2 incubator.
Dosage
NBA was refreshed two days after plating. On the fourth day of cultivation, the medium was removed from the mixed retinal cell cultures and replaced with medium containing ranibizumab (Lucentis, Novartis Pharmaceuticals Canada Inc., Quebec, Canada) diluted down to clinical relevant concentrations (0.125 mg/mL) as well as half the clinical dose (0.0625 mg/mL) and double the clinical dose (0.25 mg/mL). Control wells contained only medium and no anti-VEGF (0 mg/mL). In another subset of experiments, mixed retinal cell cultures were also exposed to medium containing rat anti-VEGF (AF564; R&D Systems, Minneapolis, MN, USA) diluted down to the same concentrations. The cells were exposed to these concentrations for 48 or 72 hrs at 37°C in a 5% CO2 incubator.
Immunohistochemistry
Following 48 or 72 hrs of exposure to anti-VEGF, the cells were fixed with 100% methanol for 5 mins at −20°C for Thy 1.1 labeling. The cells were incubated for 1 hr at room temperature with 1% bovine serum albumin (BSA), 10% normal goat serum, and 0.3 M glycine in 0.1% PBS-Tween as per the manufacturer’s protocol. This increased the permeability of the cells and blocked non-specific protein–protein interactions. The cells were incubated for 1 hr at room temperature with a mouse anti-rat primary antibody against CD90/Thy 1.1 (1:200; ab225; Abcam, Toronto, Ontario, Canada) followed by a goat anti-mouse IgG secondary antibody conjugated to Alexa Fluor 488 (1:1000; Life Technologies Inc., Burlington, Ontario, Canada) at room temperature in the dark for 1 hr.
For double-labeling studies, cells were blocked in a blocking buffer consisting of 1X PBS, 5% normal goat serum, and 0.3% Triton X-100 for 1 hr in room temperature as per the manufacturer’s protocol. Primary and secondary antibodies were prepared in an antibody dilution buffer consisting of 1X PBS, 1% BSA, and 0.3% Triton X-100. The cells were incubated overnight at 4°C with a chicken anti-rat primary antibody Class III β-Tubulin antibody (1:400; TUJ-1; ab107216; Abcam, Toronto, Ontario, Canada), rabbit anti-rat primary Brn3a antibody (1:100; ab81213; Abcam, Toronto, Ontario, Canada), or rabbit anti-rat primary cleaved caspase-3 antibody (1:400; Asp175; Cell Signaling Technology Inc., Boston, Massachusetts, USA). After washing with PBS, cells were incubated for 1 hr in the dark with goat anti-chicken IgG secondary antibody, Texas Red (1:1,000; Life Technologies Inc., Burlington, Ontario, Canada), and goat anti-rabbit IgG secondary antibody conjugated to Alexa Fluor 488 (1:1,000; Life Technologies Inc., Burlington, Ontario, Canada). Cells were counterstained with 1 µM DAPI for 10 mins at room temperature to identify nuclei, washed with PBS, and mounted with Fluoromount G (Electron Microscopy Sciences, Hatfield, PA) on positively charged slides (VWR, Radnor, PA). Antibody concentrations were individually optimized to achieve optimal fluorescence with minimal background staining. Images were taken using a Zeiss Axio Imager Z1 fluorescent microscope (Carl Zeiss Canada, Toronto, ON, Canada) equipped with an AxioCam MR3 (Carl Zeiss Canada). To quantify the number of retinal ganglion cells (RGC), a series of three photos for each concentration was used and the average cell bodies stained with RGC-enriched markers were counted by two graders. The graders were masked to the purpose of the study.
Negative controls were utilized for every round of slide staining to eliminate suspicion of non-specific secondary antigen binding. For single-staining optimization experiments using anti-CD90/Thy 1.1, one slide was exposed to the appropriate secondary antibody in absence of its respective primary antibody. For dual-staining experiments using both anti-TUJ-1 and anti-Brn3a or anti-cleaved caspase-3, one slide served as a control for each of the following conditions: TUJ-1 secondary antibody alone in absence of primary, Brn3a or cleaved caspase-3 secondary antibody alone in absence of primary, and both TUJ-1 and Brn3a or cleaved caspase-3 secondary antibodies in the absence of either primary antibody.
Colorimetric assays
After 48 or 72 hrs of treatment with the different doses of anti-VEGF, three colorimetric assays were performed; MTT (Thiazolyl Blue Tetrazolium Bromide) assay (M2128-1G; Sigma-Aldrich, St. Louis, Missouri, USA), lactate dehydrogenase (LDH) assay (11644793001; Roche Life Science, Laval, Quebec, Canada), and the cell death detection ELISA assay (11544675001; Roche Life Science, Laval, Quebec, Canada). The colorimetric assays were performed as per the manufacturers’ instructions. The MTT assay assessed cellular metabolic activity of the experimental cells to the control. The LDH and cell death detection ELISA assays were used to evaluate cytotoxicity of the experimental cells to the control cells by examining cell death through necrosis in the LDH assay and cell death through apoptosis in the ELISA assay. Protein concentrations (23,225; Pierce™ BCA Protein Assay Kit, Thermo Fisher Scientific, Waltham, Massachusetts, USA) were measured for each sample to normalize the absorption data of the LDH and cell death detection ELISA assays.
Statistical analysis
Statistical analysis was performed using one-way ANOVA with a Bonferroni’s multiple comparison test and an unpaired t-test on the GraphPad Prism 5 software (GraphPad Software, La Jolla, CA). ANOVA with Bonferroni method was performed as outlined in Neter et al (1990). All data were expressed as mean±SD and accepted as statistically significant if p<0.05.
Results
Body weight and blood glucose levels
The body weight and blood glucose levels of the non-diabetic and STZ-induced diabetic male Sprague–Dawley rats were monitored (Table 1). Five months post-STZ injection, diabetic rats had a significant decrease in their body weight and a significant increase in the blood glucose levels compared to the non-diabetic rats. The changes indicate that diabetic dysmetabolism was established and verifies that a diabetic rat model was used.
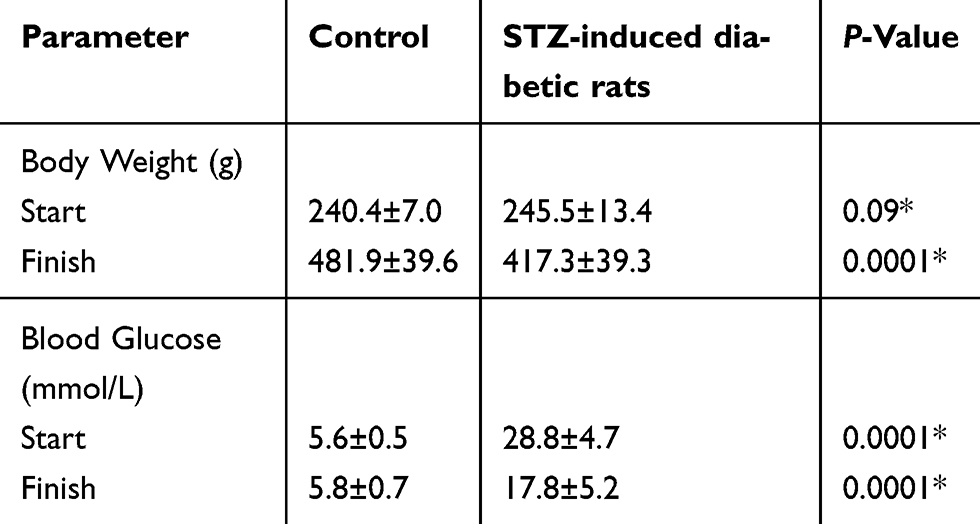 |
Table 1 Body weights and serum glucose levels of control and streptozotocin (STZ)-induced diabetic rats |
Increasing anti-VEGF concentrations caused more death in vivo
To determine whether different doses of anti-VEGF result in increased apoptotic cells in the retina, sagittal eye sections of control rats and STZ-induced diabetic rats underwent TUNEL staining. Imaging under a fluorescent microscope revealed that as the concentration of anti-VEGF increased, more apoptotic cells were present in both the STZ-induced diabetic (Figure 1) and non-diabetic rats (Figure S1). Apoptotic cells were localized to the ganglion cell layer (GCL) and the inner nuclear layer (INL). When quantifying the number of TUNEL-positive cells in the entire retina of the non-diabetic rats, untreated control (0 mg/mL) had a baseline number of 0.64±1.29 apoptotic cells. At half the clinical dose (0.0625 mg/mL), the number of apoptotic cells was 1.60±1.82, at the clinical dose (0.125 mg/mL), it was 2.40±2.07 apoptotic cells, and at double the clinical dose (0.25 mg/mL), the number significantly increased (p=0.0004) to 4.40±0.89 apoptotic cells compared to the control (Figure 2A). For the STZ-induced diabetic rats, control had a baseline number of 0.46±1.06 apoptotic cells. The number significantly increased at half the clinical dose to 2.60±1.34 (p=0.01), 4.50±3.32 at the clinical dose (p=0.02), and 6.80±2.95 (p=0.03) at double the clinical dose (Figure 2B).
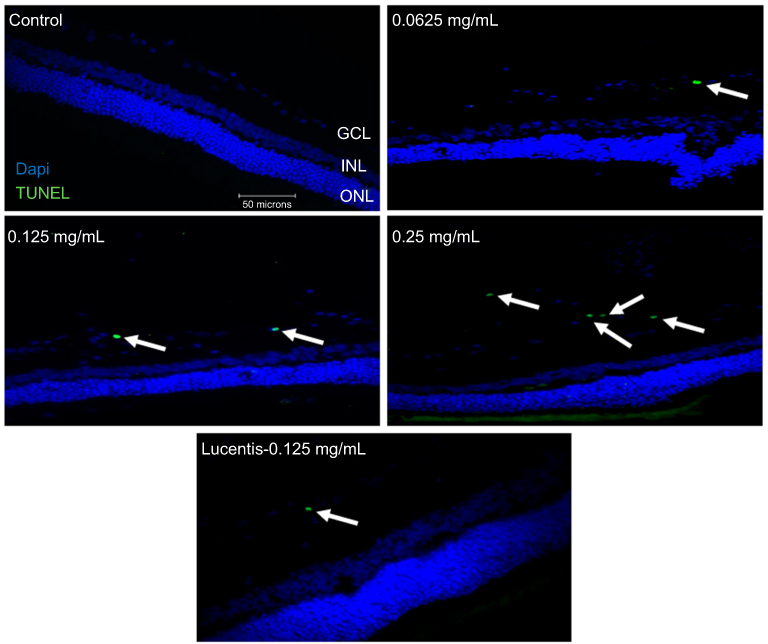 |
Figure 1 Terminal deoxynucleotidyl transferase dUTP nick end labeling (TUNEL) staining of diabetic rat retina. TUNEL staining performed in streptozotocin (STZ)-induced diabetic rats showed increased apoptotic cells in the ganglion cell layer following different doses of anti-VEGF injections compared with untreated retina from the diabetic control group. Blue represents 4′,6-diamidino-2-phenylindole (DAPI)-stained nuclei and green represents TUNEL staining. Magnification x40. n=5 for each group. Scale bar: 50 µm. |
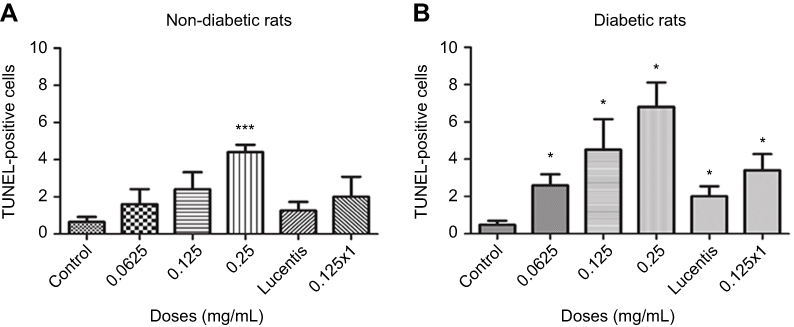 |
Figure 2 Apoptotic cell death rates following different doses and frequency of rat anti-VEGF and ranibizumab in non-diabetic and diabetic rats. The number of Terminal deoxynucleotidyl transferase dUTP nick end labeling (TUNEL)-positive cells in the ganglion cell layer (GCL) was significantly greater at double the clinical dose (0.25 mg/mL) in the non-diabetic rats (A) and significantly greater at half the clinical (0.0625 mg/mL), clinical (0.125 mg/mL), and double the clinical dose (0.25 mg/mL) in the diabetic rats (B) compared to untreated controls. Comparing the clinical dose of ranibizumab (Lucentis-0.125 mg/mL) to the clinical dose of rat anti-VEGF (0.125 mg/mL) in non-diabetic (A) and diabetic (B) rats, neither was significantly different regarding the number of TUNEL-positive cells. In the diabetic rats (B), both the clinical dose of ranibizumab and rat anti-VEGF had significantly increased numbers of TUNEL-positive cells compared to untreated diabetic control. Injecting the clinical dose of rat-anti-VEGF once versus three times over the span of 3 weeks showed no significant difference between each other for both the non-diabetic (A) and diabetic (B) rats. In the diabetic rats (B), injecting once or 3 times both showed significantly increased TUNEL-positive cells compared to untreated diabetic controls. Data are expressed as means±SD. n=5 for each group. *p<0.03, ***p=0.0004 compared to controls. |
No difference in cell death between the clinical dose of ranibizumab and rat anti-VEGF
In non-diabetic rats when comparing the clinical dose of ranibizumab (Lucentis-0.125 mg/mL) to the clinical dose of rat anti-VEGF (0.125 mg/mL) in regards to the amount of apoptotic cells, both were not significantly different from one another despite rat-anti-VEGF showing higher numbers of apoptotic cells (2.40±2.07 cells) compared to ranibizumab (1.25±0.96 cells) and untreated control (0.64±1.29 cells) (Figure 2A). Similarly, in the diabetic rats, ranibizumab (2.00±1.23) and rat anti-VEGF (4.50±3.32) were also not significantly different, but both had significantly increased (p<0.03) apoptotic cells compared to untreated diabetic control (Figure 2B).
Frequency of injections has no effect on apoptotic cells
The frequency of injections did not have a significant effect on the number of apoptotic cells. In the non-diabetic rats, single versus triple injections of the clinical dose of rat-anti-VEGF showed no significant difference (p=0.79). Single injections resulted in 2.00±2.16 apoptotic cells while 3 injections resulted in 2.40±2.07 apoptotic cells. Non-diabetic rats injected with anti-VEGF had no significant difference (p>0.36) when compared to untreated control (0.64±1.29 cells) (Figure 2A). In the diabetic rats, a single injection of the clinical dose (3.40±1.95 cells) had no significant difference from a dose consisting of 3 injections despite having more apoptotic cells (4.50±3.32 cells). Both a single dose injection and 3 injections had significantly increased (p<0.03) number of apoptotic cells relative to untreated diabetic control (Figure 2B).
Verification of mixed retinal cell culture
The mixed retinal cell cultures were stained for Class III β-Tubulin, a known neuronal marker, with BRN3A and Thy 1.1 which are both RGC-enriched markers. Cells were imaged at 60x magnification. Alexa Fluor 488 green emissions corresponded with staining for Class III β-Tubulin, suggesting that retinal neuronal cells were present in the mixed retinal cell culture. The expression of Brn3a and Thy 1.1 was indicative of the mixed retinal cell culture containing RGCs. Initial immunofluorescence of primary rat retinal cell cultures showed positive expression of Brn3a, Class III β-Tubulin (Figure S2A) and Thy 1.1 (Figure S2B). Confocal triple immunofluorescence indicated the co-staining of Thy 1.1 (Figure S2D), Class III β-Tubulin (Figure S2E), and nuclear DAPI (Figure S2F) in cells at day 3 of culture (merged image in Figure S2C). When quantifying the immunofluorescence on day 3, the mixed retinal cell culture contained 44% RGCs. The RGCs in culture showed dendritic outgrowth and elongation with axonal processes frequently contacting each other.
Increasing anti-VEGF concentrations caused cell death in vitro
Examining RGCs under different concentrations of ranibizumab using immunocytochemistry, as the anti-VEGF concentration increased, the morphology of the RGCs changed as well (Figures S3 and 5). Visually, as the anti-VEGF concentration increased, the number of RGCs decreased, fewer contacts between RGCs were observed and fewer dendritic and axonal outgrowths were detected. The observations were conducted at both 48 (Figure S3) and 72 hrs (Figure 3).
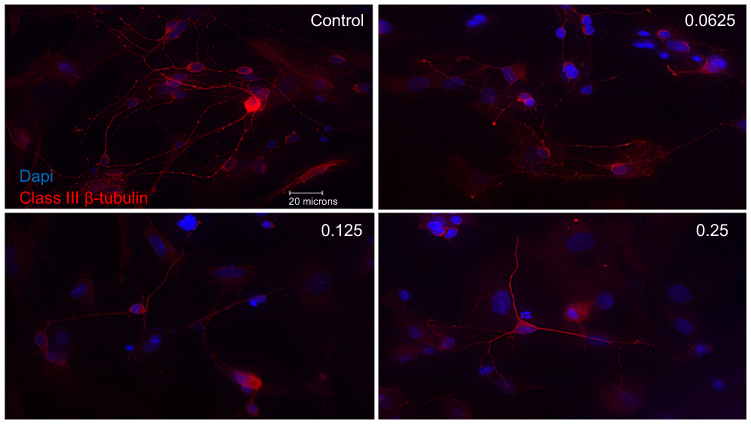 |
Figure 3 Morphological effect of different concentrations of ranibizumab on retinal ganglion cells (RGCs) following 72 hrs post-treatment. RGCs were stained for nuclei (blue) and Class III β-tubulin (red). Immunofluorescence of RGCs under different concentrations of ranibizumab for 72 hrs showed that as the concentration increased, the morphology of the RGCs continued to change. As the concentration went from untreated control to double the clinical dose (0.25 mg/mL), the amount of RGCs showed a further decrease in number, had fewer contacts between each other and had fewer dendritic outgrowths. Magnification x60. Scale bar: 20 µm. |
Quantifying the percentage of RGCs, when compared to the untreated control (49.82±11.57%), at 72 hrs the percentage of RGCs decreased at half the clinical dose by 14.49% (0.0625mg/mL; 35.33±11.86%, p=0.20), and significantly decreased at the clinical (0.125 mg/mL; 25.63±9.50%, p=0.04) and double the clinical dose (20.93±5.01%, p=0.02) by 24.19% and 28.89%, respectively (Figure 4). The same trend was observed at 48 hrs (Figure S4).
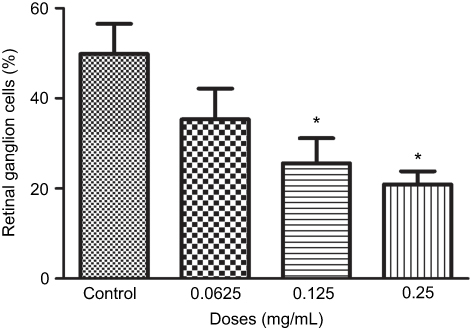 |
Figure 4 Percentage of retinal ganglion cells (RGCs) under different concentrations of ranibizumab. The percentage of RGCs significantly decreased at the clinical dose (0.125 mg/mL) and double the clinical dose (0.25 mg/mL) of ranibizumab at 72 hrs. Data are expressed as means±SD. n=3. *p<0.04 compared to control. |
Immunostaining of cleaved caspase-3 in the mixed retinal cell culture under different ranibizumab concentrations showed increased apoptotic cell death in half the clinical (0.0625 mg/mL), clinical (0.125 mg/mL), and double (0.25 mg/mL) the clinical doses compared to untreated control (0 mg/mL). The observations were made at both 48 (Figure S5) and 72 hrs (Figure S6).
Double-labeling studies of Class III β-Tubulin and cleaved caspase-3 indicated that at double the clinical dose (0.25 mg/mL), apoptosis of RGCs was observed. At half the clinical (0.0625 mg/mL), clinical (0.125 mg/mL), and double the clinical (0.25 mg/mL) doses, the surrounding supporting cells were dying through apoptosis in the mixed retinal cell culture (Figure 5). This was also observed in the TUNEL analysis of retinal sections since death was observed in the INL as well for both the non-diabetic and diabetic rats (Figure S7).
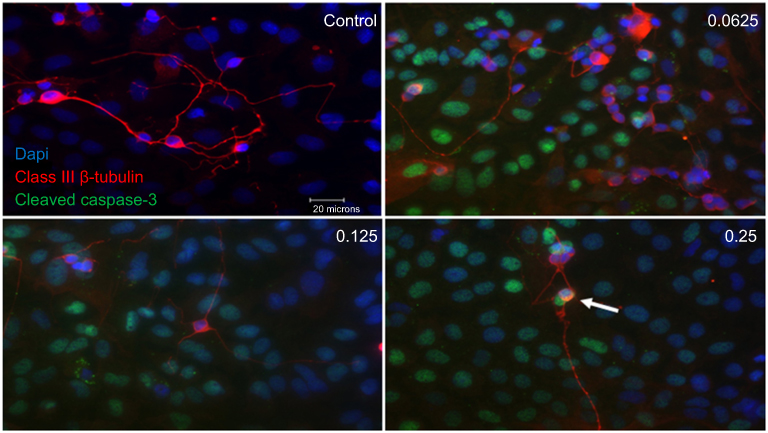 |
Figure 5 Apoptotic cell death of support cells surrounding retinal ganglion cells (RGCs). Performing double-labeling studies of class III β-Tubulin (red) and cleaved caspase-3 (green) indicated that RGCs began to die from apoptosis at double the clinical dose (0.25 mg/mL) (arrowhead). At all doses, it was the surrounding supporting cells around the RGCs that were dying off through apoptosis. Images are shown with 4′,6-diamidino-2-phenylindole (DAPI) staining the nuclei in blue. Magnification x60. Scale bar: 20 µm. |
Increased ranibizumab concentrations result in decreased cellular metabolic activity
At 48 hrs, as ranibizumab concentrations increased, cellular metabolic activity decreased as measured using the MTT assay. Cellular metabolic activity showed no significant difference at half the clinical dose (0.0625mg/mL; 69.87±8.20%, p=0.14), but was significantly decreased at the clinical (0.125 mg/mL; 68.18±6.00%, p=0.003) and double the clinical doses (69.74±4.50%, p=0.04) by 4.06% and 2.50%, respectively, compared to untreated control (0 mg/mL; 72.24±7.18%) (Figure 6A). At 72 hrs, the cellular metabolic activity further decreased and displayed the same trend as cells at 48 hrs. Compared to the untreated control (67.15±3.34), the cellular metabolic activity was not significantly different at half the clinical dose (0.0625mg/mL; 66.59±4.07%, p=0.57), but was significantly decreased at the clinical (0.125 mg/mL; 63.51±4.70%, p=0.002) and double the clinical dose (62.52±5.04%, p<0.0001) by 3.64% and 4.63%, respectively (Figure 6B).
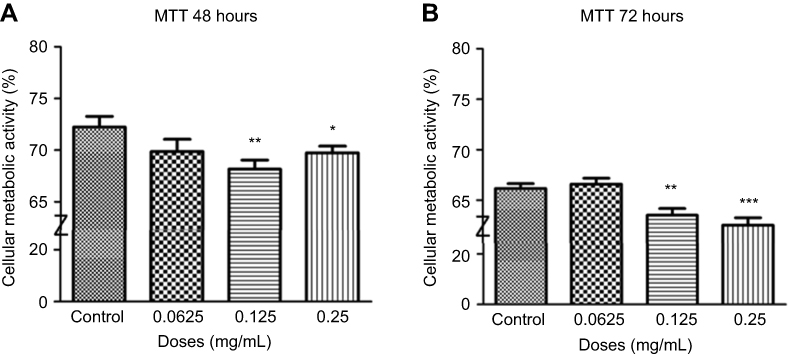 |
Figure 6 Cellular metabolic activity following different concentrations of ranibizumab. Cellular metabolic activity, as measured using the thiazolyl blue tetrazolium bromide (MTT) assay, was significantly decreased at the clinical dose (0.125 mg/mL) and double the clinical dose (0.25 mg/mL) of ranibizumab for both 48 (A) and 72 (B) hrs. The cellular metabolic activity was further decreased at 72 hrs. Data are expressed as means±SD. n=4. *p<0.04, **p<0.003, ***p<0.0001 compared to controls. |
Increasing ranibizumab concentrations result in increased necrosis
Cells were treated for 48 hrs with different concentrations of ranibizumab and necrosis was measured using LDH assay. Necrosis was not significantly different at half the clinical dose (0.0625 mg/mL; 114.40±43.48%, p=0.33), but was significantly increased by 30.20% at the clinical dose (0.125 mg/mL; 130.60±44.31%, p=0.04) and by 32.50% at double the clinical dose (0.25 mg/mL; 132.90±29.44%, p=0.005) compared to untreated control (0 mg/mL; 100.40±21.27) (Figure 7A). During 72 hrs, there was less necrosis compared to 48 hrs, but the same trend was observed. At 72 hrs, necrosis was not significantly different at half the clinical dose (0.0625 mg/mL; 109.00±22.62%, p=0.19), but was significantly increased by 27.70% at the clinical dose (0.125 mg/mL; 126.10±22.57%, p=0.002) and 22.10% at double the clinical dose (0.25 mg/mL; 120.50±28.35, p=0.03) when compared to the untreated control (98.40±15.25%) (Figure 7B).
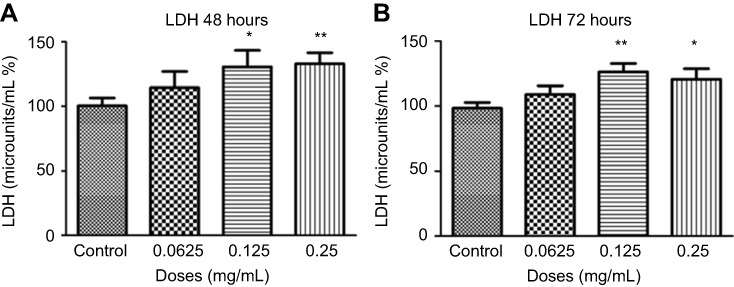 |
Figure 7 Necrosis following different concentrations of ranibizumab. Necrosis, as measured using the lactate dehydrogenase (LDH) assay, was significantly increased at the clinical dose (0.125 mg/mL) and double the clinical dose (0.25 mg/mL) of ranibizumab for both 48 (A) and 72 (B) hrs. There was less necrosis activity present at 72 hrs compared to 48 hrs. Data is expressed as means±SD. n=4. *p<0.04, **p<0.005 compared to controls. |
Increased apoptosis with increasing ranibizumab concentrations
Cells were treated for 48 hrs with different concentrations of ranibizumab, and apoptosis was measured using the cell death detection ELISA assay. Apoptosis significantly increased at half the clinical dose (0.0625 mg/mL; 131.90±43.94%, p=0.02), the clinical dose (0.125 mg/mL; 124.00±22.79%, p=0.005), and double the clinical dose (0.25 mg/mL; 137.20±61.77%, p=0.04) by 35.40%, 27.50%, 40.70%, respectively, when compared to untreated controls (96.50±19.34%) (Figure 8A). Cells displayed increased apoptosis when treated for 72 hrs and showed the same trends as in 48 hrs. There was a significant increase in apoptotic cells at half the clinical dose (0.0625 mg/mL; 142.30±55.20%, p=0.01), the clinical dose (0.125 mg/mL; 137.90±31.51%, p=0.001), and double the clinical dose (0.25 mg/mL; 142.70±39.79%, p=0.002) by 47.70%, 43.30%, 48.10%, respectively, when compared to untreated controls (94.60±24.72%) (Figure 8B).
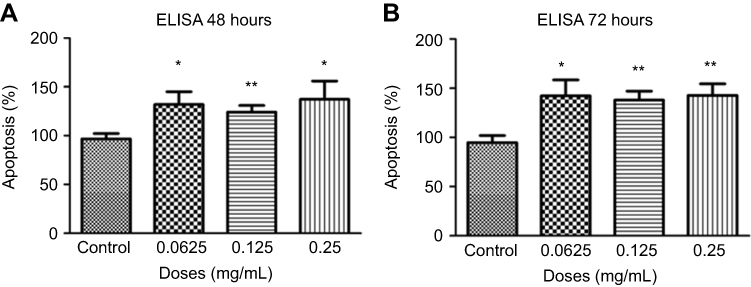 |
Figure 8 Apoptosis following treatments with different concentrations of ranibizumab. Apoptosis, as measured using the cell death detection enzyme-linked immunosorbent assay (ELISA) assay, was significantly increased at half the clinical (0.0625 mg/mL), clinical (0.125 mg/mL), and double the clinical dose (0.25 mg/mL) of ranibizumab for both 48 (A) and 72 (B) hrs. There was increased apoptosis present at 72 hrs compared to 48 hrs. Data are expressed as means±SD. n=4. *p<0.04, **p<0.005 compared to controls. |
Increased apoptosis and necrosis with rat anti-VEGF concentrations
Different concentrations of rat-anti-VEGF at 48 hrs had a significant increase in necrosis at half the clinical dose (0.0625 mg/mL; 134.80±30.61%, p=0.01), the clinical dose (0.125 mg/mL; 143.00±33.29%, p=0.003), and double the clinical dose (0.25 mg/mL; 172.50±48.52%, p=0.0002) by 29.80%, 38.00%, 67.50%, respectively, when compared to untreated controls (105.00±21.46%) (Figure 9A). The cell death detection ELISA assay after 48 hrs for different rat anti-VEGF concentrations showed increased apoptosis at half the clinical dose (0.0625 mg/mL; 139.80±29.90%, p=0.001), the clinical dose (0.125 mg/mL; 143.10±33.29%, p=0.002), and double the clinical dose (0.25 mg/mL; 152.40±33.46%, p=0.0002) by 41.90%, 45.20%, and 54.50%, respectively, when compared to untreated controls (97.88±25.41%) (Figure 9B).
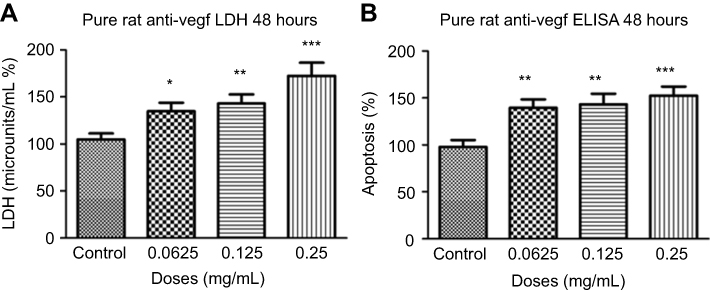 |
Figure 9 Necrosis and apoptosis following treatments with different concentrations of rat anti-VEGF. Necrosis (A) and apoptosis (B) at 48 hrs were significantly increased at half the clinical (0.0625 mg/mL), clinical (0.125 mg/mL), and double the clinical dose (0.25 mg/mL) of rat anti-VEGF measured using the lactate dehydrogenase (LDH) assay and cell death detection enzyme-linked immunosorbent assay (ELISA) assay. Data are expressed as means±SD. n=4. *p<0.01, **p<0.003, ***p<0.0002 compared to controls. |
Discussion
The aim of this study was to obtain in vitro and animal model data to correlate with in vivo clinical observations. The first consideration was determination of the appropriate anti-VEGF concentrations. The values from the calculations of ranibizumab dilutions in the human vitreous were correlated to the rat vitreous in order to mimic the human clinical dose in rat models. Based on calculations and concentrations used in past studies, 0.125 mg/mL of ranibizumab was determined to be the clinical dose.15,16 The clinical intravitreal dose of ranibizumab is 0.5 mg, resulting in a concentration of 0.125 mg/mL in the vitreum of human patients. As such, 0.125 mg/mL was the final vitreous and medium concentration used for the in vitro and in vivo experiments based on the average rats vitreous volume being 0.05 mL.16,17 Using 0.125 mg/mL as the final clinical concentration, half the clinical dose (0.0625 mg/mL) was also tested, as well as double the clinical dose (0.25 mg/mL) which is also the clinically relevant concentration of bevacizumab, another anti-VEGF clinically used for DME.
In relation to the frequency of injections, patients typically receive an anti-VEGF injection once a month for 3 months and are clinically assessed on month 4. They are then treated on an as-needed basis until they are clinically stable according to their OCT tests and clinical assessments.18 To simulate the treatment regime with rats, the rodents were injected once a week for 3 weeks and sacrificed on week 4.
Compared to non-diabetic rats, the diabetic rats were more sensitive to different concentrations of anti-VEGF injections. Compared to untreated diabetic controls, diabetic rats showed significantly increased apoptotic deaths at half the clinical, clinical, and double the clinical doses, whereas non-diabetic rats showed significantly increased apoptotic death at only double the clinical dose. The results were expected given the nature of the disease since diabetics are more sensitive to ocular changes compared to non-diabetics.18,19 The apoptotic death centered around the GCL and INL which also correlates with a previous study.19 While anti-VEGF therapy improves vascular changes, past studies have also indicated that VEGF is involved in neuroprotection by protecting retinal cells against damaging insults like hypoxia, glutamate excitotoxicity, and deprivation of serum.3–10,19 To ensure survival, retinal neurons have been shown to provide continuous trophic support. Under ischemic conditions in the retina, VEGF expression in neurons is increased.19–21 By eliminating VEGF through intravitreal anti-VEGF injections, neuronal cells that rely on VEGF for survival, such as glial, bipolar, and amacrine cells, are put at risk of dying.19
When comparing the clinical dose of ranibizumab and the clinical dose of rat anti-VEGF, although there was no significant difference between the two, rat anti-VEGF showed an increased number of apoptotic cells when compared to ranibizumab. Ranibizumab has been shown in a previous study as well as our preliminary VEGF ELISA (Figure S8) to have some cross over effect in blocking rat VEGF and thus cause apoptotic cell death.22 The non-diabetic rats were not significantly different from the untreated control. For the diabetic rats, both clinical ranibizumab and rat anti-VEGF had significantly increased number of apoptotic cells compared to the untreated diabetic control.
In regards to the frequency of injections and number of apoptotic cells, non-diabetic and diabetic rats who received a single injection versus three injections showed no significant difference. However, rats treated with three injections showed a trend of increasing numbers of apoptotic deaths. A prolonged treatment and additional injections are likely to further increase cell apoptosis. For the non-diabetic rats, the results from single injections versus three injections were not significantly different compared to the untreated control. For the diabetic rats, having an injection, either once or three times, resulted in significantly increased apoptotic death compared to untreated diabetic control. Multiple injections lead to increased apoptotic cell death due to greater reduction of VEGF and less neuroprotection in the eye.
Most of the apoptotic death observed in vivo animal experiments occurred in the ganglion cell layer. As such, for the in vitro experiments, it was important for the mixed retinal cell culture to contain RGCs. To test for the presence of RGCs, cells were stained for Class III β-tubulin (TUJ-1) which is a constituent of neuronal microtubules and frequently expressed on RGCs, as well as Brn3a and Thy 1 which are also RGC-specific markers.23 Thy 1 is a glycophosphatidylinositol-anchored cell surface protein of the immunoglobulin superfamily which has been shown to be specifically expressed on RGCs.24–26 The expression of Thy 1 in the mixed retinal cell culture was at a level similar to past studies.24,27,28 Brn3a is a class IV POU domain transcription factor that has an important role in differentiation, survival, and axonal elongation during the development of RGCs.28 Brn3a has been determined to be a reliable marker of RGCs in past studies.24,25,29,30,31 The mixed retinal cell culture used for the study had expression of all 3 markers as well as had signs of outgrowth and elongation, indicating the presence of RGCs.
Exposure to increasing concentrations of ranibizumab for 48 and 72 hrs leads to a decrease in RGCs as detected by TUJ-1 staining. At 72 hrs, the RGCs showed no significant difference at half the clinical dose and a 24.19% and 28.89% significant decrease (p<0.04) at the clinical and double the clinical dose. In regards to morphology, fewer contacts between RGCs and fewer outgrowths were observed. Staining for cleaved caspase-3 revealed that half the clinical, clinical, and double the clinical dose of ranibizumab resulted in increased apoptotic death compared to untreated control. Co-staining with TUJ-1 revealed that majority of RGCs remained viable until double the clinical dose. The support cells around RGCs showed increased apoptosis at all doses. The observation correlates with the animal results since apoptotic death was also observed in the INL. The results suggest that ranibizumab affects the survival of the supporting cells surrounding RGCs, which in turn affects their morphology and decreases RGC numbers. The damage to the supporting cells may affect the morphology of the optic nerve by causing an increase in the cup volume and an increase in the cup/disk ratio as shown in our previous clinical study. Previous studies have noted that anti-VEGF alone is not cytotoxic to pure RGC cell lines but when the cells are exposed to oxidative stress, the protective effect of VEGF is eliminated.32–35 Through the use of a mixed retinal cell culture, which is the closet cell based in vitro model to the composition of an in vivo retina, we have verified that the clinical human dose of anti-VEGF does effect RGCs. The anti-VEGF treatments eliminate VEGFs neuroprotective functions, and potentially other unknown roles, causing the surrounding supporting cells to become cytotoxic and die thereby affecting RGC morphology and numbers.
The immunofluorescence results were supported by colorimetric assays, which suggested that as the concentration of ranibizumab increased, a significant decrease in cellular metabolic activity and a significant increase in cytotoxicity through necrosis and apoptosis at both 48 and 72 hrs occurred. In accordance with the cleaved caspase-3 results, both half the clinical, clinical, and double the clinical dose all showed significant increased apoptotic death when tested using the cell death detection ELISA. Rat anti-VEGF was tested using the established concentrations to determine whether the antibody or the anti-VEGFs vehicle increased cell death. According to the results, the antibody alone was more cytotoxic. Results from the LDH assay demonstrated that even at half the clinical dose, as well as at clinical and double the clinical doses, significantly increased necrosis occurred. The cell death detection ELISA showed further significant apoptotic death under all 3 concentrations.
This is the first study to utilize a mixed retinal cell culture and conduct in vitro and in vivo experiments that mimic clinical conditions. The benchtop approach was a complementary addition to the overall study aimed at explaining the clinical observation that repeated anti-VEGF injections may be detrimental to the optic nerve by increasing cup volume and increasing vertical cup/disk ratio over time. For the aforementioned reason, the current study sought to obtain comprehensive results by the conduct of animal and mixed retinal cell culture experiments to determine whether different doses of anti-VEGF result in any changes to the retina.
Conclusions
In conclusion, repeated anti-VEGF injections may be detrimental to the retina by decreasing cellular metabolic activity and increasing cytotoxicity of retinal cells through necrosis and apoptosis. The cytotoxicity of the support cells affects RGC morphology and numbers which may explain why clinically anti-VEGF treatment results in increased cup volume and increased cup/disk ratio. In contrast to current recommendations, the results provide a cautionary note to monitor both the retina and optic nerve status in patients undergoing frequent anti-VEGF injections.
Abbreviations list
ACVS, Animal Care and Veterinary Services; BRB, Blood–Retinal Barrier; BSA, Bovine Serum Albumin; C/D, Cup to Disk; DME, Diabetic Macular Edema; DR, Diabetic Retinopathy; FBS, Fetal Bovine Serum; GCL, Ganglion Cell Layer; INL, Inner Nuclear Layer; LDH, Lactate dehydrogenase; MTT, Thiazolyl Blue Tetrazolium Bromide; NBA, Neurobasal A medium; PBS, Phosphate-Buffered Saline; RNFL, Retinal Nerve Fiber Layer; STZ, Streptozotocin; TUJ-1, Class III β-tubulin; VEGF, Vascular Endothelial Growth Factor.
Acknowledgments
The authors would like to thank Francis Feng for helping to teach animal technical skills and Dr William Hodge for his assistance in statistical analyses.
An abstract of this paper was presented at the ARVO 2017 Annual Meeting (Baltimore, MD, USA), May 7-11, 2017. It was selected by the Annual Meeting Program Committee as a hot topic, representing the newest and most innovative research being conducted in various specialties; this distinction was awarded to just over 2% of all 2017 annual meeting abstracts. An abstract was also presented at the 2017 COS Annual Meeting and Exhibition (Montreal, QC, Canada), June 15-18, 2017.
Disclosure
The authors report no conflicts of interest in this work.
References
1. Kaur C, Foulds W, Ling E. Blood-retinal barrier in hypoxic ischaemic conditions: basic concepts, clinical features and management. Prog Retin Eye Res. 2008;27(6):622–647. doi:10.1016/j.preteyeres.2008.09.003
2. Holt RIG, Cockram CS, Flyvbjerg A, Goldstein BJ. Textbook of Diabetes.
3. D’Amore PA. Vascular endothelial cell growth factor-A: not just for endothelial cells anymore. Am J Pathol. 2007;171:14–18. doi:10.2353/ajpath.2007.070385
4. Beazley-Long N, Hua J, Jehle T, et al. VEGF-A165b is an endogenous neuroprotective splice isoform of vascular endothelial growth factor A in vivo and in vitro. Am J Pathol. 2013;183:918–929. doi:10.1016/j.ajpath.2013.05.031
5. Miguel NC, Matsuda M, Portes AL, et al. In vitro effects of bevacizumab treatment on newborn rat retinal cell proliferation, death, and differentiation. Invest Ophthalmol Vis Sci. 2012;53:7904–7911. doi:10.1167/iovs.12-10283
6. Kim I, Ryan AM, Rohan R, et al. Constitutive expression of VEGF, VEGFR-1, and VEGFR-2 in normal eyes. Invest Ophthalmol Vis Sci. 1999;40:2115–2121.
7. Jin KL, Mao XO, Greenberg DA. Vascular endothelial growth factor: direct neuroprotective effect in in vitro ischemia. Proc Natl Acad Sci USA. 2000;97:10242–10247. doi:10.1073/pnas.97.18.10242
8. Gomes E, Papa L, Hao T, Rockwell P. The VEGFR2 and PKA pathways converge at MEK/ERK1/2 to promote survival in serum deprived neuronal cells. Mol Cell Biochem. 2007;305:179–190. doi:10.1007/s11010-007-9542-2
9. Tolosa L, Mir M, Asensio VJ, Olmos G, Llado J. Vascular endothelial growth factor protects spinal cord motoneurons against glutamateinduced excitotoxicity via phosphatidylinositol 3-kinase. J Neurochem. 2008;105:1080–1090. doi:10.1111/j.1471-4159.2007.05206.x
10. Mizutani M, Kern TS, Lorenzi M. Accelerated death of retinal microvascular cells in human and experimental diabetic retinopathy. J Clin Invest. 1996;97:2883–2890. doi:10.1172/JCI118746
11. Diabetes and Your Eyesight. Diabetes and your eyesight | glaucoma research foundation. Available from: http://www.glaucoma.org/glaucoma/diabetes-and-your-eyesight.php.
12. Gajdosík A, Gajdosíková A, Stefek M, Navarová J, Hozová R. Streptozotocin-induced experimental diabetes in male wistar rats. Gen Physiol Biophys. 1999;18:54–62.
13. Chen S, Evans T, Deng D, Cukiernik M, Chakrabarti S. Hyperhexosemia induced functional and structural changes in the kidneys: role of endothelins. Nephron. 2002;90:86–94. doi:10.1159/000046319
14. Cai L, Chen S, Evans T, Cherian MG, Chakrabarti S. Endothelin-1-mediated alteration of metallothionein and trace metals in the liver and kidneys of chronically diabetic rats. Int J Exp Diabetes Res. 2002;3:193–198.
15. Klettner A, Roider J. Comparison of bevacizumab, ranibizumab, and pegaptanib in vitro: efficiency and possible additional pathways. Invest Ophthalmol Vis Sci. 2008;49(10):4523–4527. doi:10.1167/iovs.08-2055
16. Costa R, Carneiro ÃN, Rocha A, et al. Bevacizumab and ranibizumab on microvascular endothelial cells: a comparative study. J Cell Biochem. 2009;108(6):1410–1417. doi:10.1002/jcb.22378
17. Hussain N, Ghanekar Y, Kaur I. The future implications and indications of anti-vascular endothelial growth factor therapy in ophthalmic practice. Indian J Ophalmol. 2007;55:445–450. doi:10.4103/0301-4738.36480
18. Lanzetta P, Loewenstein A. Fundamental principles of an anti-VEGF treatment regimen: optimal application of intravitreal anti–vascular endothelial growth factor therapy of macular diseases. Graefes Arch Clin Exp Ophthalmol. 2017;255(7):1259–1273. doi:10.1007/s00417-017-3647-4
19. Park H-YL, Kim JH, Park CK. Neuronal cell death in the inner retina and the influence of vascular endothelial growth factor inhibition in a diabetic rat model. Am J Pathol. 2014;184(6):1752–1762. doi:10.1016/j.ajpath.2014.02.016
20. Famiglietti EV, Stopa EG, McGookin ED, Song P, LeBlanc V, Streeten BW. Immunocytochemical localization of vascular endothelial growth factor in neurons and glial cells of human retina. Brain Res. 2003;969:195–204.
21. Shima DT, Gougos A, Miller JW, et al. Cloning and mRNA expression of vascular endothelial growth factor in ischemic retinas of macaca fascicularis. Invest Ophthalmol Vis Sci. 1996;37:1334–1340.
22. Joachim SC, Renner M, Reinhard J, et al. Protective effects on the retina after ranibizumab treatment in an ischemia model. PLoS One. 2017;12(8):1–22. doi:10.1371/journal.pone.0182407
23. Sharma RK, Netland PA. Early born lineage of retinal neurons express class III β-tubulin isotype. Brain Res. 2007;1176:11–17. doi:10.1016/j.brainres.2007.07.090
24. Zhang XM, Li Liu DT, Chiang SW, et al. Immunopanning purification and long-term culture of human retinal ganglion cells. Mol Vis. 2010;16:2867–2872.
25. Barnstable CJ, Drager UC. Thy-1 antigen: a ganglion cell specific marker in rodent retina. Neuroscience. 1984;11:847–855.
26. Xu Z, Jiang F, Zeng Y, Alkhodari HT, Chen F. Culture of rat retinal ganglion cells. J Huazhong Univ Sci Technolog Med Sci. 2011;31(3):400–403. doi:10.1007/s11596-011-0389-0
27. Leifer D, Lipton SA, Barnstable CJ, Masland RH. Monoclonal antibody to Thy-1 enhances regeneration of processes by rat retinal ganglion cells in culture. Science. 1984;224:303–306.
28. Snow RL, Robson JA. Ganglion cell neurogenesis, migration and early differentiation in the chick retina. Neuroscience. 1994;58:399–409.
29. Nadal-Nicola´s FM, Jime´nez-Lo´pez M, Sobrado-Calvo P, et al. Brn3a as a marker of retinal ganglion cells: qualitative and quantitative time course studies in naïve and optic nerve–injured retinas. Invest Ophthalmol Vis Sci. 2009;50(8):3860–3868. doi:10.1167/iovs.08-3267
30. Liu W, Khare SL, Liang X, et al. All Brn3 genes can promote retinal ganglion cell differentiation in the chick. Development. 2000;127:3237–3247.
31. Quina LA, Pak W, Lanier J, et al. Brn3a expressing retinal ganglion cells project specifically to thalamocortical and collicular visual pathways. J Neurosci. 2005;25:11595–11604. doi:10.1523/JNEUROSCI.2837-05.2005
32. Schnichels S, Hagemann U, Januschowski K, et al. Comparative toxicity and proliferation testing of aflibercept, bevacizumab and ranibizumab on different ocular cells. Br J Ophthalmol. 2013;97(7):917–923. doi:10.1136/bjophthalmol-2013-303130
33. Thaler S, Fiedorowicz M, Choragiewicz TJ, et al. Toxicity testing of the VEGF inhibitors bevacizumab, ranibizumab and pegaptanib in rats both with and without prior retinal ganglion cell damage. Acta Ophthalmol. 2008;88(5):e170–e176. doi:10.1111/aos.2010.88.issue-5
34. Brar VS, Sharma RK, Murthy RK, Chalam KV. Bevacizumab neutralizes the protective effect of vascular endothelial growth factor on retinal ganglion cells. Mol Vis. 2010;16:1848–1853.
35. Brar VS, Sharma RK, Murthy RK, Chalam KV. Evaluation of differential toxicity of varying doses of bevacizumab on retinal ganglion cells, retinal pigment epithelial cells, and vascular endothelial growth factor–enriched choroidal endothelial cells. J Ocul Pharmacol Ther. 2009;25(6):507–512. doi:10.1089/jop.2009.0028
Supplementary material
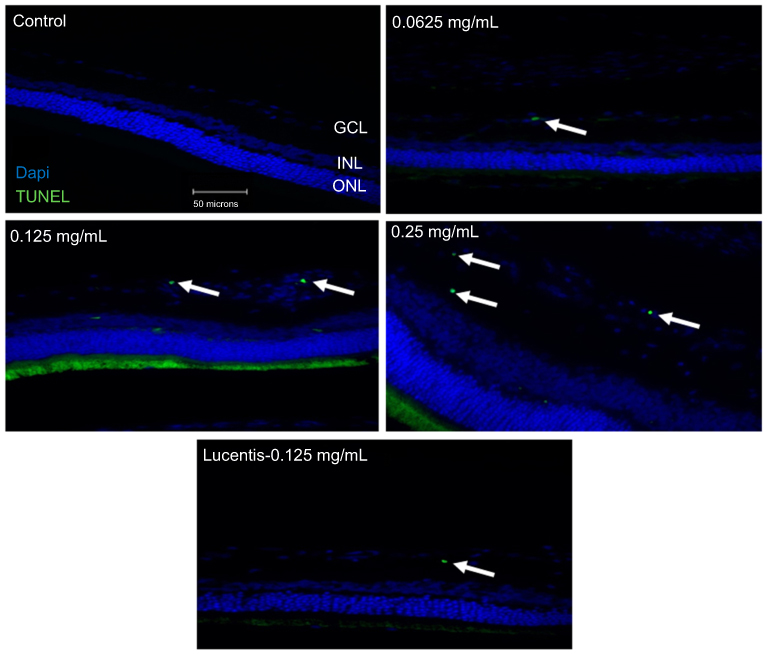 |
Figure S1 Terminal deoxynucleotidyl transferase dUTP nick end labeling (TUNEL) staining of non-diabetic rat retina. TUNEL staining performed in non-diabetic rats showed increased apoptotic cells in the ganglion cell layer following different doses of anti-VEGF injections compared with untreated retina from the non-diabetic control group. Blue represents 4′,6-diamidino-2-phenylindole (DAPI)-stained nuclei and green represents TUNEL staining. Magnification x40. n=5 for each group. Scale bar: 50 µm. |
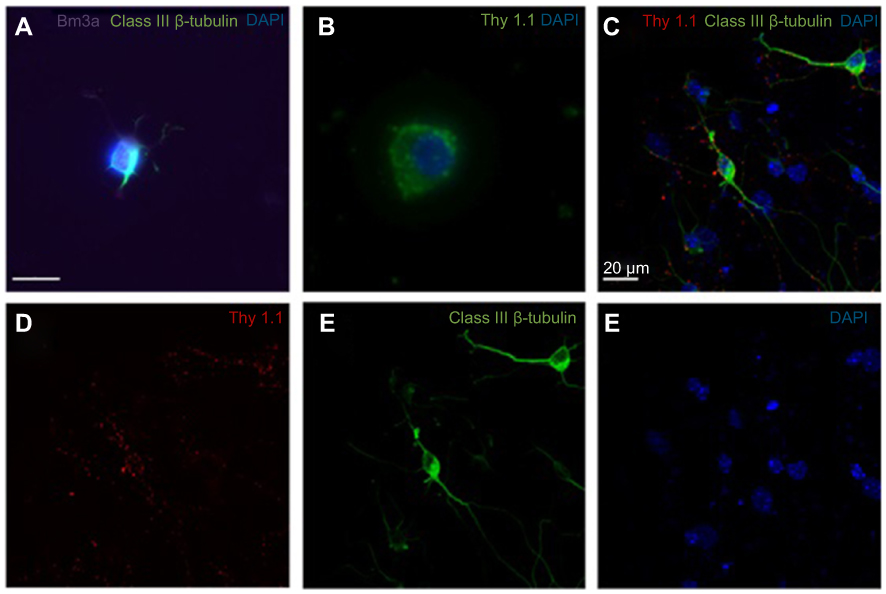 |
Figure S2 Expression of retinal ganglion cell (RGC)-specific markers in the primary rat retinal cell culture. A-B Immunofluorescence of primary rat retinal cell culture at day 1 of culture showed positive expression of Brn3a, Class III β-Tubulin (A) and Thy1.1 (B). Confocal triple immunofluorescence showed the co-staining of Thy1.1 (D), Class III β-Tubulin (E), and nuclear 4′,6-diamidino-2-phenylindole (DAPI) (F) in cells at day 3 of culture (merged image in C). The RGCs in culture showed dendritic outgrowth and elongation with axonal processes frequently contacting each other. A-B Magnification x80. C-F Magnification x60. Scale bars: 20 µm. |
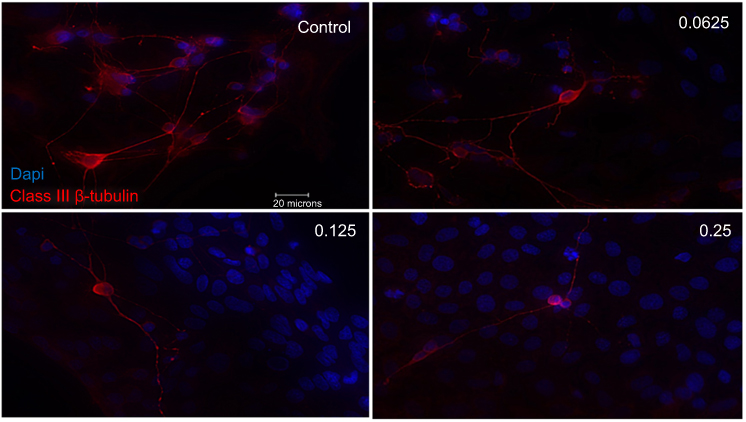 |
Figure S3 Morphological effect of different concentrations of ranibizumab on retinal ganglion cells (RGCs) following 48 hrs post-treatment. RGCs were stained for nuclei (blue) and Class III β-tubulin (red). Immunofluorescence of RGCs under different concentrations of ranibizumab for 48 hrs showed that as the concentration increased, the morphology of the RGCs changed. As the concentration went from untreated control to double the clinical dose (0.25 mg/mL), the number of RGCs decreased, had fewer contacts between each other, and had fewer dendritic outgrowths. Magnification x60. Scale bar: 20 µm. |
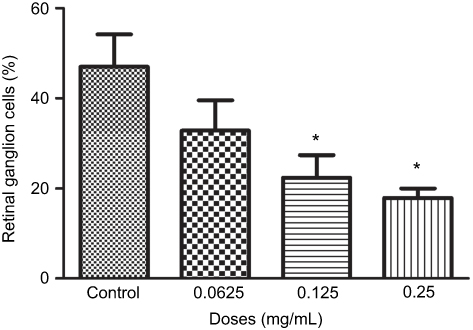 |
Figure S4 Percentage of retinal ganglion cells (RGCs) under different concentrations of ranibizumab. The percentage of RGCs significantly decreased at the clinical dose (0.125 mg/mL) and double the clinical dose (0.25 mg/mL) of ranibizumab at 48 hrs. Data are expressed as means±SD. n=3*p<0.04 compared with control. |
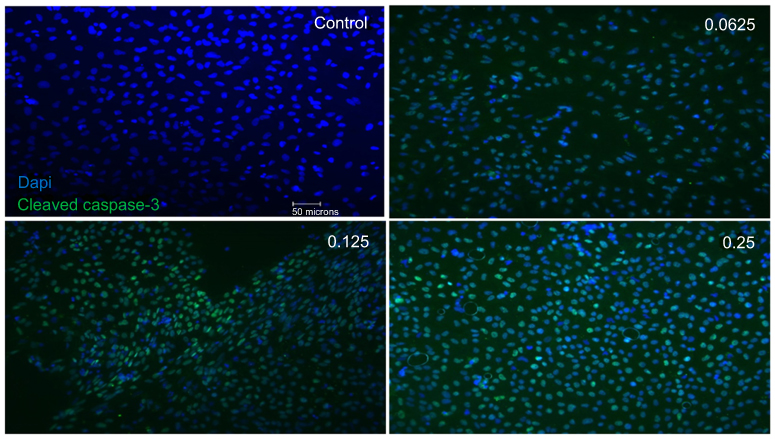 |
Figure S5 Apoptotic cell death upon exposure to different concentrations of ranibizumab following 48 hrs post-treatment. Immunofluorescence staining for cleaved caspase-3 (green) and nuclei (blue) in the mixed retinal cell culture under different ranibizumab concentrations for 48 hrs showed that there was an increase in apoptotic cell death in half the clinical (0.0625 mg/mL), clinical (0.125 mg/mL), and double (0.25 mg/mL) the clinical doses compared to untreated control (0 mg/mL). Magnification x20. Scale bar: 50 µm. |
 |
Figure S6 Apoptotic cell death upon exposure to different concentrations of ranibizumab following 72 hrs post-treatment. Immunofluorescence staining for cleaved caspase-3 (green) and nuclei (blue) in the mixed retinal cell culture under different ranibizumab concentrations for 72 hrs corresponded with the 48 hr results. There was increased apoptotic cell death observed at half the clinical (0.0625 mg/mL), clinical (0.125 mg/mL), and double the clinical doses (0.25 mg/mL) compared to untreated control (0 mg/mL). Magnification x20. Scale bar: 50 µm. |
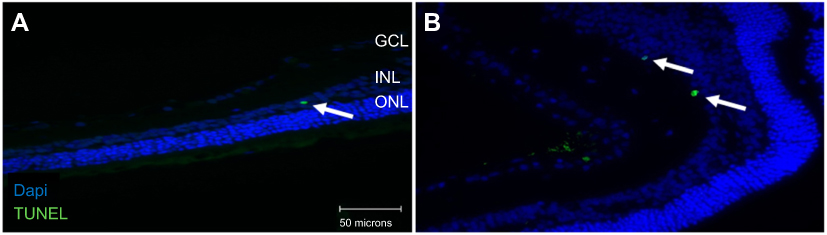 |
Figure S7 Apoptosis in the inner nuclear layer (INL) following terminal deoxynucleotidyl transferase dUTP nick end labeling (TUNEL) staining. TUNEL analysis of retinal sections showed apoptosis in the INL (arrowhead) as well for both the non-diabetic (A) and diabetic (B) rats undergoing clinical anti-VEGF injections (0.125 mg/mL). Blue represents 4′,6-diamidino-2-phenylindole (DAPI)-stained nuclei and green represents TUNEL staining. INL, inner nuclear layer. Magnification x40. Scale bar: 50 µm. |
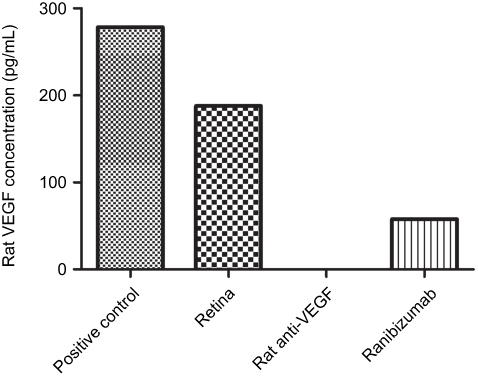 |
Figure S8 Ranibizumab binds and neutralizes rat VEGF. Measured using a rat VEGF enzyme-linked immunosorbent assay (ELISA) kit (R&D Systems Inc., Minneapolis, MN) on a control rat retina, the clinical dose of ranibizumab (0.125 mg/mL) was able to bind and neutralize rat VEGF but not as efficiently as rat anti-VEGF. n =1. |
 © 2019 The Author(s). This work is published and licensed by Dove Medical Press Limited. The full terms of this license are available at https://www.dovepress.com/terms.php and incorporate the Creative Commons Attribution - Non Commercial (unported, v3.0) License.
By accessing the work you hereby accept the Terms. Non-commercial uses of the work are permitted without any further permission from Dove Medical Press Limited, provided the work is properly attributed. For permission for commercial use of this work, please see paragraphs 4.2 and 5 of our Terms.
© 2019 The Author(s). This work is published and licensed by Dove Medical Press Limited. The full terms of this license are available at https://www.dovepress.com/terms.php and incorporate the Creative Commons Attribution - Non Commercial (unported, v3.0) License.
By accessing the work you hereby accept the Terms. Non-commercial uses of the work are permitted without any further permission from Dove Medical Press Limited, provided the work is properly attributed. For permission for commercial use of this work, please see paragraphs 4.2 and 5 of our Terms.