")
Back to Journals » Biologics: Targets and Therapy » Volume 13
Rosmarinic acid monotherapy is better than the combination of rosmarinic acid and telmisartan in preventing podocyte detachment and inhibiting the progression of diabetic nephropathy in rats
Authors Samsu N , Soeharto S, Rifai M , Rudijanto A
Received 9 May 2019
Accepted for publication 19 August 2019
Published 30 August 2019 Volume 2019:13 Pages 179—190
DOI https://doi.org/10.2147/BTT.S214820
Checked for plagiarism Yes
Review by Single anonymous peer review
Peer reviewer comments 2
Editor who approved publication: Professor Wei-Qun Ding
Nur Samsu,1 Setyawati Soeharto,2 Muhaimin Rifai,3 Achmad Rudijanto4
1Department of Internal Medicine, Division of Nephrology and Hypertension, Faculty of Medicine; 2Department of Pharmacology, Faculty of Medicine; 3Department of Biology, Faculty of Mathematics and Sciences; 4Department of Internal Medicine, Division of Endocrinology and Metabolic, Faculty of Medicine, Universitas Brawijaya, Malang, Indonesia
Correspondence: Nur Samsu
Department of Internal Medicine, Division of Nephrology and Hypertension, Faculty of Medicine, Universitas Brawijaya, Malang, East Java, 65122, Indonesia
Tel +62 812 331 6315
Email [email protected]
Background: Podocyte injury and its subsequent detachment play a critical role in the development and progression of diabetic nephropathy (DN). The objective of this study was to investigate the effect of rosmarinic acid (RA) in preventing podocyte detachment and inhibiting the progression of DN in streptozotocin (STZ)-induced diabetic in rats.
Methods: We used 20 adult male Wistar rats as experimental animals, which were randomly divided into 5 groups (n=4 per group): nondiabetic rat group (negative control) and 4 groups of STZ-induced diabetic rats, namely, 1 group untreated diabetic rats (positive control) and 3 groups treated diabetic rats with RA 75 mg/kg, telmisartan (TMS) 1 mg/kg and combination of RA 75 mg/kg with TMS 1 mg/kg), respectively. After 8 weeks of therapy, urinary levels of podocin, nephrin and albumin and also serum cystatin C levels were examined by ELISA. The expression of p65 nuclear factor-kB by immunohistochemistry whereas expression of podocin and nephrin glomerulus were examined by immunofluorescence.
Results: In the treated diabetic groups, we found that urinary level of podocin and nephrin, albumin urine excretion and serum cystatin C levels were significantly lower than the positive control group. Compared to negative controls, the group of treated diabetic rats did not differ significantly in preventing increased excretion of urinary nephrin and podocin. Meanwhile, treatment with RA monotherapy was significantly better than TMS or a combination of RA with TMS in reducing albumin excretion and preventing decreased kidney function.
Conclusion: In STZ-induced diabetic rats, RA can prevent podocyte detachment. Treatment with RA and TMS either monotherapy or in combination can inhibit the development and progression of DN. However, the combination of both did not show a synergistic effect, even have higher urinary albumin excretion and worse kidney function compared to the RA monotherapy.
Keywords: rosmarinic acid, telmisartan, podocin, nephrin, diabetic nephropathy
Introduction
Glomerular disease, both diabetic and nondiabetic, is still the main cause of chronic kidney disease and end-stage renal disease (ESRD). Glomerular disease as a consequence of podocyte dysfunction accounts for about 90% ESRD.1 Podocytes are glomerular visceral epithelial cells that have terminal differentiation and play an important role in the regulation of glomerular function.2 On the other hand, podocytes are cells that are very susceptible to injury. Podocytes that get an injury will respond in the form of effacement, proliferation, apoptosis or detachment.3 Severe and persistent injury, such as in chronic hyperglycemia, will generally cause detachment and/or apoptosis, thereby reducing the number of podocytes.3,4 Injury to podocytes due to uncontrolled hyperglycemia and resultant podocyte apoptosis are the most significant events that seem to contribute to decreasing podocyte density which can be evaluated as microalbuminuria.5 Podocytes which are detached from glomerular basement membrane (GBM) become susceptible to apoptosis.6 Among several mechanisms involved in causing damage to podocytes and its subsequent detachments and apoptosis, injuries sustained by increased oxidative stress turn out to be the most important mechanism.7 Podocyte detachment and apoptosis cause podocytopenia and will later lead to the formation of synechia and glomerular sclerosis.8 On the basis of this understanding, it is important to explore various therapeutic agents and drug targets that might offer certain levels of protection for podocytes by reducing stress oxidase, and subsequent podocyte detachment that can ultimately help in treating DN does not respond well to current treatment options and has a high morbidity and mortality.7
Rosmarinic acid (RA) is a plant-based compound found in a wide variety of spices which has the function as an antioxidant and anti-inflammatory9; decreases nuclear factor-kB (NF-kB); increases glutathione transferase, anti-activity of Bcl-2, peroxynitrite scavengers10,11; improves the activity of superoxide dismutase, glutathione peroxidase and catalase in the kidneys9 and inhibits CTGF,12 which is a downstream effector of TGF-β. Telmisartan (TMS) is the ARB of choice in managing DN with several advantages including inhibiting matrix accumulation, 24-hr half-life, partial PPAR-Ƴ agonists and high lipophilicity.13 PPAR-Ƴ agonists have beneficial effects to increase insulin sensitivity and increase lipid metabolism.14 PPAR-Ƴ agonists also have antifibrotic effects in nondiabetic or nonhyperlipidemic CKD models, which can improve the development of sclerosis.15 This effect is associated with decreased PAI-1 and TGF-β and decreased macrophage infiltration and podocyte protection against injury.16,17 Hence, with the double effect of TMS on the blocking of AT1 receptor and activating PPAR-Ƴ, it is expected to provide more optimal therapeutic results in the management of DN, especially in DN with hypertension, metabolic syndrome and insulin resistance. Based on the information above, we hypothesize that RA can prevent detachment of podocyte and inhibit the progression of DN, and the combination of RA with TMS has a better effect than individually.
Methods
Materials
Streptozotozin (STZ) was purchased from Bio World with catalog number 41910012-3 (714990). RA (molecular formula: C18H16O8, molecular weight: 360.31) 96% was purchased from Sigma-Aldrich Co (St Louis, MO, USA) with product number 536954. TMS (Micardis®) from Boehringer Ingelheim Pharmaceuticals, Inc. Podocin urine, nephrin urine and albumin were measured by rat NPHS2 Elisa kit 96T (cat. no. E1595Ra), Rat NPHN Elisa kit 96T (cat. no. E1366Ra) and Rat Albumin Elisa Kit 96T (cat. no. E1276Ra), respectively, whereas cystatin C was measured by Rat Cys-C Elisa kit 96T (cat. no. E0145Ra). All of Elisa kits were purchased from Bioassay Technology Laboratory (Shanghai Korain Biotech Co Ltd, China). Expression of p65 NF-kB was determined by antibody NF-kB p65 (A-12) (cat. no. sc-514451) from Santa Cruz Biotechnology, California, USA. Nephrin expression was determined by Nephrin (G-8) HRP mouse monoclonal IgG2a (cat. no. sc-376522), from Santa Cruz Biotechnology, California, USA, whereas podocin expression was determined by by rabbit anti-NPHS2/Podocin polyclonal antibody (cat. no. bs-6597R) from BIOSS Inc. (Woburn, MA, USA).
Animals
Adult male Wistar rats (7–9 weeks; 150–170 g) obtained from the Central Animal House of the Universitas Brawijaya, Malang, were used in the experiment. Before starting the experiment, the rats went through an adjustment period of 7 days. The rats were caged individually and maintained at a constant temperature and fed with a composition of 60% calories from fat to get diabetic rats with insulin resistance and free access to water. All animal procedures were approved by the Animal Ethics Committee of Universitas Brawijaya, Malang, Indonesia. The ethics committee reviewed the research protocol based on Institutional Animal Care and Use Committee guidelines.
Diabetes induction
After 1 week of adjustment, rats were given a high-fat diet for 3 weeks. On the 22nd day, the rats were fasted for 6–8 hrs (starting at 7 am) before giving STZ. The study group received STZ to induce diabetes mellitus, whereas the control group received citrate buffer without STZ. Diabetes was induced by a single intraperitoneal injection of 40 mg/kg STZ, diluted in 0.1 M sodium-citrate buffer (pH 4.5).18 Age-matched control rats received an equivalent amount of sodium citrate buffer. After STZ injection, rats get a free diet and water. Blood samples were collected from the tail vein 5 days after STZ or vehicle injection. Glucose levels were measured with a portable glucometer (Nesco). Only rats with fasting blood glucose over 280 mg/dL were considered diabetic and used for the study.
Experimental design
The rats were randomly divided into 5 groups (4 rats per group). Group 1 was negative control (normal, nondiabetic rats), group 2 was positive control (diabetic rats without therapy) and 3 groups of diabetic rats that received therapy consisting of group 3 treated with RA 75 mg/kg body weight (BW)/day, group 4 treated with TMS 1 mg/kg BW/day, and group 5 treated with a combination of RA 75 mg/kg BW/day and TMS 1 mg/kg BW/day. At the first day of the blood sugar target is reached, the rats get therapy according to the treatment group, while the rats in the control groups received saline solution. RA was prepared freshly in 25% ethanol and administered via gavage, between 7 and 8 am once a day for 8 weeks, at a volume not exceeding 0.1 mL/100 g rat weight. The choice of this dose of 75 mg/kg of RA was made based on Tavafi9 (the recommended antioxidant dose of RA was from 50 to 100 mg/kg body weight/day) and TMS 1 mg/kg body weight based on Wienen.13
In order to correct for the interference of ethanol, a group of control rats received a solution of 25% ethanol. Eight weeks after the treatment, urine specimens were collected and then the rats were anesthetized for blood collection by cardiac puncture and the kidneys were carefully removed for subsequent biochemical analysis. The biological material that was not used was disposed of following biosecurity standards.
Measurement of albumin urine, urinary nephrin and podocin and serum cystatin C level by ELISA 24-hr urine collection was performed using metabolic cage at the end of the study for measurement of albumin urine, urinary nephrin and podocin excretion, whereas serum cystatin C level was measured from a blood sample. The measurement method refers to the protocol in the ELISA kit for each examination and reading using an ELISA reader.
Renal histological analysis
Renal histological analysis was done as described previously.19 The kidneys were fixed in 10% buffered formalin, embedded in paraffin, cut into 3-μm sections and stained with hematoxylin and eosin. The sections were viewed with a light microscope (Olympus) under 400× magnification. Forty glomeruli per sample sections were photographed randomly. Glomerular area (GA) was assessed with ImageJ 1.48 software. Glomerular volume (GV) was calculated using the formula by Rangan and Tesch,20 GV =1.2545 (GA).1,5
Immunohistochemical assay
Immunohistochemical analysis was done as described previously.19 Paraffin-embedded 3-µm tissue sections were deparaffinized with xylene and gradually dehydrated in ethanol. The sections were incubated with 4% hydrogen peroxidase (15 mins at RT) to block endogenous peroxidase activity. Nonspecific binding of antibodies was blocked by incubating slides with 3% FBS +0.25% Triton X-100 (1 hr at RT). The sections were stained using rabbit anti-p65 NF-kB antibody (90 mins at RT), which were dissolved in PBS +3% FBS +0.25% Triton X-100 for expression of p65 NF-kB. Then, the slides were incubated with biotinylated secondary antibody (1 hr at RT), followed by streptavidin horseradish peroxidase (40 mins at RT). Slides were visualized using diaminobenzidine (DAB) and counterstained with hematoxylin. Slides were mounted and observed under a light microscope (Olympus) with 400× magnification. Ten glomeruli per sample section were observed randomly. After that, we calculated the total number of DAB staining area and then divided it into 10 to get the average of each glomerulus per sample observed.
Immunofluorescence staining
In brief, tissue sections were fixed with 4% paraformaldehyde for 15 mins, washed with PBS three times, permeabilized with 2% Triton X-100 for 5 mins and blocked with blocking solution (2% BSA and 2% FBS in PBS) for 30 mins. Primary and secondary antibodies were applied at the appropriate dilutions according to standard techniques. Double staining was achieved by incubating with primary antibody and FITC-conjugated secondary antibody and then incubated with rhodamine-conjugated secondary antibody for 1 hr. The negative control was performed using 2% BSA in PBS instead of the primary antibody. Images were obtained by confocal laser-scanning microscopy (Fluoview FV1000, Olympus, Tokyo, Japan) and recorded on a computer using Fluoview Ver.4.2a viewer and processed with ImageJ 1.50 software (NIH, MD, USA).
Statistical analysis
All data are presented as mean ± SD of two independent experiments. Differences between groups were determined by one-way ANOVA test, followed by post hoc test using the least significant difference. All technical data processing results were analyzed by computerization using Statistical Product and Service Solution software, IBM SPSS Statistics 20, with a significance level of 0.05 (=0.05) and a confidence level of 95% (α=0.05).
Results
Diabetic induction
The average blood glucose level after 5 days of STZ injection in the diabetes group (positive control, RA, TMS and combination RA with TMS groups) was 352±61.57 mg/dL, 388±37.17 mg/dL, 319±25.89 mg/dL and 394±49.02 mg/dL, respectively, which were not statistically different (p>0.05). In the negative control group, the average blood glucose level was 95±9.29 mg/dL which was significantly different compared to the diabetes group (Figure 1).
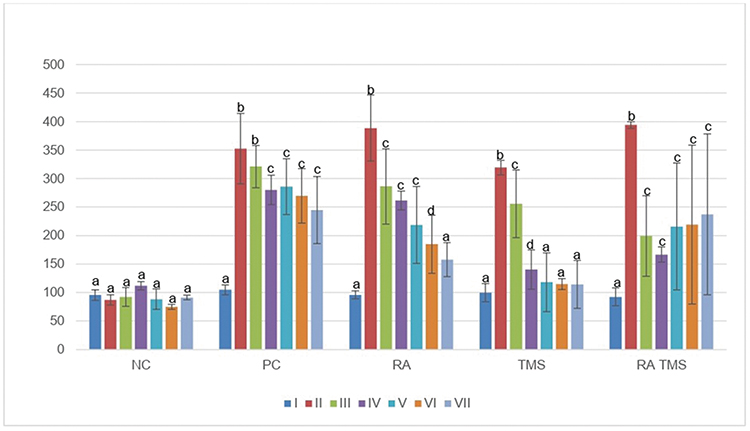 |
Figure 1 Weekly blood glucose levels were measured by portable glucometer. Notes: I, blood glucose pre-STZ injection; II, blood glucose post-STZ injection; III-VII, blood glucose levels at week 3 to week 7. Results are expressed as the mean ± SD. a, b, c and d denote the difference annotations that imply significant differences (p<0.05). a vs b (P<0.05); a vs c (P<0.05); b vs c (P<0.05), b vs d (p<0.05), c vs d (p<0.05).Abbreviations: NC, negative control; PC, positive control; RA, rosmarinic acid; STZ, streptozotocin; TMS, telmisartan. |
Diabetic nephropathy (DN) evaluation
Evaluation of DN was assessed from the presence of albuminuria and glomerular hypertrophy in the histological picture of the kidneys. Significantly elevated albuminuria was shown in the positive control group compared to the normal control group (P<0.05), whereas albuminuria levels were ameliorated in the diabetic treated group. There were no significant differences in the albuminuria level between the RA groups compared to the normal control group (Figure 2). The positive control group revealed a significant increase of GV compared to the normal control groups and treated diabetic groups (Figures 3 and 4). For RA group, there were no significant differences for albuminuria and GV compared to the normal control group (P<0.05). This result indicated that treated diabetic groups slowed down functional and pathological deterioration of DN in diabetic rats, and the RA group showed the best effect significantly compared to the other therapy groups.
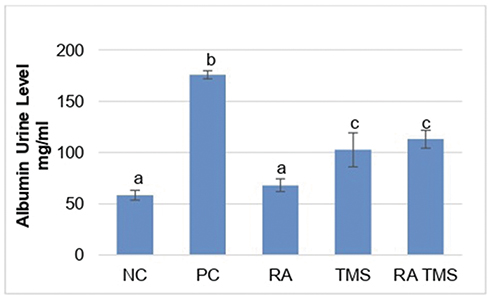 |
Figure 2 Treatment effect on albuminuria. Results are expressed as the mean ± SD. a, b and c denote the difference annotations that imply significant differences (p<0.05). a vs b (P<0.05); a vs c (P<0.05); b vs c (P<0.05). Abbreviations: NC, negative control; PC, positive control; RA, rosmarinic acid; TMS, telmisartan. |
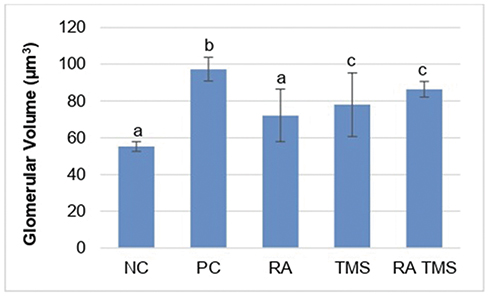 |
Figure 3 Treatment effect on glomerular volume. Glomerular volume (GV) was measured by renal histology analysis. Results are expressed as the mean ± SD. a, b and c denote the difference annotations that imply significant differences (p<0.05). a vs b (P<0.05); a vs c (P<0.05); b vs c (P<0.05). Abbreviations: NC, negative control; PC, positive control; RA, rosmarinic acid; TMS, telmisartan. |
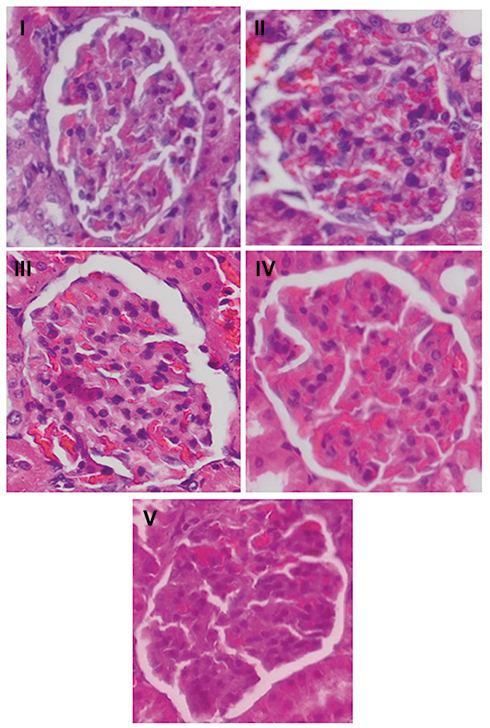 |
Figure 4 Representative photomicrographs of groups I–V (original magnification, 400×) of the HE-stained kidney section among groups. I. negative control group; II. positive control group; III. RA group; IV. TMS group; V. combination of RA with TMS group. Abbreviations: RA, rosmarinic acid; TMS, telmisartan. |
Effect of RA on urinary nephrin and podocin
The levels of urinary nephrin and podocin in the treated diabetic rat groups differed significantly compared to the positive control group. On the other hand, the treated diabetic rat groups compared to the normal control group did not find significant differences (Figure 5).
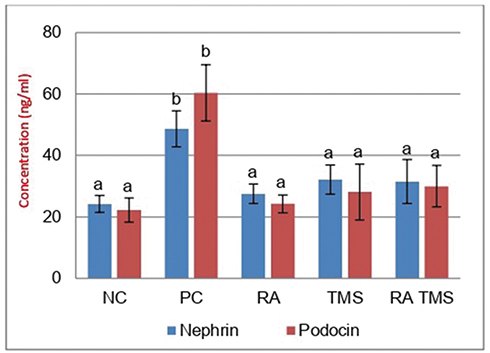 |
Figure 5 Treatment effect on nephrin and podocin urine excretion. The concentration of urinary nephrin and podocin by ELISA. Notes: Results are expressed as the mean ± SD. a and b denote the difference annotations that imply significant differences (p<0.05). a vs b (P<0.05). Abbreviations: NC, Negative control; PC, positive control; RA, rosmarinic acid; TMS, telmisartan. |
Effect of RA on expression of glomerular nephrin and podocin
The micrographs of nephrin and podocin fluorescence are represented in Figure 6. Negative staining control is used as evidence that autofluorescence does not occur. Fluorescence podocin is green, while nephrin is red. The mean graph of nephrin and podocin expression and podocin/nephrin expression ratio are presented in Figures 7 and 8. The expressions of glomerular nephrin and podocin in the RA group and the combination of RA with TMS group were significantly higher compared to the control group, both negative and positive and the TMS group. For the RA group, the expression of nephrin and podocin differed significantly compared to the combination of RA with TMS.
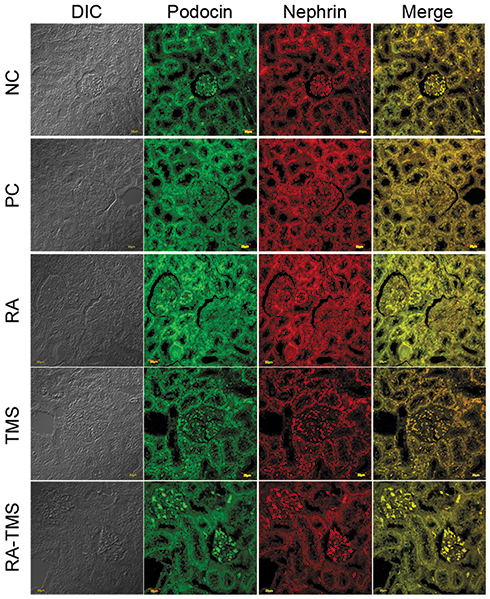 |
Figure 6 Treatment effect on glomerular podocin and nephrin. Immunofluorescence from podocin is characterized by FITC staining (green) and nephrin characterized by rhodamine staining (red). The image was taken using a confocal laser scanning microscope (magnification 400×, line scale 50=µm). Abbreviations: NC, negative control; PC, positive control; RA, rosmarinic acid; TMS, telmisartan. |
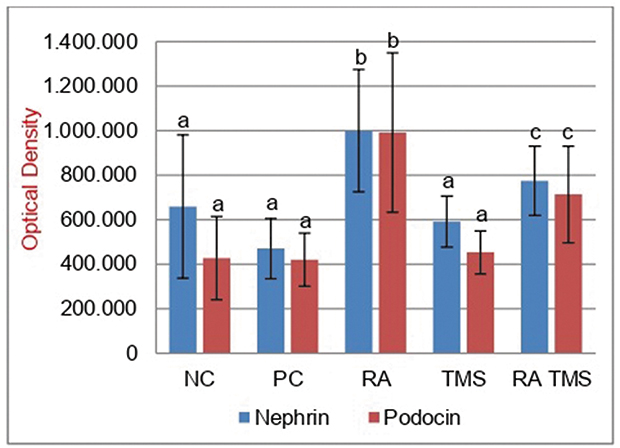 |
Figure 7 Histogram expression of glomerular podocin and nephrin. Results are expressed as the mean ± SD. a, b and b denote the difference annotations that imply significant differences (p<0.05). a vs b (p<0.05); a vs c (p<0.05); b vs c (P<0.05). Abbreviations: NC, negative control; PC, positive control; RA, rosmarinic acid; TMS, telmisartan. |
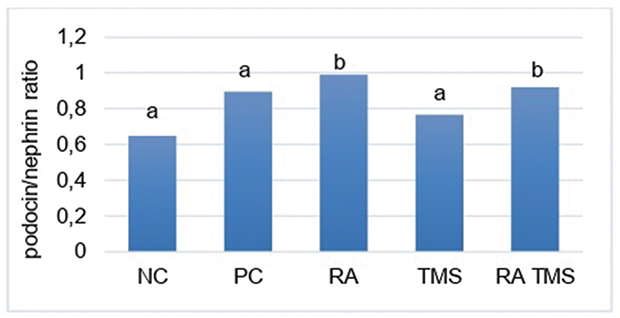 |
Figure 8 Histogram ratio of glomerular podocin/nephrin. Results are expressed as the mean ± SD. a and b denote the difference annotations that imply significant differences (p<0.05). a vs b (P<0.05). Abbreviations: NC, negative control; PC, positive control; RA, rosmarinic acid; TMS, telmisartan. |
Effect of RA on expression of p65 NF-kB
The expression of p65 NF-kB in the treated diabetic rat groups differed significantly compared to the positive control group. In the TMS group, the expression of p65 NF-kB differed significantly compared to the negative control group, whereas in the RA group and the combination of RA with the TMS group, it did not differ significantly (Figures 9 and 10).
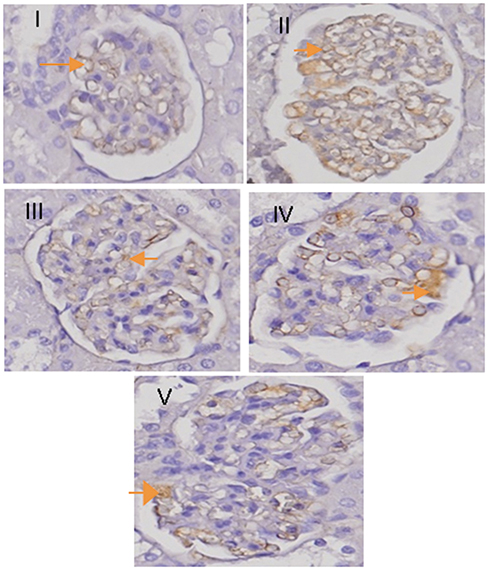 |
Figure 9 Treatment effect on p65 NF-kB expression. Immunohistochemical images of glomerular rats. The arrow indicates the expression of p65 NF-kB in the glomerulus. The image was taken using a microscope with the master scan dot slide application with a magnification of 400×. I. NC group; II. PC group; III. RA group; IV. TMS group; V. combination of RA with TMS group. Abbreviations: NC, negative control; PC, positive control; RA, rosmarinic acid; TMS, telmisartan. |
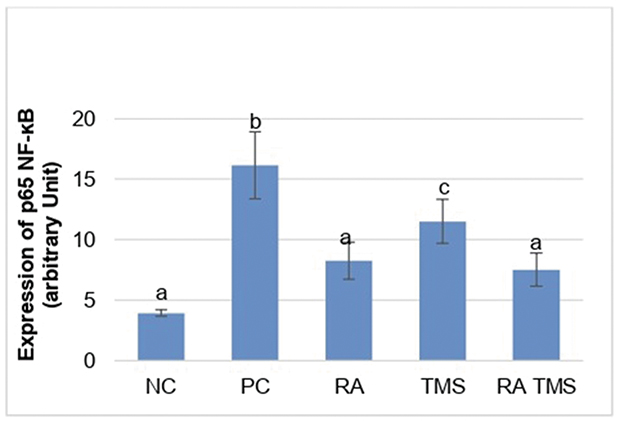 |
Figure 10 Histogram expression of glomerular p65 NF-kB. Results are expressed as the mean ± SD. a, b, and c denote the difference annotations that imply significant differences (p<0.05). a vs b (P<0.05); a vs c (P<0.05); b vs c (P<0.05). Abbreviations: NC, negative control; PC, positive control; RA, rosmarinic acid; TMS, telmisartan. |
Effect of RA on cystatin C serum level
Serum cystatin C levels were significantly increased in the positive control group in comparison with the normal control group. Compared to the positive control group, the therapy group significantly inhibited the increase in serum cystatin C level, although it was significantly higher than the negative control group. Compared to the TMS group and the combination of RA and TMS group, treatment with RA monotherapy differed significantly in preventing an increase in serum cystatin C level (Figure 11).
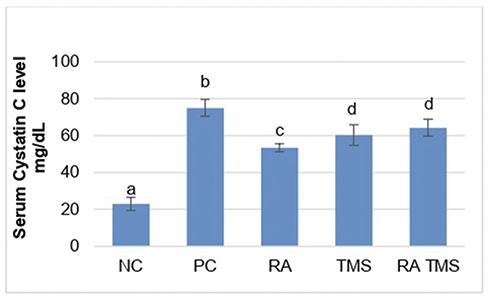 |
Figure 11 Treatment effect on serum cystatin C level. Notes: The concentration of serum cystatin C by ELISA. Results are expressed as the mean ± SD. a, b, c and d denote the difference annotations that imply significant differences (p<0.05). a vs b (P<0.05); a vs c (P<0.05); b vs c (P<0.05), b vs d (p<0.05), c vs d (p<0.05). Abbreviations: NC, Negative control; PC, positive control; RA, rosmarinic acid; TMS, telmisartan. |
Effect of RA on blood glucose level
In the positive control group, the RA group and the TMS group, there was a decrease in blood glucose levels that began to occur at week 3 of therapy and continued to decline until the end of the study, whereas in RA and TMS combination therapy, blood glucose levels initially decrease, but, interestingly, at week 4 the levels increase again. The decrease in blood glucose levels in the diabetes group in this study showed the possibility of the effect of a high-fat diet on the occurrence of insulin resistance, and then this insulin resistance decreases after a high-fat diet was replaced with a normal diet.
In the RA group, the decrease in blood glucose occurred gradually, and from week 5 and in the following week, blood glucose levels did not differ significantly compared to the negative control group. Whereas in the TMS group, a decrease in blood glucose was relatively faster compared to the RA group, so at week 4, blood glucose levels in the TMS group were significantly lower compared to the RA group. Then, after week 4, the blood glucose level of the TMS group compared to the RA group did not differ significantly. These results indicated an antidiabetic effect of TMS and RA with TMS giving a stronger decrease in blood glucose level compared to the RA. Interestingly, in the combination of RA and TMS group, which in the week 4 of therapy found a decrease in blood glucose as good as the TMS group, but in the following weeks, blood glucose tended to increase, which was not significantly different compared to the positive control group (Figure 1). These results indicated an antagonistic effect between RA and TMS on blood glucose levels.
Discussion
Podocyte injury is considered as the main contributor to the development and progression of DN.21 Podocyte injury causes cellular hypertrophy, effacement foot processes and podocyte detachment which can subsequently cause a decrease in the number of podocytes.22 Decreasing the number of podocytes causes the collapse of the glomerular loop, exposure to glomerular basement membrane (GBM), adhesion to Bowman’s capsule and ultimately causes glomerulosclerosis.8 Studies have shown that a decrease in the number of podocytes occurs in the early stages of DN and is caused by apoptosis or podocyte detachment.22 On this basis, maintaining podocytes so as not to apoptosis and/or detachment from the GBM below is important. These goals can be achieved by inhibiting pro-detachment (or pro-apoptosis) factors and/or strengthening pro-attachment (or anti-apoptotic) factors.23 Experimental studies established the role of oxidative stress as a central factor in the onset and progression of DN. Thus, inhibition of oxidative stress may constitute a focal point for multiple therapeutic synergies.9 Research showed that RAAS activation and oxidative stress were not isolated in the pathogenesis of DN; they cross-talk each other and together contribute to the development and progression of DN.24,25 Because of DN, structural injury develops over years before appearing in clinical and laboratory findings, and RAS blocker and antioxidant therapy must be started after diabetes identification to prevent and slowing of reaching to DN or ESRD.9
Our data showed that in the treated diabetic rats group, RA therapy at a dose of 75 mg/kg, TMS 1 mg/kg and combination of RA with TMS for 8 weeks showed urinary nephrin and podocin levels, as podocyte-specific markers were significantly lower compared to the diabetic groups that were not treated (positive control), but not significantly different compared to the negative control group (Figure 5). From these data, we conclude that RA or TMS therapy, both as monotherapy and as combination, can prevent detachment of podocytes from the GBM. Interestingly, the combination of RA and TMS is not better than monotherapy in preventing podocyte detachment. Whereas for glomerular nephrin and podocin expression, RA therapy showed significantly higher nephrin and podocin expression compared to a combination of RA with TMS. On the other hand, in the TMS treatment group, the expression of glomerular podocin and nephrin was not significantly different compared to the control group, both negative and positive control groups (Figure 7). This evidence clearly shows the role of RA therapy in increasing the expression of nephrin and podocin in STZ-induced diabetic rats.
RA has the main effect as an antioxidant and anti-inflammatory9 as well as TMS as an antihypertensive drug, also has antioxidant effects26 and anti-inflammatory.27 Based on our data, it is shown that the better preventive effect on the detachment of podocytes and increased expression of glomerular podocin and nephrin with RA therapy compared to the TMS therapy is probably due to the better anti-inflammatory effects of RA compared to TMS. We proved this by decreasing the expression of p65 NF-kB with RA therapy which was significantly different compared to TMS (Figures 9 and 10). Increased expression of the p65 NF-kB subunit can reduce nephrin expression.28 Interestingly although both have antioxidant and anti-inflammatory effects, the combination of both actually showed an antagonistic effect. The mechanism of the effect of RA therapy with TMS which seems to be the opposite is still unclear. It is possible because of the effect, at least in part, of significantly higher blood glucose at the end of the study in the combination therapy of RA with TMS group compared to monotherapy. Further research is needed to clarify this.
Aaltonen et al,29 in his research, found that nephrin was detectable in the urine of STZ-induced rats in 4 weeks, then peaked by 6 weeks. On the other hand, studies of glomerular nephrin in STZ-induced hyperglycemia were significantly reduced after week 8, while podocin did not change.30
Similar to our data, at week 8, the urinary podocin and nephrin levels were found to be the highest in the positive control group significantly (Figure 5); conversely, although the results were not significantly different, the expression of glomerular podocin and nephrin was lowest in the positive control group (Figure 7). We do not know exactly why glomerular podocin and nephrin in the positive control group did not decrease significantly compared to the negative control group. We speculate that this condition is caused by the duration of our study which is only 8 weeks. Further clarification is needed regarding these results. In contrast to the Menne et al30 results, at week 8, besides nephrin expression, podocin expression in the RA group and the combination of RA with TMS group also increased, and thus the ratio of the expression of glomerular podocin/nephrin in the RA group and the combination of RA with TMS was significantly higher compared to other groups (Figure 8). The mechanism for increasing podocin expression is still unclear, while an increase in nephrin expression can occur due to a decrease in the expression of p65 NF-kB, which has a negative feedback response to nephrin expression28 and inhibit by angiotensin II, which has been demonstrated that administration of ACE inhibitors or angiotensin II receptor blockers able to increase the nephrin production in diabetic animals.31 Activation of NF-kB in podocytes can also induce epithelial transition to the mesenchymal, thereby reducing nephrin expression.2,28 In this study, it appears that RA monotherapy is significantly better compared to TMS therapy and the combination of RA with TMS to increase nephrin expression and decrease in p65 NF-kB expression (Figures 7 and 10). While in other study, using different combination, perindropril with aminoguanidine, for 32 weeks, shows that a combination of both associated with a superior restoration in diabetes-induced nephrin depletion protein compared to either monotherapy.32 Unfortunately, in this study, we only assessed the total amount of NF-kB, not assessing the phosphorylation of the IkBα inhibitor molecule to assess NF-kB activity.
Albuminuria is an independent risk factor for the progression of DN.33 The level of albuminuria in the early stages of DN can tell us whether there is glomerular damage or not and the extent of the damage. Investigation of proteinuria or albuminuria continues to be the gold standard for diagnosis and staging of DN.34 Studies have suggested that an important mechanism in DN proteinuria may be that certain protein molecules in multiple podocyte slit diaphragms, including nephrin and podocin, are abnormally expressed and distributed.35,36 Podocyte plays an integral role in maintaining the glomerular filtration barrier and preventing protein loss into the urine.37 It is well known that albuminuria is diminished by the administration of ACE inhibitors or angiotensin II receptor blockers.32 Likewise in RA, which can inhibit the increase in albuminuria.12 The results of this study showed that RA therapy can prevent albuminuria (Figure 2), and this result is in line with the prevention of detachment of podocytes in the urine (Figure 5). There is a strong positive correlation between albuminuria with urinary nephrin and podocin (r=0.814 and r=0.832, respectively) (Table 1). On the other hand, there is a moderate negative correlation between albuminuria with expression of glomerular nephrin and podocin (r=−0.589 and r=−0.497, respectively) (Table 2). The levels of albuminuria, urinary podocin and nephrin in the RA therapy group did not differ significantly with negative control group. Interestingly, the anti-proteinuria effect on combination therapy RA with TMS was significantly weaker compared to the RA monotherapy, although it was still better compared to the positive control group. It is still unclear whether this effect is related to the blood glucose level of the combination RA with TMS group which tends to increase starting at week 5, while on the other hand in the RA group and TMS group, blood glucose levels decrease and even at the end of the study did not differ significantly with negative control group (Figure 1). Based on the results of a study from Jiang et al,12 this improvement was not due to improved glucose levels, but because of the direct renoprotective effect of RA. This is likely to be in accordance with the metabolic memory phenomenon, ie fact that prior glucose control has sustained effects that persist even after return to more usual glycemic control.38
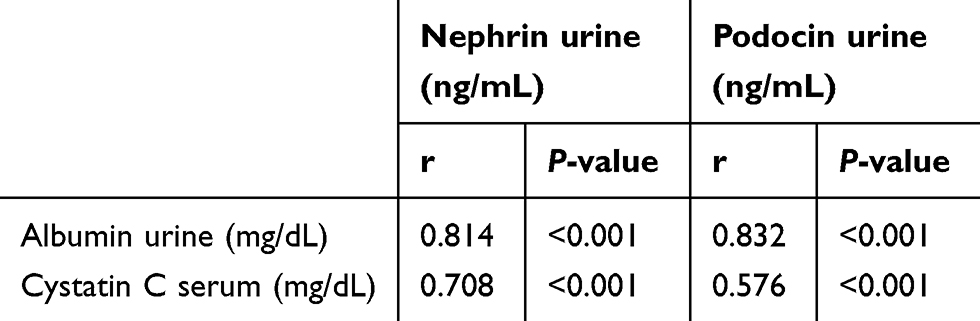 |
Table 1 Correlation of nephrin and podocin urine excretion with clinical parameters |
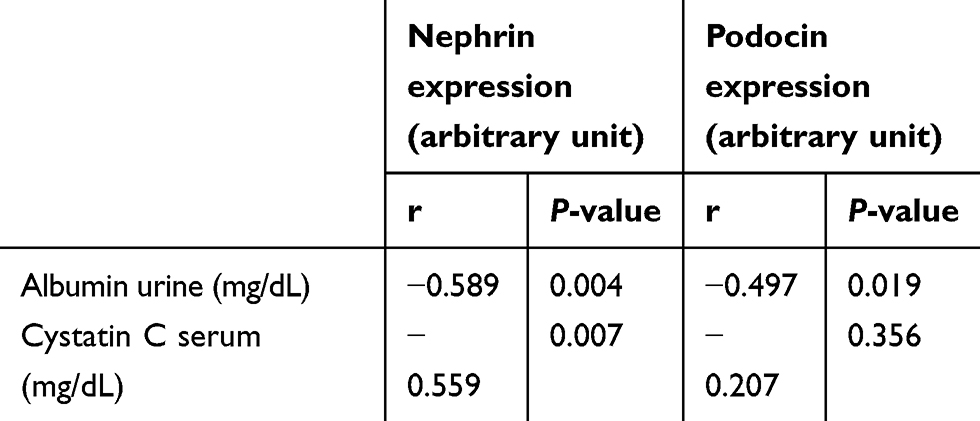 |
Table 2 Correlation of expression nephrin and podocin glomerulus with clinical parameters |
Progression is the process by which progressive glomerulosclerosis leads to ESRD. Assessment of GFR by cystatin C, urine or serum is considered a sensitive biomarker as it detects minor glomerular injury, and this method is not influenced by body mass, being comparable and even better than methods using serum creatinine.39,40 Our study shows that treatment with RA is better in preventing elevated serum cystatin C levels than TMS therapy and combination of RA with TMS (Figure 11). This result is in line with the effects of RA therapy on albuminuria (Figure 2). Other researchers showed that RA therapy with a dose of 7.5 mg/kg and 15 mg/kg for 8 weeks had a dose-dependent renoprotective effect that significantly decreased 24-hr urine albumin and level of serum cystatin C.12 Our study showed that there was a significant positive correlation between serum cystatin C level and albuminuria (r=0.789; p<0.001) (Table 1), both of which could be inhibited by RA therapy (Figures 2 and 11). This proves that RA therapy can inhibit the progression of DN in diabetic rats.
Besides having antioxidant26 and anti-inflammatory effects,27 TMS also has an antidiabetic effect.41 The antidiabetic effect of TMS because it has a structure similar to pioglitazone, a peroxisome proliferator activated receptor (PPARY) ligand that approved for the treatment of type II diabetes. Hamed and Malek41 in the STZ-induced diabetic in rats study showed that blood glucose levels and HbA1C after 8 weeks of TMS therapy were not significantly different from the nondiabetic control group and gliclazide group. Our data, using a smaller dose (1 mg/kg), showed the same results, the hypoglycemic effect of TMS occurred after 3 weeks of therapy and at the end of the study there was no significant difference with negative control group. Human studies by Honjo et al42 in Japanese patients with type 2 diabetes and hypertension significantly decreased HBA1 C after 3 months of treatment with TMS compared to candesartan (from 8.12±0.97 to 7.43±0.79%, P<0.05) vs (7.40±1.38 to7.32±1.28%). Antihipoglycemic effects of TMS are dose-dependent.42 Whereas RA ameliorates hyperglycemia by regulating the key enzymes of carbohydrate metabolism as evidenced by Jayanthy and Subramanian.43 Oral administration of RA (100 mg/kg body weight) to high fat diet fed – low doses of STZ-induced type 2 diabetic rats for 30 days established a significant (P<0.05) decline in the levels of blood glucose, glycosylated hemoglobin, blood urea, serum uric acid and creatinine along with increase in plasma insulin level.43 Our results showed a decrease in blood glucose at week 3 of RA therapy, and at the end of study, blood glucose levels were not significantly different compared to the negative control group. Interestingly, the combination of RA with TMS at week 3 was found to be decreased, but in the following weeks, blood glucose levels gradually increased, and at the end of the study, no significant differences were found compared to positive control group (Figure 1). So even though both drugs have the same effect as antihyperglycemia, the combination of it has an antagonistic effect. The seemingly opposite mechanism of the effects of combination therapy between RA and TMS on blood glucose is still unclear. Further research is needed to clarify this. Different blood glucose levels between RA and TMS as monotherapy compared to the combination of both can at least affect the results of the study, even though there is a phenomenon of glucose memory.
In conclusion, our study’s results reinforce the concept that damage to podocytes and subsequently detachment are important factors in the development and progression of ND, and oxidative stress plays an important role in the occurrence of this podocyte damage. In this study, therapy with RA which has been known as an antioxidant and anti-inflammatory has been shown to prevent the detachment of podocyte, to increase the expression of glomerular nephrin and podocin and also to prevent deterioration of kidney function. TMS has an effect similar to RA but the effect is generally weaker compared to RA. Interestingly, the combination of RA with TMS did not show a synergistic effect, even have higher urinary albumin excretion and worse kidney function compared to RA monotherapy. Further research is needed to clarify this apparently nonsynergistic effect of the two drugs.
Acknowledgment
The authors thank the University of Brawijaya Postgraduate Program for their financial support and also the Central Laboratory of Life Sciences and the Laboratory of Bioscience, Brawijaya University, Malang, for providing the laboratory facilities.
Disclosure
The authors report no conflicts of interest in this study.
References
1. Wiggins R. The spectrum of podocytopathies: a unifying view of glomerular diseases. Kidney Int. . 2007;71:1205–1214.
2. Kumar PA, Welsh GI, Raghu G, et al. Carboxymethyl lysine induces EMT in podocytes through transcription factor ZEB2: implications for podocyte depletion and proteinuria in diabetes mellitus. Arch Biochem Biophys. 2016;590:10–19. doi:10.1016/j.abb.2015.11.003
3. Shankland SJ. The podocyte’s response to injury: role in proteinuria and glumerulosclerosis. Kidney Int. 2006;69:2131–2147. doi:10.1038/sj.ki.5000410
4. D’Agati V. Podocyte injury can be catching. J Am Soc Nephrol. 2011;22:1179–1188. doi:10.1681/ASN.2011050501
5. Susztak K, Raff AC, Schiffer M, Böttinger EP. Glucose-induced reactive oxygen species cause apoptosis of podocytes and podocyte depletion at the onset of diabetic nephropathy. Diabetes. 2006;55:225–233. doi:10.2337/diabetes.55.01.06.db05-0894
6. Kriz W, Hahnel B, Hosser H, Rosener S, Waldher R. Structural analysis of how podocytes detach from the glomerular basement membrane under hypertrophic stress. Front Endocrinol. 2014;207:1–10.
7. Bhatti A, Usman M. Drug targets for oxidative podocyte injury in diabetic nephropathy. Cureus. 2015;7(12):e393. doi:10.7759/cureus.268
8. Kriz W, LeHir M. Pathways to nephron loss starting from glomerular diseases-insights from animal models. Kidney Int. 2005;67:404–419. doi:10.1111/j.1523-1755.2005.67097.x
9. Tavafi M. Diabetic nephropathy and antioxidants. J Nephropathol. 2013;2:20–27. doi:10.5812/nephropathol.9093
10. Jeanette S, Alex K, Adviye E. Oxidative stress and the use of antioxidants in diabetes. Cardiovasc Diabetol. 2005;4:5–9. doi:10.1186/1475-2840-4-5
11. Tursun A, Astumi N, Hiroyuki M, et al. A natural scavenger of peroxynitrites, protects against impairment of memory induced by Ab25–35. Behav Brain Res. 2007;180:139–145. doi:10.1016/j.bbr.2007.03.001
12. Jiang WL, Xu Y, Zhang SP, Hou J, Zhu HB. Effect of rosmarinic acid on experimental diabetic nephropathy. Basic Clin Pharmacol Toxicol. 2012;110(4):390–395. doi:10.1111/j.1742-7843.2011.00828.x
13. Wienen W, Entzeroth M, Meel JCAV, et al. A review on telmisartan: a novel, long-acting angiotensin II receptor antagonist. Cardiovasc Drug Rev. 2000;18(2):127–154. doi:10.1111/j.1527-3466.2000.tb00039.x
14. Mallat SG. What is a preferred angiotensin II receptor blocker-based combination therapy for blood pressure control in hypertensive patients with diabetic and non-diabetic renal impairment? Cardiovasc Diabetol. 2012;11:1–12. doi:10.1186/1475-2840-11-1
15. Fogo AB. Mechanisms of progression of chronic kidney disease. Pediatr Nephrol. 2007;22(12):2011–2022. doi:10.1007/s00467-007-0524-0
16. Yang HC, Ma LJ, Ma J, Fogo AB. Peroxisome proliferator-activated receptor-gamma agonist is protective in podocyte injury-associated sclerosis. Kidney Int. 2006;69:1756–1764. doi:10.1038/sj.ki.5000336
17. Matsusaka T, Xin J, Niwa S, et al. Genetic engineering of glomerular sclerosis in the mouse via control of onset and severity of podocyte-specific injury. J Am Soc Nephrol. 2005;16:1013–1023. doi:10.1681/ASN.2004080720
18. Furman BL. Streptozotocin-induced diabetic models in mice and rats. Curr Protocol Pharmacol. 2015; 70(1):
19. Azizah N, Mashitah MW, Samsu N, et al. Immunization of AGE-modified albumin inhibits diabetic nephropathy progression in diabetic mice. Diabetes Metab Syndrome Obesity. 2015;8:347–355. doi:10.2147/DMSO.S86332
20. Rangan G, Tesch GH. Quantification of renal pathology by image analysis (Methods in renal research). Nephrology. 2007;12:553–558. doi:10.1111/nep.2007.12.issue-6
21. Haley KE, Kronenberg NM, Liehm P, et al. Podocyte injury elicits loss and recovery of cellular forces. Sci Adv. 2018;4:1–8. doi:10.1126/sciadv.aap8030
22. Reddy GR, Kotlyarevska K, Ransom RF, Menon RK. The podocyte and diabetes mellitus: is the podocyte the key to the origins of diabetic nephropathy? Curr Opin Nephrol Hypertens. 2008;17(1):32–36. doi:10.1097/MNH.0b013e3282f2904d
23. Moreno JA, Sanchez-Nino MD, Sanz AB, et al. A slit in podocyte death. Curr Med Chem. 2008;15:1645–1654.
24. Yamagishi S, Fukami K, Ueda S, Okuda S. Molecular mechanisms of diabetic nephropathy and its therapeutic intervention. Curr Drug Targets. 2007;8:952–959.
25. Yamagishi S, Matsui T. Advanced glycation end products, oxidative stress and diabetic nephropathy. Oxid Med Cell Longev. 2010;3:101–108. doi:10.4161/oxim.3.2.11148
26. Stephen C, Benson, Harrihar A. Identification of telmisartan as a unique angiotensin II receptor antagonist with selective PPARy-modulating activity. Hypertension. 2004;43:993. doi:10.1161/01.HYP.0000123072.34629.57
27. Benson SC, Pershadsingh HA, Ho CI, et al. Identification of telmisartan as a unique angiotensin II receptor antagonist with selective PPAR modulating activity. Hypertension. 2004;43:993–1002. doi:10.1161/01.HYP.0000123072.34629.57
28. Hussain S, Romio L, Saleem M, et al. Nephrin deficiency activates NF-κB and promotes glomerular injury. J Am Soc Nephrol. 2009;20(8):1733–1743. doi:10.1681/ASN.2008121233
29. Aaltonen P, Luimula P, Astrom E, et al. Changes in the expression of nephrin gene and protein in experimental diabetic nephropathy. Lab Invest. 2001;81:1185–1190. doi:10.1038/labinvest.3780332
30. Menne J, Meier M, Park JK, et al. Nephrin loss in experimental diabetic nephropathy is prevented by deletion of protein kinase C alpha signaling in-vivo. Kidney Int. 2006;70:1456–1462. doi:10.1038/sj.ki.5001830
31. Cooper ME, Allen TJ, Macmillan PA, Clarke BE, Jerums G, Doyle AE. Enalapril retards glomerular basement membrane thickening and albuminuria in the diabetic rat. Diabetologia. 1989;32:326–328. doi:10.1007/BF00265552
32. Davis BJ, Forbes JM, Thomas MC, et al. Superior renoprotective effects of combination therapy with ACE and AGE inhibition in the diabetic spontaneously hypertensive rat. Diabetologia. 2004;47:89–97. doi:10.1007/s00125-003-1256-8
33. Peng T, Hu Z, Wu L, Li D, Yang X. Correlation between endothelial dysfunction and left ventricular remodeling in patients with chronic kidney disease. Kidney Blood Press Res. 2014;39:420–426. doi:10.1159/000368455
34. Cohen-Bucay A, Viswanathan G. Urinary markers of glomerular injury in diabetic nephropathy. Int J Nephrol. 2012;1–11. doi:10.1155/2012/146987
35. Yang X, Wang X, Nie F, et al. miR-135 family members mediate podocyte injury through the activation of Wnt/β-catenin signaling. Int J Mol Med. 2015;36:669–677. doi:10.3892/ijmm.2015.2259
36. Wu Y, Dong J, Yuan L, et al. Nephrin and podocin loss is prevented by mycophenolate mofetil in early experimental diabetic nephropathy. Cytokine. 2008;44(1):85–91. doi:10.1016/j.cyto.2008.06.015
37. Dai HY, Zhang YD, Fang L, Fan YP. Podocyte injury in diabetic nephropathy. J Nephrol Res. 2017;3(1):122–129. doi:10.17554/j.issn.2410-0579.2017.03.25
38. Berezin A. Diabetes & metabolic syndrome. Clin Res Rev. 2016;10(2):S176–S183.
39. Comper WD, Osicka TM, Jerums G. High prevalence of immuno-unreactive intact albumin in urine of diabetic patients. AJKD. 2003;41(1):336–342. doi:10.1053/ajkd.2003.50041
40. Rao X, Wan M, Qiu Q, Jiang C. Role of cystatin C in renal damage and the optimum cut-off point of renal damage among patients with type 2 diabetes mellitus. Exp Ther Med. 2014;8(3):887–892. doi:10.3892/etm.2014.1815
41. Hamed AA, Malek HA. Effect of Telmisartan in experimentally induced diabetetes mellitus in rats. Int J Health Sci (Qassim). 2007;1(2):249–256.
42. Honjo S, Nichi Y, Wada Y, Hamamoto Y, Koshiyama H. Possible beneficial effect of Telmisartan on glycemic control in diabetic subjects. Diabetes Care. 2005;28:2. doi:10.2337/diacare.28.2.498
43. Jayanthy G, Subramanian S. Rosmarinic acid, a polyphenol, ameliorates hyperglycemia by regulating the key enzymes of carbohydrate metabolism in high fat diet – STZ induced experimental diabetes mellitus. Biomed Preventive Nutr. 2014;431–437. doi:10.1016/j.bionut.2014.03.006
 © 2019 The Author(s). This work is published and licensed by Dove Medical Press Limited. The full terms of this license are available at https://www.dovepress.com/terms.php and incorporate the Creative Commons Attribution - Non Commercial (unported, v3.0) License.
By accessing the work you hereby accept the Terms. Non-commercial uses of the work are permitted without any further permission from Dove Medical Press Limited, provided the work is properly attributed. For permission for commercial use of this work, please see paragraphs 4.2 and 5 of our Terms.
© 2019 The Author(s). This work is published and licensed by Dove Medical Press Limited. The full terms of this license are available at https://www.dovepress.com/terms.php and incorporate the Creative Commons Attribution - Non Commercial (unported, v3.0) License.
By accessing the work you hereby accept the Terms. Non-commercial uses of the work are permitted without any further permission from Dove Medical Press Limited, provided the work is properly attributed. For permission for commercial use of this work, please see paragraphs 4.2 and 5 of our Terms.