")
Back to Journals » Diabetes, Metabolic Syndrome and Obesity » Volume 13
Role of TNF-α and FGF-2 in the Fracture Healing Disorder of Type 2 Diabetes Model Induced by High Fat Diet Followed by Streptozotocin
Authors Huang H, Luo L, Liu Z, Li Y, Tong Z, Liu Z
Received 19 September 2019
Accepted for publication 2 May 2020
Published 30 June 2020 Volume 2020:13 Pages 2279—2288
DOI https://doi.org/10.2147/DMSO.S231735
Checked for plagiarism Yes
Review by Single anonymous peer review
Peer reviewer comments 2
Editor who approved publication: Dr Konstantinos Tziomalos
Heqing Huang, Ling Luo, Zhitao Liu, Yan Li, Zhaochen Tong, Zhendong Liu
Department of Orthopaedics and Traumatology, Third Xiangya Hospital of Central South University, Changsha 410013, Hunan Province, People’s Republic of China
Correspondence: Zhendong Liu
Department of Orthopaedics and Traumatology, Third Xiangya Hospital of Central South University, No. 138 Tongzipo Road, Changsha 410013, Hunan Province, People’s Republic of China
Tel/Fax +8673188638888
Email [email protected]
Purpose: To investigate the effect of TNF-α and FGF-2 in the fracture healing disorder of type 2 diabetes.
Design/Methodology/Approach: Rat diabetes-bone traction model was established to investigate the effect of type 2 diabetes on the fracture healing and the association of TNF-α and FGF-2 with the process. Serological examination was performed to detect the related diabetes indexes. The proliferation activity of the cells was detected by MTT assay. The expressions of FGF-2 and TNF-α of osteoblasts in high glucose culture environment were detected by histochemistry and Western blotting.
Findings: Serological examination showed that in rats fed with high fat and sugar diet for 8 weeks, the serum total cholesterol (TC), triglyceride (TG), fasting insulin (FINs) significantly increased, but fasting blood glucose (FBG) had no significant change. Two weeks after intraperitoneal injection of STZ, rat serum TG, TC, and FBG increased significantly, while FINs did not change obviously. Two weeks after traction osteogenesis, X-ray examination and HE staining showed that the area of osteotylus in the diabetes group was significantly smaller than that in the control group. The number of PCNA positive cells in the osteotylus of diabetes group was significantly decreased. In the osteotylus of diabetes group, the expression of TNF-α was significantly increased and the expression of FGF-2 was significantly decreased. MTT assay showed that the proliferation activity of MC3T3-E1 cells in high glucose culture medium groups was significantly decreased at 24th hour of the culture, compared with the normal culture medium group. qPCR results showed that the expression of FGF-2 was significantly decreased while the expression of TNF-α was significantly increased in high glucose culture medium groups.
Originality/Value: It was concluded that type 2 diabetes mellitus affected the fracture healing by causing osteoblast proliferation disorder. TNF-α and FGF-2 were important related factors for the process.
Keywords: type 2 diabetes mellitus, T2DM rat model, distraction osteogenesis, fracture healing, FGF-2, TNF-α, MC3T3-E1 cells
Introduction
Along with the change in people’s eating and living habits, and coupled with the joint action of environmental and genetic factors, the incidence of diabetes increases rapidly. According to the statistics from the International Diabetes Federation (International Diabetes Federation, IDF) in 2014, there are about 387 million diabetics worldwide, and more than 4.9 million people die from the disease every year. It is worth noting that the number of people affected by the disease is still rising, with diabetes expected to reach 592 million in the year of 2035, especially among young people.1 In diabetic cases, type 2 diabetes usually accounts for 85% of the cases, and its lesions often involve all kinds of tissues and organs of the whole body, resulting in a variety of complications. Therefore, type 2 diabetes mellitus has become a huge burden on human life and health.
In order to study the occurrence and development of type 2 diabetes mellitus and the pathogenesis of its complications, it is necessary to establish an ideal animal model. At present, induced or experimental diabetic animal models, spontaneous animal models (OB mice, ZDF rats, etc.), and transgenic animal models (GK/IRS-1 double gene knockout mouse, etc.) are the three most widely used type 2 diabetic animal models. The experimental diabetic animal model refers to the damage of βislet cells by chemical or physical means, so as to establish a model similar to the pathological changes of human type 2 diabetes mellitus. Partial pancreatic resection, chemical drugs (alloxan, STZ) induction, high fat & glucose feeding are common methods for the establishment of this animal model.2
Studies have shown that diabetes has become the independent risk factor for fracture healing disorder and the increased risk of complications related to fracture healing disorder.3 However, there are few studies on its specific mechanism, and the opinions about it are different. To study the effect of type 2 diabetes mellitus on fracture healing and its related mechanism, it is very important to select/establish a scientific, reasonable, and intuitionistic animal model of fracture healing. At present, there are around many animal models of fracture healing. Traction osteogenesis was first used to elongate the long bone of extremities in orthopedic surgery. At the same time, it was also regarded as an effective fracture healing model, which could directly observe the process of bone tissue regeneration and repair, and evaluate the growth of osteotylus.
On the basis of establishing experimental diabetic animal model, this study aims to further establish distraction osteogenesis model and study the effect and mechanism of diabetes on fracture healing, especially the role of related cytokines. All animal experiments were performed in accordance with the National Institutes of Health Guide for the Care and use of Laboratory Animals (NIH Publications No. 8023, revised 1978). In addition, this study has been approved by the Medical Ethics Committee of Xiangya Third Hospital of Central South University. All efforts were made to minimize the suffering of animals.
Materials and Methods
The Reagents and Cell
Streptozotocin (STZ) and EDTA were the products of Sigma. The total cholesterol detection kit and TG detection kit were the products of British Smith & Nephew Co. Ltd. The insulin radioimmunity kit was the product of Furui Biology Co. (Beijing, China). The mouse anti-proliferating cell nuclear antigen antibody was the product of Bio-genex Company of the United States. The monoclonal anti FGF-2 (Cat# GTX84502) and TNF-α (Cat# GTX52438) antibodies were provided by GeneTex (Beijing, China). HRP goat anti-mouse IgG was provided by Kangwei Century Co. (Beijing, China). Trizol, DMEM medium (low sugar), trypsin, and antibiotics were the products of Invitrogen. Fetal bovine serum was provided by Hangzhou Sijiqing Company. Superscript reverse transcription kit was from Thermo. SYBR ®Green Realtime PCR Master Mix was the product of Bio-TEK. Mouse osteoblast cell lineMC3T3-E1 was provided by Changsha Yingrun Biotechnology Co., Ltd.
Establishment of T2DM Model
According to the relevant literature,4 the model of T2DM rats was established by high glucose and high fat diet combined with one-off low dose STZ injection. The specific methods were as follows: 28 SPF male SD rats (8-week-old, bodyweight 170–220 g) were randomly divided into two groups. The experimental group (n = 14) was fed with high fat & sugar diet, and the normal control group (n = 14) was fed with common diet. After being fed for 8 weeks, the rats were fasted overnight and anesthetized under 10% chloral hydrate (300mg/kg). The blood samples were taken by tail cutting method, and total cholesterol (TC), triglyceride (TG), fasting insulin (FINs), and fasting blood glucose (FBG) in the samples were measured. Subsequently, the rats in the experimental group were injected intraperitoneally with STZ (30mg/kg), and the rats in the control group were injected with the same volume of 0.1mol/L citrate buffer. The rats in the two groups were fed by diet as before for two more weeks. Again, the rats were fasted overnight and anesthetized under 10% chloral hydrate (300mg/kg). The blood samples were collected as above, and TG, TC, FINs, and FBG of the samples were measured. The rat with FBG ≥ 16.7mmol/L was considered meeting the conditions of T2DM model and was used to continue the follow-up experiment.
The Establishment of Tibia Distraction Osteogenesis (DO) Model and the Related Treatment
The model was constructed as described in the reference.5 Briefly, the rats were anesthetized with intraperitoneal injection of 10% chloral hydrate (300mg/kg). The hair of the left calf of the rats was shaved and the skin was fully sterilized. The rats were fixed on the operating table. Kirschner steel needles with 1.0mm diameter were pierced at the far and near end of the left tibia and fixed on the extended external fixation frame. A long transverse incision about 0.5cm was made in the lateral tibia muscle. The muscle tissue was separated and the middle and upper parts of tibia were fully exposed. Several vertical holes were drilled with the diameter 0.8mm disinfection Kirschner needle in the middle of the exposed tibia segment until it was completely broken. At the same time, the left peroneal bone was broken with scissors, and after the external fixation was prolonged smoothly, the external fixation frame was shortened and the fracture end was reduced. The wound was sutured and gentamicin sulfate (3mg/kg) was intramuscularly injected. A plastic dressing was put on the lateral side of the left lower extremity to prevent rat bites and contact contamination. Starting on the first day after operation, the external fixation frame was extended twice a day (once in the morning and once in the afternoon), 0.15mm each time. After 14 days of continuous prolongation, the rats were fasted overnight and then anesthetized with 10% chloral hydrate. The left tibia specimens were taken out under the sterile condition and the blood samples were gotten same as above. The left tibia specimens were examined by X-ray (irradiation condition was 40kV, 4mas), and then were fixed in 10% formaldehyde.
Serological Examination
The contents of TC, TG, FINs, and FBG in blood samples taken at 8th,10th, and 12th weeks were detected according to the instruction of the detection kit.
Histological Detection
The tibia specimens fixed with formaldehyde were decalcified with formic acid for one week, embedded in paraffin after modification, cut into slices. The slices were stained with hematoxylin and eosin. The bone tissue formation at the front of initial matrix (PMF) and micro bone-column (MCF) in two groups were observed and compared under an optical microscope. Image J 1.30 software was used to quantitatively analyze the osteogenesis of cartilage and the intramembranous osteogenesis in the traction space of tibia.
Immunohistochemical Detection
The paraffin sections were taken for routine operation of immunohistochemical detection. The sections were incubated with monoclonal anti FGF2 or TNF-α antibodies at 37°C for 30 minutes, followed by incubation overnight at 4°C. The goat anti-mouse IgG second antibody labeled with HRP was incubated at 37°C for 20 minutes. After being washed with PBS for 3 times, the sections were incubated with DAB and then stained with hematoxylin. Finally, the sections were sealed, observed, and photographed under an optical microscope.
Cell Culture and MTT Assay
The culture of MC3T3-E1 cells was maintained at 5% CO2, 37°C with saturated humidity. The control group was cultured with low glucose DMEM medium (containing 5.5mM Glucose) supplemented with 10% fetal bovine serum. The experimental groups were cultured with DMEM supplemented with glucose (final concentrations of 50 mM, 100 mM, and 200 mM, respectively). The detections with MTT kit were performed at 4, 48, and 72 h, respectively, following the manufacturer’s instruction.
qPCR Detection
Real-time fluorescence quantitative PCR (qPCR) was performed to detect mRNA level. mRNAs were extracted by TRIZOL and reverse transcription (synthesis of the first strand of cDNA) was carried out according to the instruction of Superscript reverse transcription kit. qPCR reaction system included IQTM SYBR Green super-mix 10 μL, 0.5μL of 10 μM upstream and downstream primers, respectively, 1 μL cDNA, ddH2O supplement to 20 μL. PCR amplification conditions: 95°C pre-denaturation 2 min; the cycle parameters were 95°C 15 s, 61°C annealing for 30 s, 72°C 30 s, 35 cycles, and finally 95°C 10 min. The primers used are:
musFGF-2-153-F: GGCTGCTGGCTTCTAAGTGT,
musFGF-2–153-R GTCCCGTTTTGGATCCGAGT;
musTNFa-251-F: GAGTGACAAGCCTGTAGCC,
musTNFa-251-R: GGTTGACTTTCTCCTGGTAT;
musGAPDH-128-R: CCGTGTTCCTACCCCCAATG,
musGAPDH-128-F: AGCCCAAGATGCCCTTCAGT.
Statistical Treatment
10. The data of each group were expressed by mean ± standard deviation (MEAN± SEM), and t-test was used to compare the data between the two groups. The statistical analysis was carried out by using imagej2.1 software quantitative analysis and statistical software SPSS20, and P< 0.05 indicated that there was significant difference between them.
Results
Changes of Blood Biochemical Indexes in Rats Fed with High Sugar Diet for 8weeks
The TC (P < 0.001), TG (P < 0.05), and FINs(P < 0.05) in the experimental group were significantly higher than those in the control group. There was no significant difference of FBG between the experimental group and the control group (P > 0.05) (Table 1).
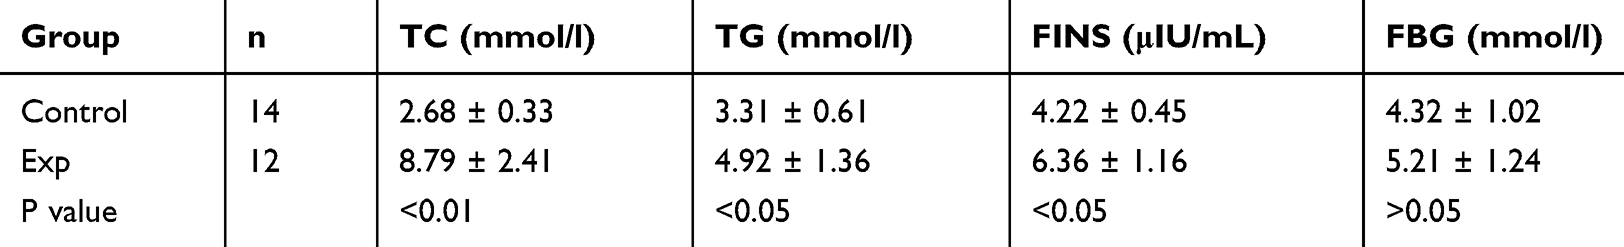 |
Table 1 Levels of Rat Serum TC, TG, FINs, and FBG 8 Weeks After Feeding |
Changes of Blood Biochemical Indexes in Rats After Intra-Peritoneal Injection of STZ
After intraperitoneal injection of STZ (40mg/kg) for 2 weeks, the rat serum TC (P < 0.01), FBG (P < 0.01), and TG (P < 0.05) in the experimental group were significantly higher than those in the control group (P < 0.05). There was no significant difference of FINs between the two groups (P > 0.05) (Table 2).
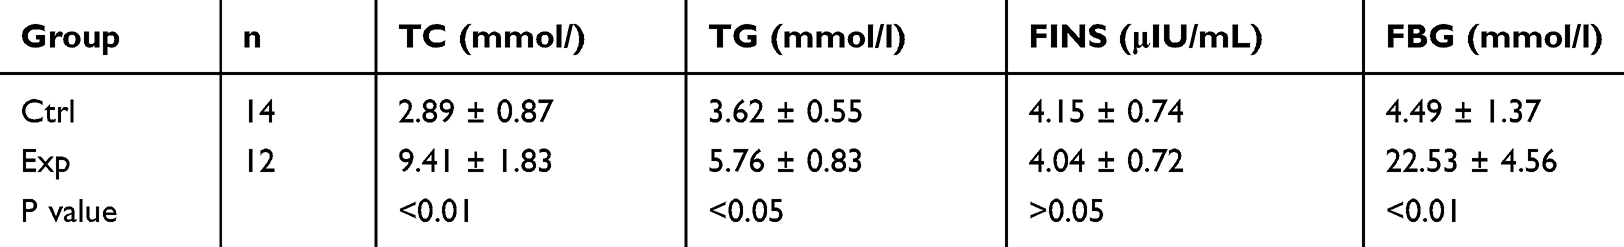 |
Table 2 Levels of Rat Serum TC, TG, FINs, and FBG 2 Weeks After Injection |
Changes of Blood Biochemical Indexes in Rats with Left Tibia Traction for Two Weeks
After two weeks of left tibia traction, TC (P < 0.05), TG (P < 0.05), and FBG (P < 0.05) in the experimental group were significantly higher than those in the control group, and there was no significant difference of FINs between the two groups (P > 0.05)( Table 3).
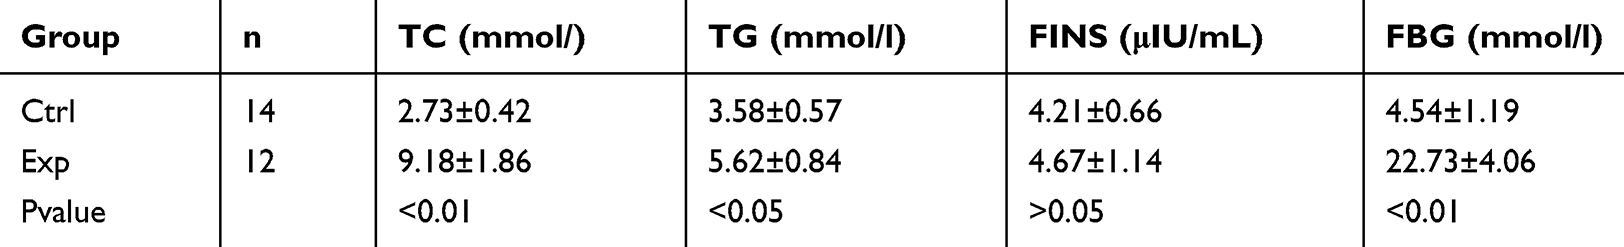 |
Table 3 Levels of Rat Serum TC, TG, FINs, and FBG 2 Weeks After Traction |
By comparing the blood biochemical indexes (TC, TG, FINs, FBG) of three different periods (8 weeks after feeding with high fat & sugar diet, 2 weeks after STZ injection and 2 weeks after bone traction), it could be seen that the fracture healing process in this model was carried out under typical pathological conditions of type 2 diabetes mellitus.
The above results confirmed that an animal model consistent with the pathogenesis, pathological and clinical features of type 2 diabetes mellitus was successfully established.6 On this basis, the left tibia traction model can be further constructed to observe the abnormal bone metabolism in type 2 diabetes mellitus. This provided a technical guarantee for the study of the mechanism of fracture healing disorder caused by type 2 diabetes mellitus at the animal experimental level.
Comparison of the Growth of Traction Osteotylus Shown by X-Ray Examination
Two weeks after left tibia traction, X-ray examination was performed. The X-ray images were transformed into 8-bit images, and the gray values were obtained by imagej2.1 software. The osteotylus area and osteotylus density in the DO extended space of the tibia were quantitatively counted. The results showed that both the experimental group and the control group had osteotylus formation, but the area of osteotylus in the experimental group was significantly decreased (P < 0.05), and the average gray value was significantly lower (P< 0.05) than that of control group (Figure 1A).
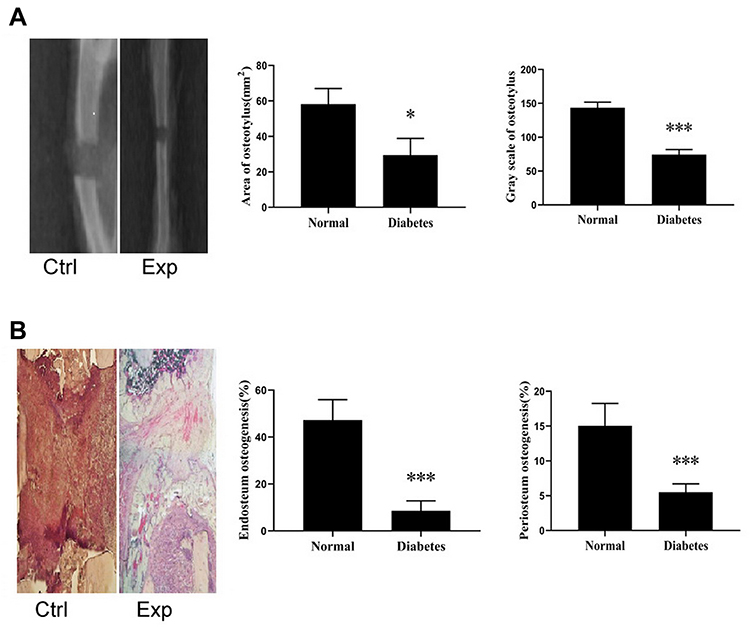 |
Figure 1 X-ray examination and HE staining of osteotylus. (A) X-ray examination of left tibia. Representative X-ray images from control/normal and experimental/diabetes group were shown. The osteotylus areas and the gray value of the areas in the control/normal group and the experimental/diabetes group were compared. *P<0.05, compared with control/normal group; ***P<0.01, compared with control/normal group. (B) Compare the endosteum osteogenesis of the experimental group and the control group (%). Periosteum osteogenesis (%) difference, endosteum osteogenesis (%). The experimental group was significantly different from the control group (***P <0.001). Periosteum osteogenesis (%). There was significant difference between the experimental group and the control group (***P < 0.001). Abbreviations: Ctrl, control/normal; Exp, experimental/diabetes. |
Comparison of Histologic Staining of Traction Osteogenesis Between Two Groups
The result of HE staining showed that compared with the control group, the arrangement of micro-bone-columns (MCF) in the experimental group was disordered, and some of them even had no obvious MCF. Most of the front of the initial matrix (PMF) areas were obviously under-stained. The osteogenesis in the DO-prolonged osteotylus was significantly decreased, which indicated that the formation of the osteotylus in the experimental group was significantly lower than that in the control group. Some of the animals had osteotylus formation obstruction and the ability of osteotylus growth and differentiation decreased significantly. Histologic quantitative analysis showed that periosteal osteogenesis and intraosseous osteogenesis in the experimental group were significantly decreased (P < 0.001; Figure 1B).
Comparison of the Number of Proliferative Cells in the Traction Osteoblasts Between Two Groups
The results of immunohistochemical detection showed that the number of PCNA positive cells in the experimental group was significantly lower than that in the control group. The cell count statistics showed that the percentage of PCNA positive cells (PCNA positive cells (%) = number of PCNA positive cells/number of total cells) in the FIZ and PMF of traction osteotylus in the experimental group was significantly lower than that in the control group (P < 0.05; Table 4).
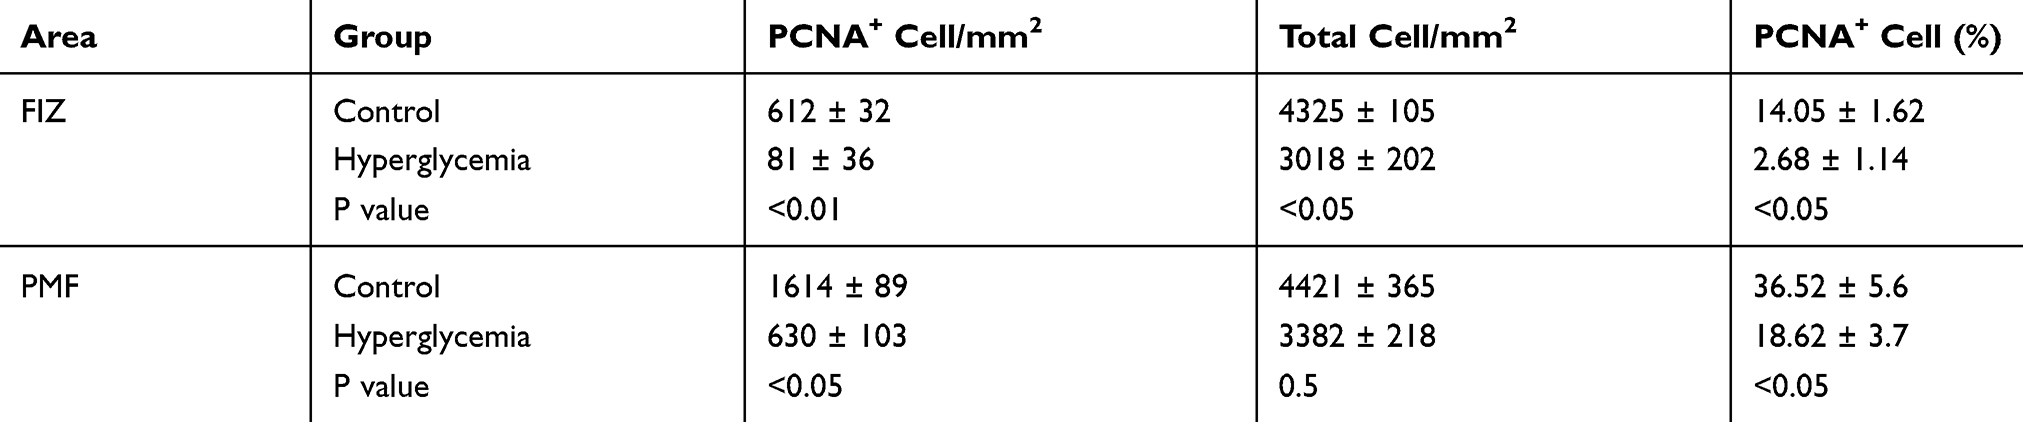 |
Table 4 The Comparison of PCNA Positive Cells Between Control and Hyperglycemia Groups |
TNF-α Expression
The immunohistochemical results showed that after 2 weeks of traction, the expression of TNF- α was positive in osteogenic cell sand osteoblasts in the PMF area of osteotylus in the experimental group, and TNF- α was also positive in some cartilage cells in this experimental group. The expression of TNF- α in the control group was significantly lower than that in the experimental group (Figure 2A). In the MCF region of osteotylus of the experimental group, the osteoblasts and cartilage cells were TNF- α positive, while the osteocytes were TNF- α negative. The expression of TNF- α in the control group was significantly decreased (Figure 2B). The above results showed that the expression of TNF- α in the osteotylus tissue of the experimental group was significantly higher than that of the control group. The expression of TNF-α in immature cells in the stage of proliferation and differentiation was more active, while the expression of TNF- α in mature osteoblasts was negative. This indicated that the expression of TNF-α was active in the fracture osteotylus of rats under the pathological condition of type 2 diabetes mellitus.
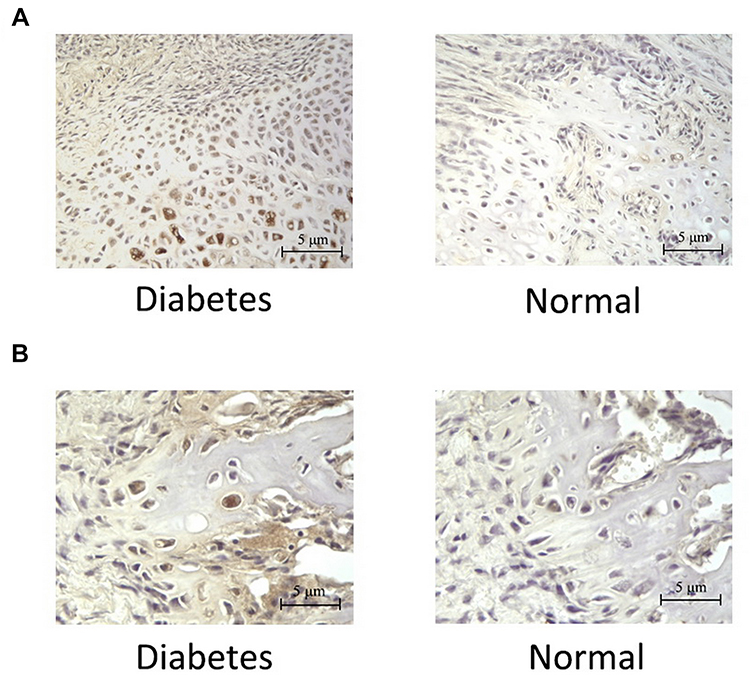 |
Figure 2 Expression of TNF-α in osteotylus. (A) Immunohistochemical results showing the expression of TNF-α in PMF area of osteotylus. The representative pictures of the cells containing TNF-α were shown. (B) Immunohistochemical results showing the expression of TNF-α in MCF area of osteotylus. The representative pictures of the cells containing TNF-α were shown. The brown color in both (A) and (B) indicated the level of TNF-α, the deeper brown color of the cell, the higher level of TNF-α in the cell. |
FGF-2 Expression
The immunohistochemical results showed that after 2 weeks of traction, in the control group, FGF-2expression was positive in osteogenic cells, osteoblasts, and some cartilage cells in the PMF region of the osteotylus. In the experimental group, the FGF-2 expression in the osteotylus was significantly lower than that in the control group (Figure 3A). In MCF area of osteotylus in the control group, the expression of FGF-2 in osteoblasts and cartilage cells was positive but negative in mature bone cells. The expression of FGF-2 in osteotylus of the experimental group was significantly lower than that in the control group (Figure 3B).
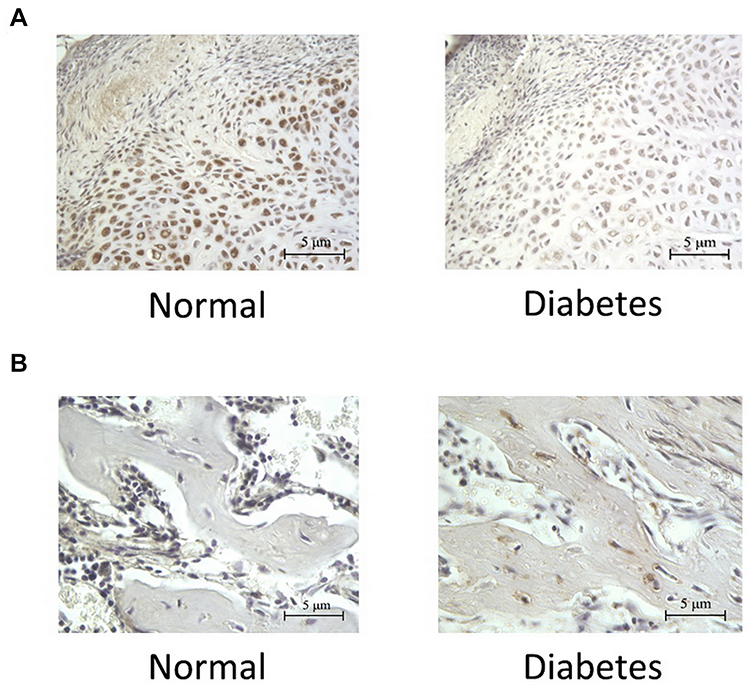 |
Figure 3 Expression of FGF-2 in osteotylus. (A) Immunohistochemical results showing the expression of FGF-2 in PMF area of osteotylus. The representative pictures of the cells containing FGF-2 were shown. (B) Immunohistochemical results showing the expression of FGF-2 in MCF area of osteotylus. The representative pictures of the cells containing TNF-α were shown. The brown color in both (A) and (B) Indicated the level of FGF-2, the deeper brown color of the cell, the higher level of FGF-2 in the cell. |
Effect of Hyperglycemia on Proliferation Activity of Osteoblasts
MC3T3E1 cells were cultured in groups with different concentrations of glucose (50mM, 100mM, and 200mM) to determine whether different concentrations of glucose inhibited osteoblastic proliferation. The results showed that, at 24h, the cell proliferation activities in 50 mM and 100 mM groups had no significant difference compared with normal/control group, while the cell proliferation activity in 200 mM group was significantly lower than that in normal/control group (P < 0.05). With the prolonged culture time (48h and 72h), the proliferation activities in three high glucose groups decreased significantly (P < 0.05; Figure 4A).
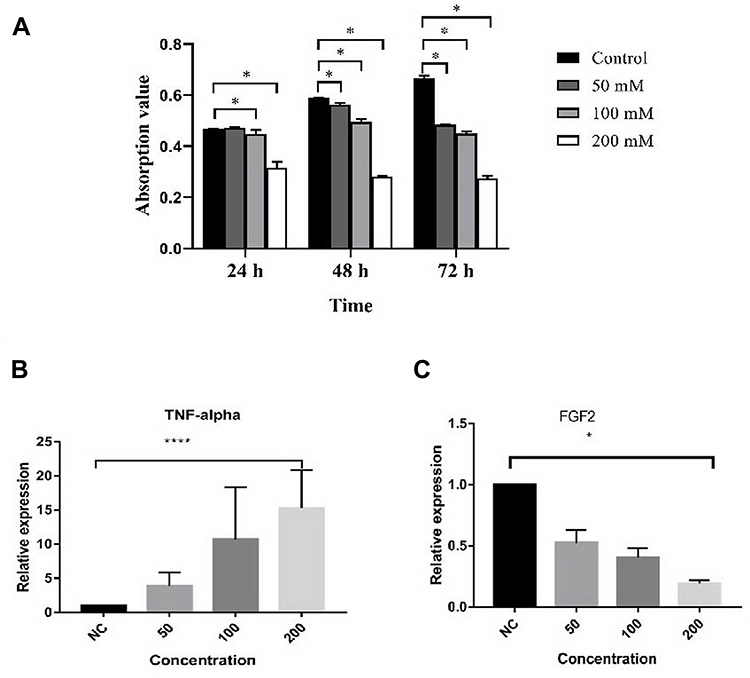 |
Figure 4 Effects of high glucose on proliferation and expression of TNF-α and FGF-2 in MC3T3-E1 cells. (A) MTT detection of the proliferation of MC3T3-E1 cells cultured in normal DMEM or DMEM supplemented with different concentration glucose. (*P<0.05 compared with normal/control group). (B) The expression of TNF-α in MC3T3-E1 cells cultured in normal DMEM or DMEM supplemented with different concentration glucose (****P<0.05, compared with normal/control group). (C) The expression of FGF2 in MC3T3-E1 cells cultured in normal DMEM or DMEM supplemented with different concentration glucose (*P<0.05, compared with normal/control group). Abbreviation: NC, normal/control. |
The Effect of Hyperglycemia on the Expression of TNF- α and FGF-2 in MC3T3-E1 Cells
The results of qPCR showed that after 5 days of culture, the expression of TNF- α in MC3T3-E1 cells of three high glucose concentration groups was significantly higher than that of the normal control group, and the higher the glucose concentration, the higher the expression level of TNF-α. (Figure 4B). The results of qPCR also showed that after 5 days of culture, the expression of FGF-2 in MC3T3-E1 cells of three high glucose concentration groups was significantly lower than that of the normal control group, and the higher the glucose concentration, the lower the expression level of FGF-2 (Figure 4C).
Discussion
In this study, the results of imaging and histology of traction osteotylus showed that the formation of osteotylus in the diabetes group was significantly lower than that in the control group, and the results of immunohistochemistry showed that the number of cells in the proliferating phase in the traction-prolonged osteotylus of the diabetes group was significantly decreased, indicating that type 2 diabetes mellitus led to the proliferation disorder of osteogenic cells and osteoblasts. The results of cell experiment showed that high glucose (100mM and 200 mM) culture for 24 h, 48 h, and 72 h resulted in the decrease of cell proliferation activity, indicating that hyperglycemia could lead to the decrease of cell proliferation, which was basically consistent with the previous researches.7,8 This further confirmed that the inhibition of osteoblast proliferation in high glucose environment was an important cause of bone tissue healing disorder in diabetes rats and supports the conclusion that type 2 diabetes mellitus led to fracture healing disorder by affecting the proliferation of osteoblasts.
TNF- α is an important cytokine regulating inflammatory and immune response, which plays an important role in injury, infection, angiogenesis, apoptosis, and some physiological processes.9 In recent years, it is generally believed that TNF- α is a factor related to diabetic insulin resistance (IR), which can reduce the phosphorylation of insulin receptor on the surface of a variety of cells, inhibit the phosphorylation of insulin receptor substrate (IRS-1), interfere with insulin signal transduction, and then lead to insulin resistance.10,11 At the same time, many clinical studies have reported that the level of TNF- α in the serum of diabetic patients is significantly higher than that of normal subjects,12 and it is also confirmed that TNF- α is closely related to diabetes. In this paper, the results of immunohistochemistry and qPCR showed that the expression of TNF- α in traction osteotylus of the diabetes group was significantly higher than that of the control group, which was consistent with the above related literature.
TNF-α also has a close relation to the bone metabolism. On one hand, TNF-α can induce pre-osteoclasts to differentiate into osteoclasts.13 The effect of TNF-α on osteoclasts is not only to promote the proliferation and differentiation of the cells but also to enhance the activity of osteoclasts and promote their bone resorption.14 On the other hand, TNF-α could inhibit osteoblast formation and osteogenic differentiation of bone marrow stromal cells.15 Furthermore, research data from Ablowi et al indicated that diabetes-enhanced TNF-α increases the expression of resorptive factors in chondrocytes through a process that involves activation of FOXO1 and that TNF-α dysregulation leads to enhanced osteoclast formation and accelerated loss of cartilage.16 Dana Graves et al reported that TNF-α contributes to diabetes impaired angiogenesis in fracture healing through FOXO1mediated inflammation.17 In this study, the results of qPCR and immunohistochemistry showed that the expression of TNF-α was negatively correlated with the formation of osteotylus: the increased number of osteoblasts in the area with expression of TNF-α, the disorder of tissue arrangement, the decrease of bone collagen, the incomplete bone calcification, and the disorder of osteotylus tissue formation. These manifestations are the result of the TNF-α mediated inhibition of osteoblast formation and activation of osteoclasts. At the same time, the results of cell experiment showed that the expression of TNF-α in high glucose concentration group was significantly increased in a concentration-dependent manner, suggesting that high glucose state could induce the expression of TNF-α in osteoblasts and enhance its inhibitory effect on osteogenesis. In a word, on the one hand, TNF-α could induce the proliferation and differentiation of osteoclasts, enhance the activity of osteoclasts, and promote bone resorption; on the other hand, TNF-α can inhibit the proliferation and differentiation of osteoblasts and hinder the formation of bone tissue. Therefore, it is reasonable to believe that TNF-α is one of the important factors in fracture healing disorder in diabetes mellitus.
FGFs/FGFRs signal system plays a key role in bone development and bone disease, which may be involved in the process of bone tissue regeneration and repair by promoting osteoblast formation and inhibiting osteoclast proliferation and differentiation.18 BFGF-2 is an important member of this system. A large number of studies have confirmed that bFGF-2 plays a key role in the regulation of bone tissue regeneration and repair. For example, it has been found that in the early stage of fracture healing in type 1 diabetic rats, the proliferation rate of cells in osteotylus decreased and the expression of FGF-2 in osteotylus decreased significantly. However, after local injection of rhFGF-2, the formation of osteotylus increased and fracture healing accelerated.19 When Facchiano et al studied the changes of FGF-2 in diabetic mice, they found that high glucose metabolism seriously affected the structure of FGF-2 and produced a large number of endogenous glycosylated FGF-2. This molecular change of FGF-2 led to the decrease of its binding with heparin sulfate glycoprotein, which affected the binding of FGF-2 to its receptor, and finally caused the signal disorder of FGF-2 mediated transduction and the decrease of biological activity of FGF-2.20 In this study, results of histochemistry, immunohistochemistry, and qPCR showed that the micro-bone columns in the traction osteotylus of the diabetes group were disordered; the matrix calcification was poor and the osteoblast formation was significantly decreased; the expression of FGF-2 in the traction osteotylus of the diabetes group was significantly lower than that of the control group; and the expression of FGF-2 was also decreased obviously in cells cultured in high sugar environment. These indicated that the disorder of fracture healing caused by diabetes mellitus was closely related to the decrease of FGF-2 expression, suggesting that FGF-2 might be another important factor in the occurrence of fracture healing disorder in diabetic rats.
Since in this study it was confirmed that TNF-α had inhibiting effect while FGF-2 had promoting effect on the fracture healing associated with type 2 diabetes, it is possible to apply the interferences with these cytokines in future experiments to elucidate their therapeutic effect on the disorder. For example, recombinant FGF-2 can be applied to the model to elucidate if it can promote the fracture healing or not. On the other hand, the inhibitor and the blocker of TNF-α can also be used in the model to make clear that they can help the healing or not.
In summary, in this paper, studies with rat type 2 diabetes-bone traction model reveal that both TNF-α and FGF-2 are closely related with the fracture healing disorder caused by type 2 diabetes mellitus, and this association is further confirmed in the osteoblasts cultured in high glucose environment. The results suggest that TNF-α is a potential promoter and FGF-2 is a potential preventer for type 2 diabetes-mediated fracture healing disorder, providing new thinking for the prevention and treatment of this complication.
Disclosure
The authors declare no conflict of interest, financial or otherwise.
References
1. Guariguata L, Whiting DR, Hambleton I, et al. Global estimates of diabetes prevalence for 2013 and projections for 2035. Diabetes Res Clin Pract. 2014;103(2):137–149. doi:10.1016/j.diabres.2013.11.002
2. Srinivasan K, Viswanad B, Asrat L, et al. Combination of high-fat diet-fed and low-dose streptozotocin-treated rat: a model for type 2 diabetes and pharmacological screening. Pharmacol Res. 2005;52(4):313–320.
3. Hernandez RK, Do TP, Critchlow CW, et al. Patient-related risk factors for fracture-healing complications in the United Kingdom general practice research database. Acta Orthop. 2012;83(6):653–660. doi:10.3109/17453674.2012.747054
4. Tianquan Z, Quan A, Min F, et al. The application of streptozotomycinand high fat & sugar diet in rat type 2 diabetes mellitus model. J Hubei Inst Sci Technol. 2012;26(6):468–469.
5. Zhendong L, Jielin Z, Min G, et al. Distraction osteogenesis and early fracture healing in mice. Tissue Eng Res Clin Rehabil China. 2009;02:225–228.
6. Yasui N, Sato M, Ochi T, et al. Three modes of ossification during distraction osteogenesis in the rat. J Bone Joint Surg Br. 1997;79(5):824–830. doi:10.1302/0301-620X.79B5.0790824
7. Wang W, Zhang X, Zheng J, et al. High glucose stimulates adipogenic and inhibits osteogenic differentiation in MG-63 cells through cAMP/protein kinase A/extracellular signal-regulated kinase pathway. Mol Cell Biochem. 2010;338(1–2):115–122. doi:10.1007/s11010-009-0344-6
8. Balint E, Szabo P, Marshall CF, et al. Glucose-induced inhibition of in vitro bone mineralization. Bone. 2001;28(1):21–28. doi:10.1016/S8756-3282(00)00426-9
9. Beutler B, Cerami A. Cachectin (Tumor Necrosis Factor): A Macrophage Hormone Governing Cellular Metabolism and Inflammatory Response[Z]. Endocrine Reviews.Vol. 9;1988: 57–66.
10. Suarez EC, Boyle SH, Lewis JG, et al. Increases in stimulated secretion of proinflammatory cytokines by blood monocytes following arousal of negative affect: the role of insulin resistance as moderator. Brain Behav Immun. 2006;20(4):331–338. doi:10.1016/j.bbi.2005.09.005
11. Hotamisligil GS, Murray DL, Choy LN, et al. Tumor necrosis factor alpha inhibits signaling from the insulin receptor. Proc Natl Acad Sci U S A. 1994;91(11):4854–4858. doi:10.1073/pnas.91.11.4854
12. Kallel A, Ftouhi B, Jemaa Z, et al. Tumor necrosis factor-alpha (TNF-αlpha) −863C/A promoter polymorphism is associated with type 2 diabetes in Tunisian population. Diabetes Res Clin Pract. 2013;102(2):e24–e28. doi:10.1016/j.diabres.2013.09.015
13. Li J, Sarosi I, Yan XQ, et al. RANK is the intrinsic hematopoietic cell surface receptor that controls osteoclasto genesis and regulation of bone mass and calcium metabolism. Proc Natl Acad Sci U S A. 2000;97(4):1566–1571. doi:10.1073/pnas.97.4.1566
14. Boyce BF, Li P, Yao Z, et al. TNF-α and pathologic bone resorption. Keio J Med. 2005;54(3):127–131. doi:10.2302/kjm.54.127
15. Huang H, Zhao N, Xu X, et al. Dose-specific effects of tumor necrosis factor alpha on osteogenic differentiation of mesenchymal stem cells. Cell Prolif. 2011;44(5):420–427. doi:10.1111/j.1365-2184.2011.00769.x
16. Alblowi J, Kayal RA, Siqueria M, et al. High levels of tumor necrosis factor-α contribute to accelerated loss of cartilage in diabetic fracture healing. Am J Pathol. 2009;175(4):1574–1585. doi:10.2353/ajpath.2009.090148
17. Lim JC, Ko KI, Mattos M, et al. TNF-α contributes to diabetes impaired angiogenesis in fracture healing. Bone. 2017;99:26–38. doi:10.1016/j.bone.2017.02.014
18. Du X, Xie Y, Xian CJ, et al. Role of FGFs/FGFRs in skeletal development and bone regeneration. J Cell Physiol. 2012;227(12):3731–3743. doi:10.1002/jcp.24083
19. Kawaguchi H, Kurokawa T, Hanada K, et al. Stimulation of fracture repair by recombinant human basic fibroblast growth factor in normal and streptozotocin- diabetic rats. Endocrinology. 1994;135(2):774–781. doi:10.1210/endo.135.2.8033826
20. Facchiano F, D’Arcangelo D, Russo K, et al. Glycated fibroblast growth factor-2 is quickly produced in vitro upon low-millimolar glucose treatment and detected in vivo in diabetic mice. Mol Endocrinol. 2006;20(11):2806–2818. doi:10.1210/me.2005-0322
 © 2020 The Author(s). This work is published and licensed by Dove Medical Press Limited. The full terms of this license are available at https://www.dovepress.com/terms.php and incorporate the Creative Commons Attribution - Non Commercial (unported, v3.0) License.
By accessing the work you hereby accept the Terms. Non-commercial uses of the work are permitted without any further permission from Dove Medical Press Limited, provided the work is properly attributed. For permission for commercial use of this work, please see paragraphs 4.2 and 5 of our Terms.
© 2020 The Author(s). This work is published and licensed by Dove Medical Press Limited. The full terms of this license are available at https://www.dovepress.com/terms.php and incorporate the Creative Commons Attribution - Non Commercial (unported, v3.0) License.
By accessing the work you hereby accept the Terms. Non-commercial uses of the work are permitted without any further permission from Dove Medical Press Limited, provided the work is properly attributed. For permission for commercial use of this work, please see paragraphs 4.2 and 5 of our Terms.