")
Back to Journals » OncoTargets and Therapy » Volume 8
Role of NSC319726 in ovarian cancer based on the bioinformatics analyses
Authors Xue J, Yang G, Ding H, Wang P, Wang C
Received 9 April 2015
Accepted for publication 15 September 2015
Published 15 December 2015 Volume 2015:8 Pages 3757—3765
DOI https://doi.org/10.2147/OTT.S86343
Checked for plagiarism Yes
Review by Single anonymous peer review
Peer reviewer comments 4
Editor who approved publication: Dr Faris Farassati
Ji Xue,1 Guang Yang,1 Hong Ding,1 Pu Wang,2 Changhong Wang3
1Department of Chinese Medicine, The Second Hospital of Jilin University, 2The Clinical Medical College of Jilin University (Grade 2013), 3Department of Chinese Medicine, China–Japan Union Hospital of Jilin University, Changchun City, People’s Republic of China
Aim: This study aimed to explore the molecular mechanisms of NSC319726 in ovarian cancer by bioinformatics analyses.
Methods: Gene expression profile GSE35972 was downloaded from the Gene Expression Omnibus database. The data set contains six samples, including three samples of TOV112D cells untreated and three samples of TOV112D cells treated with NSC319726. The differentially expressed genes (DEGs) between untreated and treated samples were analyzed using the limma package. Kyoto Encyclopedia of Genes and Genomes pathway analysis was performed using the signaling pathway impact analysis package, followed by the functional annotation of DEGs and protein–protein interaction network construction. Finally, the subnetwork was identified, and Gene Ontology functional enrichment analysis was performed on the DEGs enriched in the subnetwork.
Results: A total of 120 upregulated and 126 downregulated DEGs were identified. Six Kyoto Encyclopedia of Genes and Genomes pathways were significantly perturbed by DEGs, and the pathway of oocyte meiosis was identified as the most perturbed one. Oocyte meiosis was enriched by eight downregulated DEGs, such as ribosomal protein S6 kinase, 90 kDa, and polypeptide 6 (RPS6KA6). After functional annotation, eight transcription factors were upregulated (such as B-cell CLL/lymphoma 6 [BCL6]), and three transcription factors were downregulated. Seven tumor suppressor genes, such as forkhead box O3 (FOXO3), were upregulated. Additionally, in the protein–protein interaction network and subnetwork, cyclin B1 (CCNB1) and cell division cycle 20 (CDC20) were hub genes, which were also involved in the functions related to mitotic cell cycle.
Conclusion: NSC319726 may play an efficient role against ovarian cancer via targeting genes, such as RPS6KA6, BCL6, FOXO3, CCNB1, and CDC20, which are involved in oocyte meiosis pathway.
Keywords: ovarian cancer, NSC319726, differentially expressed genes, pathway impact analysis, protein–protein interaction
Introduction
Ovarian cancer is the most lethal of the gynecologic malignancies, with an estimated 200,000 cases and 125,000 deaths occurring annually worldwide.1 Ovarian cancer is often called the “silent killer” because its signs and symptoms are frequently absent until it has reached advanced stages where the chance of cure is poor.2 At present, there is a lack of successful treatment strategies for this disease.3 Approximately 80% of patients with newly diagnosed ovarian cancer have a response to platinum-based chemotherapy. However, most patients have relapses, and responses to subsequent therapies are generally short lived.4,5 Therefore, numerous studies have made contributions to explore the therapeutic method for ovarian cancer.
NSC319726 is a newly discovered anticancer small-molecule drug, which functions to the p53R175 protein. This compound has been found to kill p53R172H knock-in mice with extensive apoptosis and inhibit xenograft tumor growth in a 175 allele-specific mutant p53-dependent manner.6 TP53 is the most frequently mutated gene in human cancer.7 In recent, 96.5% of ovarian cases studied by The Cancer Genome Atlas (TCGA) revealed a mutation in tumor protein p53 (TP53) in ovarian cancer.8 Thus, rescuing the function of mutant TP53 is an attractive cancer therapeutic strategy. Several small-molecule drugs have been claimed to reactivate the mutant p53 protein, including CP-31398, PRIMA-1, and MIRA-1.9,10 However, the cell-type sensitivity of these small molecules is insufficient because cancers are known to be heterogeneous in nature.6 Importantly, study has found that NSC319726 manifests higher sensitivity in a panel of cell lines carrying p53 mutations independently of their diverse genetic backgrounds and cell-type specificity.6 Although NSC319726 has demonstrated good inhibitory effect on the p53 mutant cell, the genetic anticancer mechanisms of this small-molecule drug are far from being understood.
In this study, we utilized the bioinformatics methods to assess the gene expression profiles derived from epithelial ovarian cancer cell treated with NSC319726 and untreated subjects in GSE35972. We performed pathway analysis and functional annotation. Finally, protein–protein interaction (PPI) network and subnetwork were constructed and analyzed to study and identify the target genes and pathways for the therapeutic effect of NSC319726. We aimed to explore the molecular mechanisms of NSC319726 in ovarian cancer by bioinformatics analyses. Findings of this study may potentially serve as biomarkers in both diagnosis and prognosis of ovarian cancer.
Data and methods
Affymetrix microarray data
The microarray expression profile data set GSE35972 was downloaded from National Center of Biotechnology Information Gene Expression Omnibus (http://www.ncbi.nlm.nih.gov/geo/) database, which is based on the GPL570 [HG-U133_Plus_2] Affymetrix Human Genome U133 Plus 2.0 Array platform. The cell type of these data set samples was human epithelial ovarian cancer cell, and cell line was TOV112D, which was cultured in Dulbecco’s Modified Eagle’s Medium with 10% fetal bovine serum. The data set contains six samples, including three samples of TOV112D cells untreated and three samples of TOV112D cells treated with NSC319726 (1 μM, 24 hours).
Data preprocessing and differential expression analysis
The raw data were first preprocessed using the Affy11 package in R language. Then, the data were converted into expression measures and performed background correction, quartile data normalization, and probe summarization by the robust multiarray average12 algorithm in R. The paired t-test based on the limma13 package in R was used to identify the differentially expressed genes (DEGs) between untreated and treated samples. The false discovery rate (FDR) was used to correct multiple comparisons. The DEGs with FDR <0.05 and |log2 fold-change| >0.63 were considered to be significant.
Pathway analysis of the DEGs
Kyoto Encyclopedia of Genes and Genomes (KEGG)14 knowledge database is used for the classification of correlating gene sets into their respective pathways. The signaling pathway impact analysis (SPIA)15 is a novel KEGG pathway analysis tool, which makes full advantage of the pathways topology and the directed gene–gene interactions in assessing pathway significance. SPIA provides improved specificity and better pathway ranking when compared with classical overrepresentation analysis,16,17 as well as increased sensitivity when compared with the gene set enrichment analysis.18 Vaske et al19 developed a pathway analysis approach called PAthway Recognition Algorithm using Data Integration on Genomic Models (PARADIGM), which could use multiple type of genome-wide data; however, only analysis of DEGs was needed in our study. In addition, Pedersen et al20 also developed a metric for pathway-level imbalance but the calculation procedure was somewhat complex and had not been widely used presently. SPIA can measure the actual perturbation of genes on a given pathway under a given condition.
In this article, we used SPIA algorithm to calculate the global pathway significance P-value combining the enrichment and perturbation P-values. Besides, we also calculated the FDR using the Bonferroni correction procedure in SPIA. The global pathway significance, P-value <0.05, was set as threshold value to identify the pathways impacted by DEGs significantly. Among these identified pathways, the most perturbed pathway was identified with FDR <0.05.
Functional annotation of DEGs
Based on the data information of transcription factors (TFs), we performed functional annotation analysis to determine whether these DEGs had the function of transcriptional regulation. The data of TFs were obtained from TRANSFAC®21 database. Tumor suppressor gene database (TSGene)22 integrates tumor suppressor genes (TSGs) with large-scale experimental evidences to provide a comprehensive resource for further investigation of TSGs and their molecular mechanisms in cancer. Tumor-associated gene (TAG) database23 is used to save genes that play roles in carcinogenesis. In this article, we extracted all the known oncogenes and TSGs from the databases of TAG and TSG.
PPI network construction and subnetwork identification
The Search Tool for the Retrieval of Interacting Genes (STRING) database24 is a precomputed global resource, which has been designed to evaluate the PPI information. Cytoscape25 is a general bioinformatics package used for visualizing biological network and integrating data. In this article, the STRING online tool was applied to analyze the PPI of DEGs, and the Cytoscape package was used to construct the PPI network. In the PPI network, each node stands for a gene and the edges represent the interactions between the nodes. Degree indicates the number of edges linked to a given node, and the nodes with high degree were defined as the hub genes that possess important biological functions. Only those experimentally validated interactions with a combined score >0.4 were selected as significant.
CFinder26 is an algorithm designed to locate and visualize the overlapping community structure of networks. In this study, the Clique Percolation Method27 in CFinder was used to identify the subnetwork, and the clique size was set as k=4.
Gene Ontology28 is a tool for unification of biology, which collects structured, defined, and controlled vocabulary for a large scale of genes annotation. In this article, Gene Ontology functional enrichment analysis of the DEGs in the subnetwork was performed to identify the enriched biological process (BP), cellular component (CC), and molecular function (MF) terms with the threshold of P-value <0.05.
Results
Identification of DEGs
After data preprocessing, a total of 246 genes were assessed to be differentially expressed in treated samples compared with untreated samples. These DEGs included 120 upregulated and 126 downregulated DEGs. The expression levels of DEGs in all samples were presented in the heatmap (Figure 1).
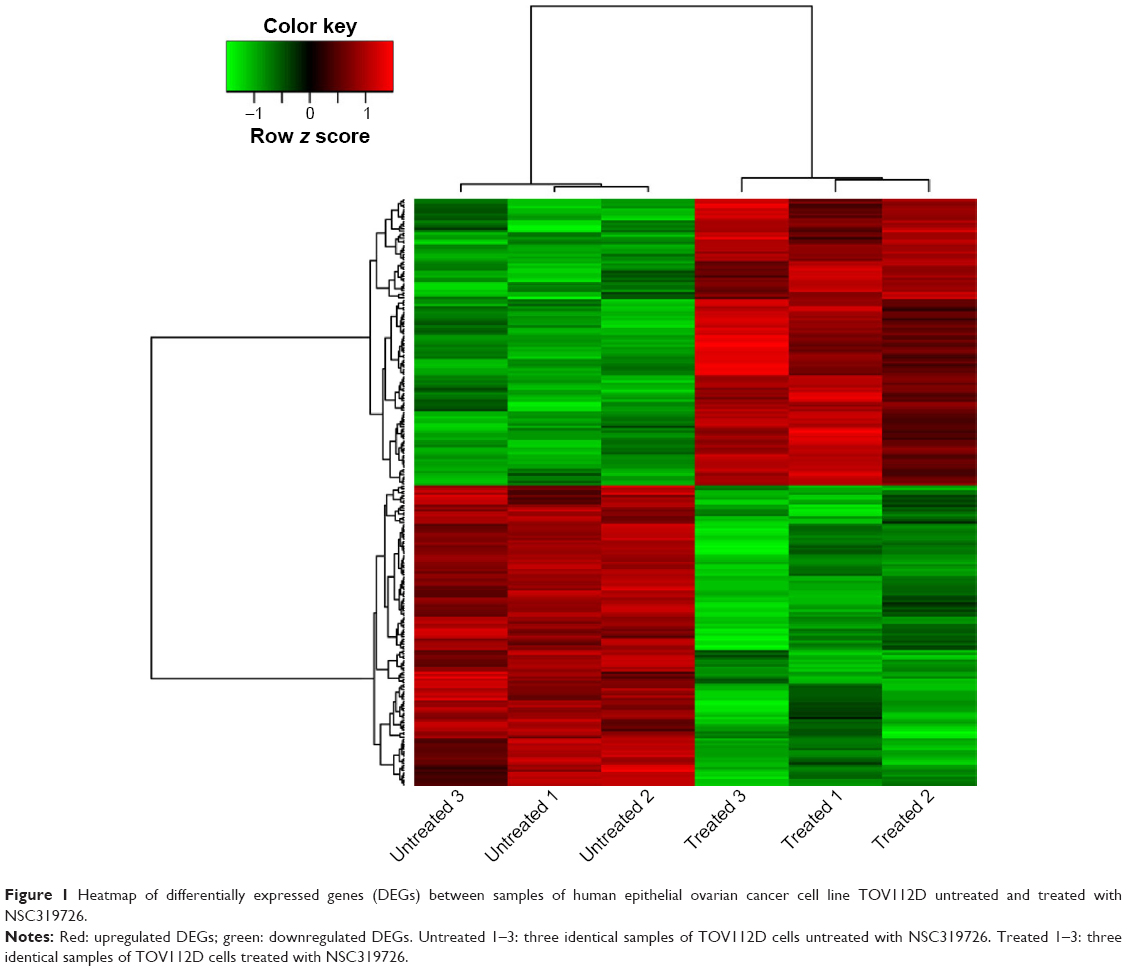 | Figure 1 Heatmap of differentially expressed genes (DEGs) between samples of human epithelial ovarian cancer cell line TOV112D untreated and treated with NSC319726. |
Pathway impact analysis
There were six KEGG pathways that were significantly impacted by DEGs under the threshold of global pathway significance, P-value <0.05. Among these pathways, oocyte meiosis, vibrio cholera infection, and T-cell receptor-signaling pathway were activated, whereas mineral absorption, cell cycle, and progesterone-mediated oocyte maturation were inhibited (Table 1).
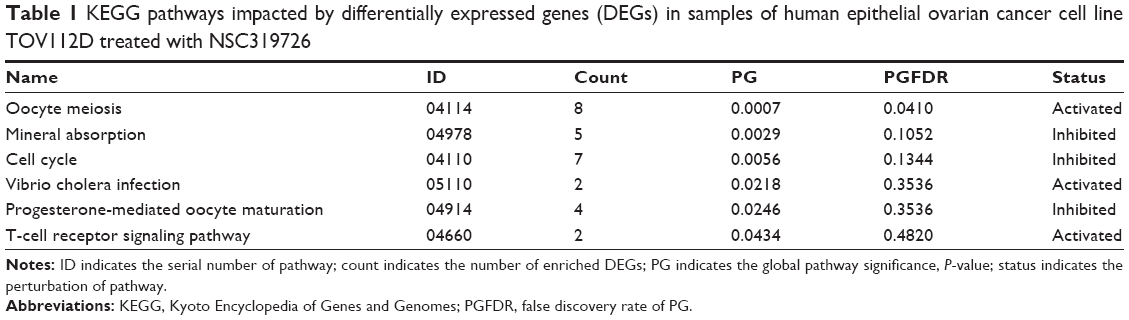 | Table 1 KEGG pathways impacted by differentially expressed genes (DEGs) in samples of human epithelial ovarian cancer cell line TOV112D treated with NSC319726 |
Under the threshold of FDR <0.05, the pathway of oocyte meiosis was identified as the most perturbed pathway, and it was enriched by eight downregulated DEGs, such as ribosomal protein S6 kinase, 90 kDa, polypeptide 6 (RPS6KA6), cyclin B1 (CCNB1), and cell division cycle 20 (CDC20).
Functional annotation of DEGs
After researching the expression of TFs and TAGs, we found that eight TFs, such as B-cell CLL/lymphoma 6 (BCL6), MAX interactor 1, and dimerization protein, were significantly upregulated and three TFs were significantly downregulated, including forkhead box A1 (FOXA1), FOXM1, and pre-B-cell leukemia homeobox 1. In addition, ten upregulated genes were TAGs. Thereinto, two were oncogenes, seven were TSGs, such as forkhead box O3 (FOXO3), and the effect of the left one was uncertain. In the downregulated TAGs, five were oncogenes, such as aurora kinase A, six were TSGs, and the effect of the other three was uncertain (Table 2).
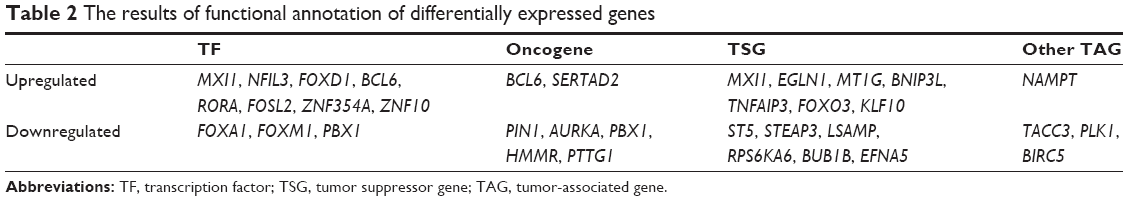 | Table 2 The results of functional annotation of differentially expressed genes |
PPI network construction
Based on the STRING database, the PPI networks with 114 nodes and 735 edges were constructed using Cytoscape (Figure 2). Twelve nodes with degree >36 were identified as hub genes, such as CCNB1 (degree =45), CDC20 (degree =42), and polo-like kinase 1 (degree =41).
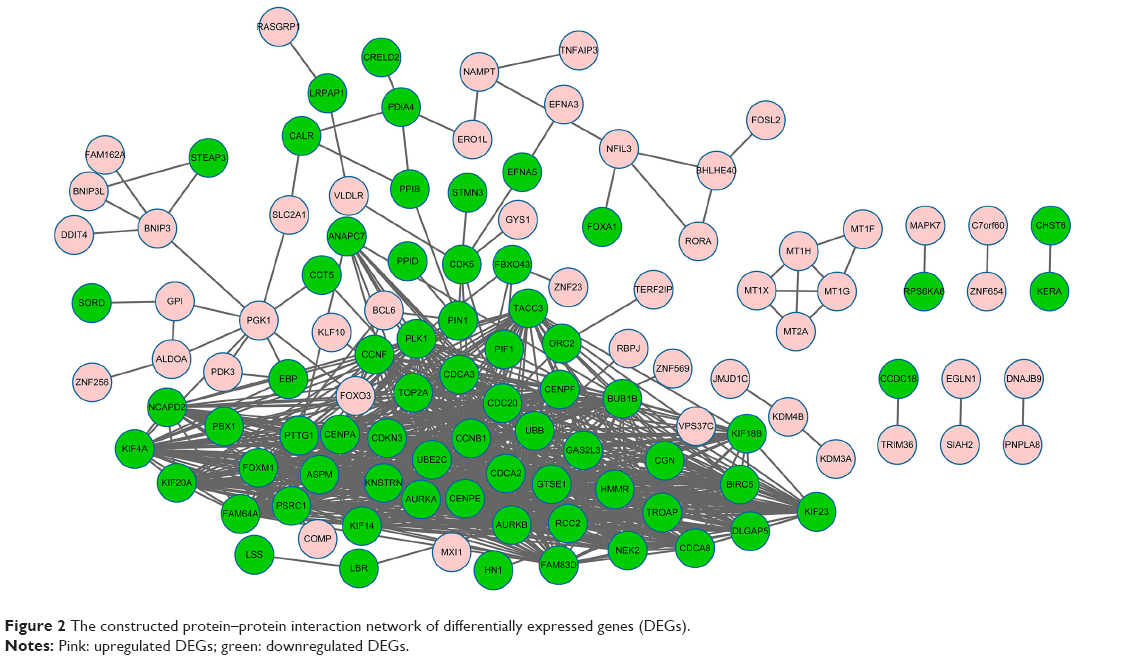 | Figure 2 The constructed protein–protein interaction network of differentially expressed genes (DEGs). |
Subnetwork identification and functional enrichment analysis
Based on CFinder, two subnetworks with six and 653 interaction pairs, respectively, were obtained. In the subnetwork with 653 interaction pairs, most of the DEGs were downregulated except for FOXO3 (Figure 3; Supplementary material). After functional enrichment analysis, DEGs were enriched in three categories, including BP, CC, and MF. For example, mitotic cell cycle and nuclear division were BP terms, spindle pole was CC term, and microtubule binding was MF term (Table 3).
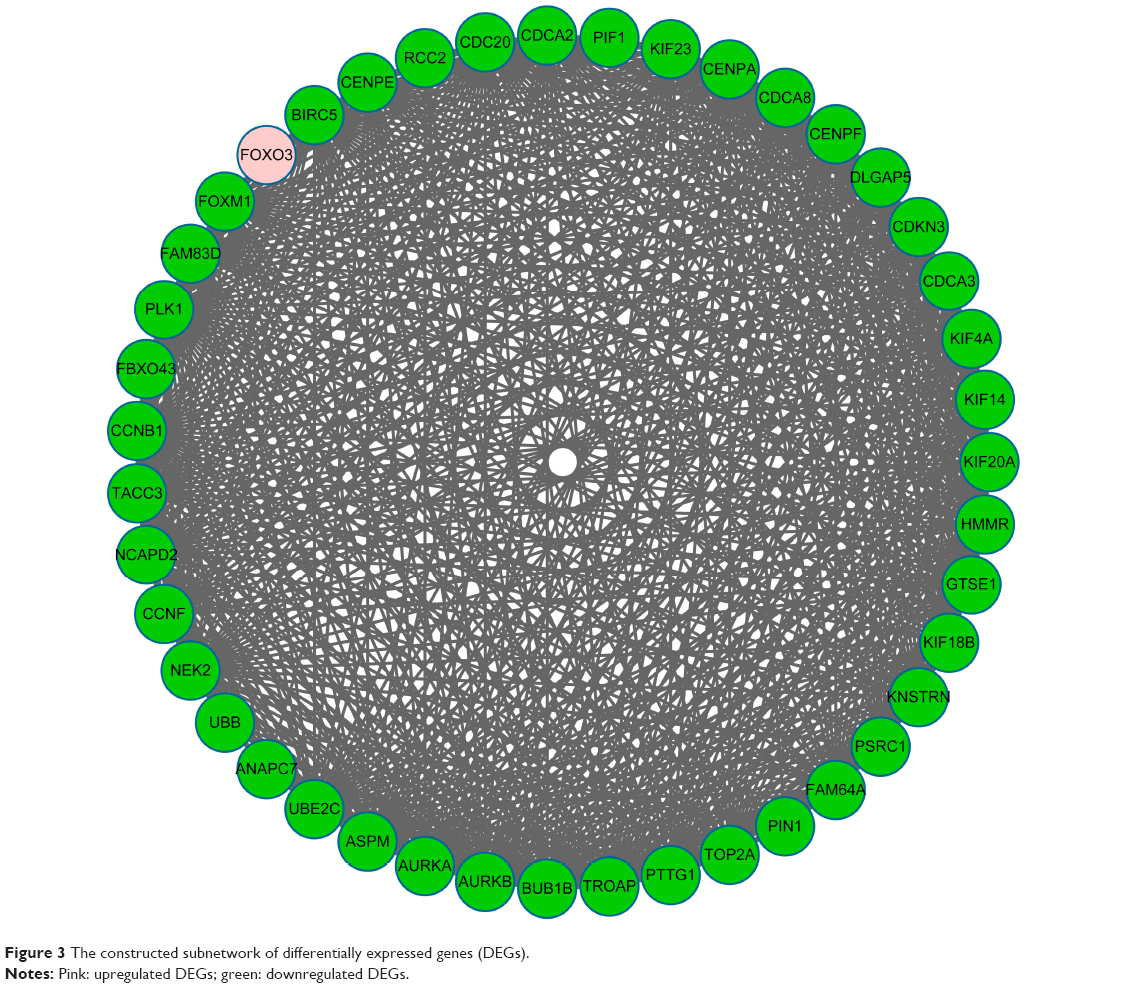 | Figure 3 The constructed subnetwork of differentially expressed genes (DEGs). |
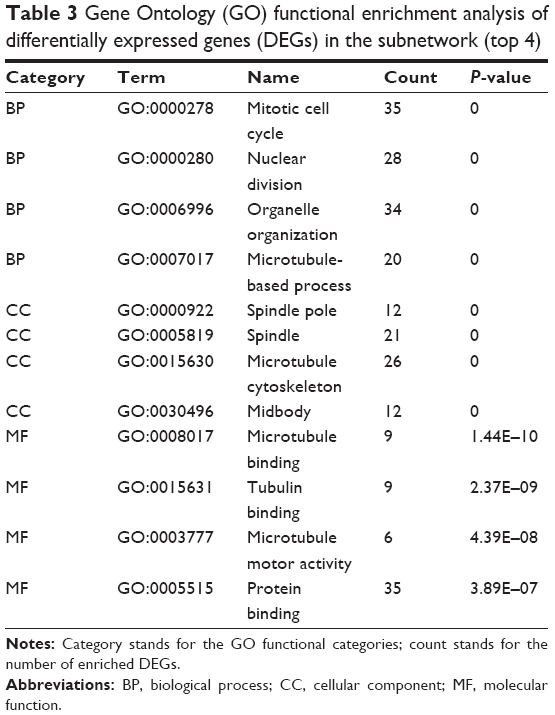 | Table 3 Gene Ontology (GO) functional enrichment analysis of differentially expressed genes (DEGs) in the subnetwork (top 4) |
Discussion
Ovarian cancer is the most frequent cause of cancer death among all gynecologic cancers, and therapies have not improved cure rates over the last 30 years.29 Therefore, searching for an effective treatment strategy is of great importance. In this study, a total of 120 upregulated and 126 downregulated DEGs were identified between treated and untreated samples through gene expression profile of GSE35972. There were six pathways that were significantly affected by DEGs, such as pathway of oocyte meiosis. Eight downregulated DEGs were enriched in pathway of oocyte meiosis, such as RPS6KA6, CCNB1, and CDC20. TF of BCL6 and TSG of FOXO3 were upregulated. Additionally, CCNB1 and CDC20 were hub genes in the PPI network and subnetwork. This result suggested that these genes and pathways may be candidate agents for NSC319726 in treating ovarian cancer.
In this article, RPS6KA6 was found downregulated in the NSC319726-treated group; besides, it was enriched in the pathway of oocyte meiosis. RPS6KA6 belonging to the ribosomal s6 kinase (RSK) family plays a role in cell growth and proliferation.30 Serra et al reported that RPS6KA6 was overexpressed in breast cancer cell lines, supporting a role for the protein in breast tumorigenesis.31 Molecular studies have shown that overexpression of RPS6KA6 can promote the metastatic and invasive capability of renal cell carcinoma cell lines.32 At present, RPS6KA6 was downregulated in NSC319726-treated samples, which may suggest the inhibitory action of NSC319726 on the expression of RPS6KA6. In addition, RPS6KA6 was enriched in the pathway of oocyte meiosis, which was identified as the most perturbed pathway and was activated in the NSC319726-treated samples. It has long been realized that the immature oocytes stored in the ovary are very sensitive.33 This inherent sensitivity often leads to the reduction of oocytes among the female cancer survivors, which predisposes them to infertility and premature menopause associated with health problems later in life.33 The activation of this pathway may indicate the therapeutic effect of NSC319726 on ovarian cancer. Although there are few reports about the relationship between this pathway and RPS6KA6, we can speculate that the activation of this pathway may be caused by the downregulation of RPS6KA6 under the action of NSC319726. Taken together, the results indicate that NSC319726 may target RPS6KA6, which affects the pathway of oocyte meiosis to serve as a new potential anticancer drug for patients with ovarian cancer.
In this article, TF of BCL6 and TSG of FOXO3 were found to be overexpressed in treated samples. BCL6 functions as transcriptional repressors to negatively regulate the cell cycle and has functional property of inhibiting cell growth.34 Importantly, BCL6 has been identified as the binding proteins of heparin-binding epidermal growth factor-like growth factor (HB-EGF).35 This study has found that HB-EGF plays a key role in tumor formation and growth in patients with ovarian cancer.36 Miyamoto et al reported that HB-EGF gene expression in cancerous tissues of patients with ovarian cancer was significantly elevated.37 BCL6 is bound to the cytoplasmic domain of HB-EGF to suppress cell cycle.38 Therefore, it is plausible that NSC319726 may stimulate the function of BCL6 to decrease HB-EGF, which may play a role on the treatment of ovarian cancer. FOXO3, a TSG, is involved in the PPI network and subnetwork. This gene likely functions as a trigger for apoptosis through expression of genes necessary for cell death.39 Zou et al suggested that FOXO3 played a critical role in suppressing breast cancer cell growth and tumorigenesis in vivo.40 Additionally, Fei et al reported that low expression of FOXO3 was associated with poor prognosis in patients with ovarian cancer.41 Thus, agents that activate FOXO3 may be novel therapeutic agents that can inhibit and prevent tumor proliferation and development. In our study, FOXO3 was overexpressed in the NSC319726-treated samples, which suggests that FOXO3 may be a key gene that is targeted by NSC319726. In brief, TF of BCL6 and TSG of FOXO3 may be the targets of NSC319726.
Our findings showed that CCNB1 and CDC20 that are involved in the mitotic cell cycle were hub genes both in the PPI network and in the subnetwork, indicating their crucial roles in ovarian cancer. Research has found that the loss of appropriate cell cycle regulation leads to genomic instability.42 Mitotic cell cycle is believed to play a role in the etiology of spontaneous cancers.43 CCNB1 is a regulatory protein involved in mitosis and plays an essential role in cell proliferation.44 Overexpression of CCNB1 has been reported in the development and progression of various human cancers, including colorectal, breast, and cervical cancers.45–47 Additionally, CCNB1 is the dominant cyclin related to poor prognosis in some cancer, such as breast cancer.48 Importantly, CCNB1 has been shown to overexpress in tumors with TP53 mutation, and TP53 has been shown to regulate the promoter of CCNB1 in opposing ways.49 The p53 protein can inhibit malignant transformation through direct and indirect regulations of transcription of the genes associated with cell cycle and apoptosis.50 Thus, the downregulation of CCNB1 in our article may be caused by TP53 whose mutations can be inhibited by NSC319726.6 On the other hand, another p53-suppressive gene, CDC20, which is frequently upregulated in many types of malignancies, was also found to be downregulated in the treated samples. Mondal et al reported that enhanced expression of CDC20 was detected in oral squamous cell carcinoma.51 CDC20 is also found to be remarkably upregulated in bladder cancer tissues by quantitative real-time polymerase chain reaction experiments.50 NSC319726 has been shown to reduce the expression level of the mutant p53 protein.6 Presently, CCNB1 and CDC20 were both downregulated in NSC319726-treated samples, which indicates that NSC319726 may target CCNB1 and CDC20 to play the therapeutic effects on ovarian cancer. Therefore, attentions on the drug potential of NSC319726 may open vistas for developing novel therapy for ovarian cancer treatment.
Numerous studies have suggested that cancer is associated with genomic instability, such as loss of heterozygosity.52,53 However, cancer can take hundreds of different forms, which is an obstacle to developing therapeutic targeted agents to treat patients with cancer.54 In our study, NSC319726 may have therapeutic effect on ovarian cancer. Future study revolving around evading resistance is badly needed to guarantee the therapy.55
Recently, some studies based on Epstein–Barr virus nuclear antigen ChIP-seq data revealed that Epstein–Barr virus superenhancers might upregulate TF expression and thereby control tumor cell growth.56,57 Additionally, Zhou and Wong58 performed comparative analysis and assessment of PPI data sets, which might provide promising aspects for cancer research.
Although bioinformatics technologies have the potential to identify and validate the candidate agents for serious diseases, some limitations remain in this study. First, the sample size for microarray analysis was small, which may cause a high rate of false-positive result. Second, experimental verification was lacking in this study. Furthermore, genetic and experimental studies with larger sample size are still needed to confirm the results in the future.
Conclusion
In summary, our data provide a comprehensive bioinformatics analyses of DEGs and pathways, which may be involved in the treatment of ovarian cancer. The findings in this study may contribute to our understanding of the underlying molecular mechanisms of NSC319726 in treating ovarian cancer. DEGs, such as RPS6KA6, BCL6, FOXO3, CCNB1, and CDC20, and pathway of oocyte meiosis may be the potential ovarian cancer therapeutic targets of NSC319726.
Disclosure
The authors report no conflicts of interest in this work.
References
Perren TJ, Swart AM, Pfisterer J, et al; ICON7 Investigators. A phase 3 trial of bevacizumab in ovarian cancer. N Engl J Med. 2011;365:2484–2496. | ||
Shiner A, Burbos N. Ovarian cysts and ovarian cancer. InnovAiT. 2012;5:547–557. | ||
Cancer Genome Atlas Research Network. Integrated genomic analyses of ovarian carcinoma. Nature. 2011;474:609–615. | ||
Fung-Kee-Fung M, Oliver T, Elit L, Oza A, Hirte H, Bryson P. Optimal chemotherapy treatment for women with recurrent ovarian cancer. Curr Oncol. 2007;14:195. | ||
Pujade-Lauraine E, Wagner U, Aavall-Lundqvist E, et al. Pegylated liposomal doxorubicin and carboplatin compared with paclitaxel and carboplatin for patients with platinum-sensitive ovarian cancer in late relapse. J Clin Oncol. 2010;28:3323–3329. | ||
Yu X, Vazquez A, Levine AJ, Carpizo DR. Allele-specific p53 mutant reactivation. Cancer Cell. 2012;21:614–625. | ||
Petitjean A, Mathe E, Kato S, et al. Impact of mutant p53 functional properties on tp53 mutation patterns and tumor phenotype: lessons from recent developments in the iarc tp53 database. Hum Mutat. 2007;28:622–629. | ||
Ahmed AA, Etemadmoghadam D, Temple J, et al. Driver mutations in tp53 are ubiquitous in high grade serous carcinoma of the ovary. J Pathol. 2010;221:49–56. | ||
Bykov VJ, Issaeva N, Zache N, et al. Reactivation of mutant p53 and induction of apoptosis in human tumor cells by maleimide analogs. J Biol Chem. 2005;280:30384–30391. | ||
Foster BA, Coffey HA, Morin MJ, Rastinejad F. Pharmacological rescue of mutant p53 conformation and function. Science. 1999;286:2507–2510. | ||
Gautier L, Cope L, Bolstad BM, Irizarry RA. Affy – analysis of affymetrix genechip data at the probe level. Bioinformatics. 2004;20:307–315. | ||
Irizarry RA, Hobbs B, Collin F, et al. Exploration, normalization, and summaries of high density oligonucleotide array probe level data. Biostatistics. 2003;4:249–264. | ||
Gentleman R, Carey V, Huber W, Irizarry RA, Dudoit S, et al, editors. Bioinformatics and computational biology solutions using R and Bioconductor. New York: Springer Science & Business Media; 2006. | ||
Kanehisa M, Goto S. Kegg: kyoto encyclopedia of genes and genomes. Nucleic Acids Res. 2000;28:27–30. | ||
Tarca AL, Draghici S, Khatri P, et al. A novel signaling pathway impact analysis. Bioinformatics. 2009;25:75–82. | ||
Draghici S. Statistical intelligence: effective analysis of high-density microarray data. Drug Discov Today. 2002;7:S55–S63. | ||
Draghici S, Khatri P, Martins RP, Ostermeier GC, Krawetz SA. Global functional profiling of gene expression. Genomics. 2003;81:98–104. | ||
Subramanian A, Tamayo P, Mootha VK, et al. Gene set enrichment analysis: a knowledge-based approach for interpreting genome-wide expression profiles. Proc Natl Acad Sci U S A. 2005;102:15545–15550. | ||
Vaske CJ, Benz SC, Sanborn JZ, et al. Inference of patient-specific pathway activities from multi-dimensional cancer genomics data using paradigm. Bioinformatics. 2010;26:i237–i245. | ||
Pedersen BS, Konstantinopoulos PA, Spillman MA, De S. Copy neutral loss of heterozygosity is more frequent in older ovarian cancer patients. Genes Chromosomes Cancer. 2013;52:794–801. | ||
Matys V, Fricke E, Geffers R, et al. Transfac®: transcriptional regulation, from patterns to profiles. Nucleic Acids Res. 2003;31:374–378. | ||
Zhao M, Sun J, Zhao Z. Tsgene: a web resource for tumor suppressor genes. Nucleic Acids Res. 2013;41:D970–D976. | ||
Chen J-S, Hung W-S, Chan H-H, Tsai S-J, Sun HS. In silico identification of oncogenic potential of fyn-related kinase in hepatocellular carcinoma. Bioinformatics. 2013;29:420–427. | ||
Franceschini A, Szklarczyk D, Frankild S, et al. String v9. 1: protein–protein interaction networks, with increased coverage and integration. Nucleic Acids Res. 2013;41:D808–D815. | ||
Shannon P, Markiel A, Ozier O, et al. Cytoscape: a software environment for integrated models of biomolecular interaction networks. Genome Res. 2003;13:2498–2504. | ||
Adamcsek B, Palla G, Farkas IJ, Derényi I, Vicsek T. Cfinder: locating cliques and overlapping modules in biological networks. Bioinformatics. 2006;22:1021–1023. | ||
Derényi I, Palla G, Vicsek T. Clique percolation in random networks. Phys Rev Lett. 2005;94:160202. | ||
Ashburner M, Ball CA, Blake JA, et al. Gene ontology: tool for the unification of biology. Nat Genet. 2000;25:25–29. | ||
Penson RT, Shannon KE, Sharpless NE, Seiden MV. Ovarian cancer: an update on genetics and therapy. Compr Ther. 1998;24:477–487. | ||
Lü X, Lu H, Zhao L, Yang Y, Lu Z. Genome-wide pathways analysis of nickel ion-induced differential genes expression in fibroblasts. Biomaterials. 2010;31:1965–1973. | ||
Serra V, Eichhorn PJ, García-García C, et al. Rsk3/4 mediate resistance to pi3k pathway inhibitors in breast cancer. J Clin Invest. 2013;123:2551–2563. | ||
Fan L, Li P, Yin Z, et al. Ribosomal s6 protein kinase 4: a prognostic factor for renal cell carcinoma. Br J Cancer. 2013;109:1137–1146. | ||
Meirow D, Biederman H, Anderson RA, Wallace WHB. Toxicity of chemotherapy and radiation on female reproduction. Clin Obstet Gynecol. 2010;53:727–739. | ||
Dhordain P, Albagli O, Honore N, et al. Colocalization and heteromerization between the two human oncogene poz/zinc finger proteins, laz3 (bcl6) and plzf. Oncogene. 2000;19:6240–6250. | ||
Kinugasa Y, Hieda M, Hori M, Higashiyama S. The carboxyl-terminal fragment of pro-hb-egf reverses bcl6-mediated gene repression. J Biol Chem. 2007;282:14797–14806. | ||
Yagi H, Yotsumoto F, Sonoda K, Kuroki M, Mekada E, Miyamoto S. Synergistic anti-tumor effect of paclitaxel with crm197, an inhibitor of hb-egf, in ovarian cancer. Int J Cancer. 2009;124:1429–1439. | ||
Miyamoto S, Hirata M, Yamazaki A, et al. Heparin-binding egf-like growth factor is a promising target for ovarian cancer therapy. Cancer Res. 2004;64:5720–5727. | ||
Shimura T, Kataoka H, Ogasawara N, et al. Suppression of prohb-egf carboxy-terminal fragment nuclear translocation: a new molecular target therapy for gastric cancer. Clin Cancer Res. 2008;14:3956–3965. | ||
Davies FE, Dring AM, Li C, et al. Insights into the multistep transformation of mgus to myeloma using microarray expression analysis. Blood. 2003;102:4504–4511. | ||
Zou Y, Tsai WB, Cheng CJ, et al. Forkhead box transcription factor foxo3a suppresses estrogen-dependent breast cancer cell proliferation and tumorigenesis. Breast Cancer Res. 2008;10:R21. | ||
Fei M, Zhao Y, Wang Y, et al. Low expression of foxo3a is associated with poor prognosis in ovarian cancer patients. Cancer Invest. 2009;27:52–59. | ||
Hartwell LH, Kastan MB. Cell cycle control and cancer. Science. 1994;266:1821–1828. | ||
Hunter T, Pines J. Cyclins and cancer ii: cyclin d and cdk inhibitors come of age. Cell. 1994;79:573–582. | ||
Suzuki T, Urano T, Miki Y, et al. Nuclear cyclin b1 in human breast carcinoma as a potent prognostic factor. Cancer Sci. 2007;98:644–651. | ||
Arinaga M, Noguchi T, Takeno S, et al. Clinical implication of cyclin b1 in non-small cell lung cancer. Oncol Rep. 2003;10:1381–1386. | ||
Wang A, Yoshimi N, Ino N, Tanaka T, Mori H. Overexpression of cyclin b1 in human colorectal cancers. J Cancer Res Clin Oncol. 1997;123:124–127. | ||
El-Ghobashy AA, Shaaban AM, Herod J, Innes J, Prime W, Simon Herrington C. Overexpression of cyclins a and b as markers of neoplastic glandular lesions of the cervix. Gynecol Oncol. 2004;92:628–634. | ||
Agarwal R, Gonzalez-Angulo AM, Myhre S, et al. Integrative analysis of cyclin protein levels identifies cyclin b1 as a classifier and predictor of outcomes in breast cancer. Clin Cancer Res. 2009;15:3654–3662. | ||
Yin X-Y, Grove L, Datta NS, Katula K, Long MW, Prochownik EV. Inverse regulation of cyclin b1 by c-myc and p53 and induction of tetraploidy by cyclin b1 overexpression. Cancer Res. 2001;61:6487–6493. | ||
Kidokoro T, Tanikawa C, Furukawa Y, Katagiri T, Nakamura Y, Matsuda K. Cdc20, a potential cancer therapeutic target, is negatively regulated by p53. Oncogene. 2007;27:1562–1571. | ||
Mondal G, Sengupta S, Panda CK, Gollin SM, Saunders WS, Roychoudhury S. Overexpression of cdc20 leads to impairment of the spindle assembly checkpoint and aneuploidization in oral cancer. Carcinogenesis. 2006;28:81–92. | ||
Weinstein JN, Collisson EA, Mills GB, et al. The cancer genome atlas pan-cancer analysis project. Nat Genet. 2013;45:1113–1120. | ||
Pedersen BS, De S. Loss of heterozygosity preferentially occurs in early replicating regions in cancer genomes. Nucleic Acids Res. 2013;41(16):7615–7624. | ||
Rubio-Perez C, Tamborero D, Schroeder MP, et al. In silico prescription of anticancer drugs to cohorts of 28 tumor types reveals targeting opportunities. Cancer Cell. 2015;27:382–396. | ||
Coward JI, Middleton K, Murphy F. New perspectives on targeted therapy in ovarian cancer. Int J Womens Health. 2015;7:189. | ||
Zhou H, Schmidt SC, Jiang S, et al. Epstein-Barr virus oncoprotein super-enhancers control b cell growth. Cell Host Microbe. 2015;17:205–216. | ||
Portal D, Zhou H, Zhao B, et al. Epstein-Barr virus nuclear antigen leader protein localizes to promoters and enhancers with cell transcription factors and ebna2. Proc Natl Acad Sci U S A. 2013;110:18537–18542. | ||
Zhou H, Wong L. Comparative analysis and assessment of m. Tuberculosis h37rv protein–protein interaction datasets. BMC Genomics. 2011;12:S20. |
 © 2015 The Author(s). This work is published and licensed by Dove Medical Press Limited. The full terms of this license are available at https://www.dovepress.com/terms.php and incorporate the Creative Commons Attribution - Non Commercial (unported, v3.0) License.
By accessing the work you hereby accept the Terms. Non-commercial uses of the work are permitted without any further permission from Dove Medical Press Limited, provided the work is properly attributed. For permission for commercial use of this work, please see paragraphs 4.2 and 5 of our Terms.
© 2015 The Author(s). This work is published and licensed by Dove Medical Press Limited. The full terms of this license are available at https://www.dovepress.com/terms.php and incorporate the Creative Commons Attribution - Non Commercial (unported, v3.0) License.
By accessing the work you hereby accept the Terms. Non-commercial uses of the work are permitted without any further permission from Dove Medical Press Limited, provided the work is properly attributed. For permission for commercial use of this work, please see paragraphs 4.2 and 5 of our Terms.