")
Back to Journals » International Journal of General Medicine » Volume 10
Role of magnetic resonance planimetry and magnetic resonance parkinsonism index in discriminating Parkinson’s disease and progressive supranuclear palsy: a retrospective study based on 1.5 and 3 T MRI
Authors Nizamani WM , Mubarak F, Barakzai MD , Ahmed MS
Received 9 February 2017
Accepted for publication 25 July 2017
Published 31 October 2017 Volume 2017:10 Pages 375—384
DOI https://doi.org/10.2147/IJGM.S134297
Checked for plagiarism Yes
Review by Single anonymous peer review
Peer reviewer comments 2
Editor who approved publication: Dr Scott Fraser
Waseem Mehmood Nizamani,1 Fatima Mubarak,1 Muhammad Danish Barakzai,1 Muhammad Saad Ahmed2
1Department of Radiology, Aga Khan University Hospital, Karachi, Pakistan, 2Department of Radiology, Ziauddin University Hospital, Karachi, Pakistan
Objective: The objective of the study was to assess magnetic resonance (MR) planimetric measurements and MR parkinsonism index (MRPI) in differentiating progressive supranuclear palsy (PSP) from Parkinson’s disease (PD) using 1.5 and 3 T MRI scanner.
Subjects and methods: After ethical approval was obtained, analysis of 34 consecutive patients with PSP, 34 patients with PD and 34 healthy controls (HCs) was performed. HCs were age-matched adults without any history of neurodegenerative disease or movement disorders. Retrospective data from the past 10 years (from January 2006 to December 2015) were obtained from the Hospital Information Management System, and informed consent was obtained from all participants. The measurements of pons area–midbrain area ratio (P/M) and MCP width–superior cerebellar peduncle (SCP) width ratio (MCP/SCP) were used, and MRPI was calculated by the formula ([P/M]×[MCP/SCP]).
Results: Midbrain area and SCP width in patients with PSP (19 males, 15 females; mean age =66.7 years) were significantly (P<0.001) smaller than in patients with PD (20 males, 14 females; mean age =66.7 years) and control participants (17 males, 17 females; mean age =66.1 years). P/M and MCP/SCP were significantly higher in patients with PSP than in patients with PD and control participants. All measurements showed some overlap of values between patients with PSP and patients from PD group and control participants. MRPI value was significantly higher in patients with PSP (mean 21.00) than in patients with PD (mean 9.50; P<0.001) and control participants (mean 9.6; P<0.001), without any overlap of values among groups. No correlation was found between the duration of disease, PSP rating scale, PSP staging system and MRPI in this study. No patient with PSP received a misdiagnosis when the index was used (sensitivity and specificity, 100%).
Conclusion: MRPI should be made an essential part of all MRI brain reporting whenever differentiation between PD and PSP is sought for.
Keywords: cognitive dysfunction, movement disorders, progressive supranuclear palsy, Parkinsonism Index
Introduction
Progressive supranuclear palsy (PSP), also called Steele–Richardson–Olszewski syndrome, is a neurodegenerative disorder represented by supranuclear vertical gaze palsy, postural instability and frequent falls, parkinsonian features, cognitive impairment and speech disturbances.1 PSP is characterized by early and severe postural instability, with falls in the first year of disease onset, supranuclear gaze palsy and slowing of vertical saccades. Other characteristics include rapid disease progression and reduced response to medication.
For decades, the diagnosis of parkinsonian disorders has relied upon the presence and progression of characteristic clinical features. To establish a diagnostic consensus, various sets of clinical criteria have been proposed for diagnosis of parkinsonian disorders such as Parkinson’s disease (PD) and PSP.2–4 Clinical criteria proposed by the National Institute for Neurological Disorders and Society for PSP describe categorization of PSP into possible, probable and definite subtypes, depending on mandatory inclusion, supportive and exclusion criteria in detail.3 Idiopathic PD, PSP and multiple system atrophy can be difficult to be differentiated clinically, particularly early in the disease course.5 On the other hand, clinical diagnostic classification of PD based on Movement Disorder Society Clinical Diagnostic Criteria for PD was proposed in 2015 by Postuma et al.4 Movement Disorder Society diagnostic criteria defined “parkinsonism” as the presence of bradykinesia with at least one of rest tremor or rigidity. Once parkinsonism is diagnosed, supportive criteria for idiopathic PD include a clear response to dopaminergic therapy and/or the presence of levodopa-induced dyskinesias.4
Despite these suggestive features, in many cases, all these clinical findings are not as clear-cut as it ideally could be and a great degree of overlap exists.6 Various pathologic data have shown considerable false-positive and false-negative results if diagnosis is made only on the basis of clinical criteria. Misdiagnosis is especially common during the early stages of these disorders due to lack of classic clinical signs.2 Undoubtedly, the definitive diagnostic test is neuropathologic confirmation for both the conditions, which is not possible routinely; however, there is a dire need for an alternative but highly accurate diagnostic tool to predict the prognosis and to guide management of these patients.
Magnetic resonance imaging (MRI) has a substantial role in the diagnosis of various movement disorders. Conventional MRI demonstrates symptomatic causes of parkinsonism, but does not show any specific finding in PD. In parkinsonism variants such as PSP, MRI reveals characteristic patterns of regional atrophy combined with signal changes or microstructural changes in the basal ganglia, pons, middle cerebellar peduncle and superior cerebellar peduncle (SCP) and cerebral subcortical white matter. PSP has unique morphologic and underlying molecular pathologic changes. The cellular characteristic is neurofibrillary degeneration; the distribution and intensity of damage to brainstem and basal ganglia are used to pathologically describe the disorder. A large number of studies aimed at evaluating the possible contribution of MRI to the diagnosis have been performed. The high spatial and contrast resolution combined with the multiplanar capability of MRI enables in vivo demonstration of loss of the bulk of central nervous system structures with the regional distribution pattern typical of some movement disorders.7,8 Pathologic findings suggest that midbrain and SCPs are atrophic in PSP; on the other hand, all these brain structures are spared in PD. The major changes are in substantia nigra, pars compacta and reticulata, globus pallidus, subthalamic nucleus, midbrain and reticular formation of pons. Degeneration of midbrain and pontine structures leads to identifiable changes of brainstem atrophy on MRI, with widening of cerebral aqueduct, thinning of midbrain tegmentum and fourth ventricular dilatation.9,10 We utilized the MR parkinsonism index, which is calculated by multiplying the pons area–midbrain area ratio by the middle cerebellar peduncle width–SCP width ratio, for the combined assessment at routine MR imaging of four brain structures differently involved in atypical parkinsonian syndromes. Magnetic resonance parkinsonism index (MRPI) has been proved to be an extremely reliable measure to distinguish patients with PSP from those with PD and control subjects, on an individual basis.9
International studies have shown that PSP is more familiar than previously recognized, that it is frequently misdiagnosed and that it may initially present to various medical subspecialties.1 The aim of this study was to evaluate the diagnostic accuracy of MRPI which reflects structural anatomic changes measured by quantitative MRI analysis and to propose MRI-based criteria to help the clinician to recognize these parkinsonian syndromes. Objective quantifications of brain structures using linear, surface and volumetric measurements have been reported before in international literatures;6–11 however, no local data has been ever reported regarding parkinsonism variants due to lack of awareness and clinical knowledge. To our knowledge, not a single research was ever performed on the diagnostic workup of PSP in Pakistan. Therefore, taking this into consideration, this research would play a pioneer role in the subspecialty of movement disorder and quantitative MRI parameters at a local level. Our study will broaden the research horizon, spark a new hope of research on this topic resulting in more availability of local data and would be helpful in assessing implication of international results in this part of world.
Subjects and methods
Patients’ inclusion and control participants
This study was conducted at the Aga Khan University Hospital, Karachi, Pakistan, after collecting retrospective data from past 10 years (from January 2006 to December 2015) from the Hospital Information Management System. Data were obtained after getting approval from the ethical review committee of Aga Khan University. Consent was obtained from all the patients at the time of admission and was maintained by ERC.
Data of 34 consecutive patients with clinically proven PSP, 34 patients with clinically proven PD and 34 healthy controls (HCs) were obtained. HCs were age-matched adults without any history of neurodegenerative disease or movement disorders. Findings of neurologic examination were obtained in each case. Established consensus criteria were fulfilled for the diagnosis of PSP3 and PD.5 All HCs had normal findings at neurologic examination. MRI images of brain were blindly reviewed by consultant neuroradiologist with at least 5 years of clinical experience. The measurements of middle cerebellar peduncle (MCP)–SCP width ratio (MCP/SCP) and pons–midbrain area ratio (P/M) were used for calculating MRPI; MRPI was calculated by the formula ([P/M]×[MCP/SCP]).
MRI protocols
All MRIs were performed using MAGNETOM® Avanto Siemens 1.5 T MR Scanner and Toshiba Vantage TITAN™ 3 T MR Scanner. All MR brain included axial intermediate-weighted and T2-weighted dual-echo fast spin echo (repetition time msec/echo time msec, 3500/10.2, 85; section thickness, 4 mm; frequency- and phase-encoding matrix, 288×224), transverse fluid-attenuated inversion recovery (repetition time msec/echo time msec/inversion time msec, 8000/120/2000; slice thickness, 4 mm; frequency- and phase-encoding matrix, 256×224), transverse T2-weighted gradient echo (500/15; section thickness, 4 mm; frequency- and phase-encoding matrix, 256×192; flip angle, 20°) and T1-weighted volumetric spoiled gradient echo (15.2/6.8; slice thickness, 0.6 mm; frequency- and phase-encoding matrix, 256×256; flip angle, 15°) sequences. A volumetric block of 45 mm (0.9 mm section thickness) tangent to the floor of the fourth ventricle was placed on the midsagittal plane to cover both SCPs completely. The resulting images in oblique-coronal plane were utilized for SCP width quantification.
Image interpretation
All the images were interpreted by an experienced consultant neuroradiologist and his clinical fellow in the Department of Radiology using Rogan-Delft Zillion Picture Archiving and Communication System on standard DICOM display monitor. The measurements of midbrain and pontine areas were performed on the midsagittal plane of T2-weighted MRI in all patients and HC participants, as described by Massey et al.5
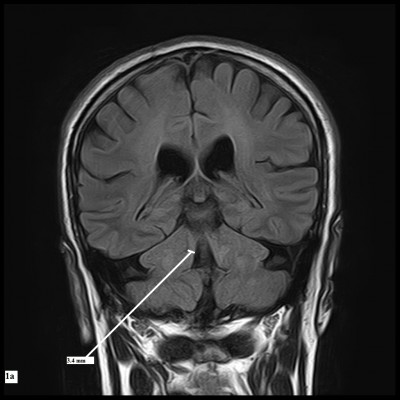
The reference image was taken as the midsagittal section of MR brain. Right and left MCPs were recognized on the parasagittal planes, and the distance between superior and inferior borders of MCPs was measured. Mean values were obtained from the right and left MCPs. Measurements of SCPs were obtained on coronal fluid-attenuated inversion recovery images which are an essential part of MRI brain protocol. Images were visually inspected in the antero-posterior direction to identify the first view on which the inferior colliculi and SCPs were separated. Average measurements of linear distance between the medial and lateral borders of both SCPs at the middle of their extension were calculated (Figure 1). The pons–midbrain area ratio (P/M) and the MCP–SCP width ratio (MCP/SCP) were used for calculating an index that was termed as MRPI as follows: ([P/M]×[MCP/SCP]).8
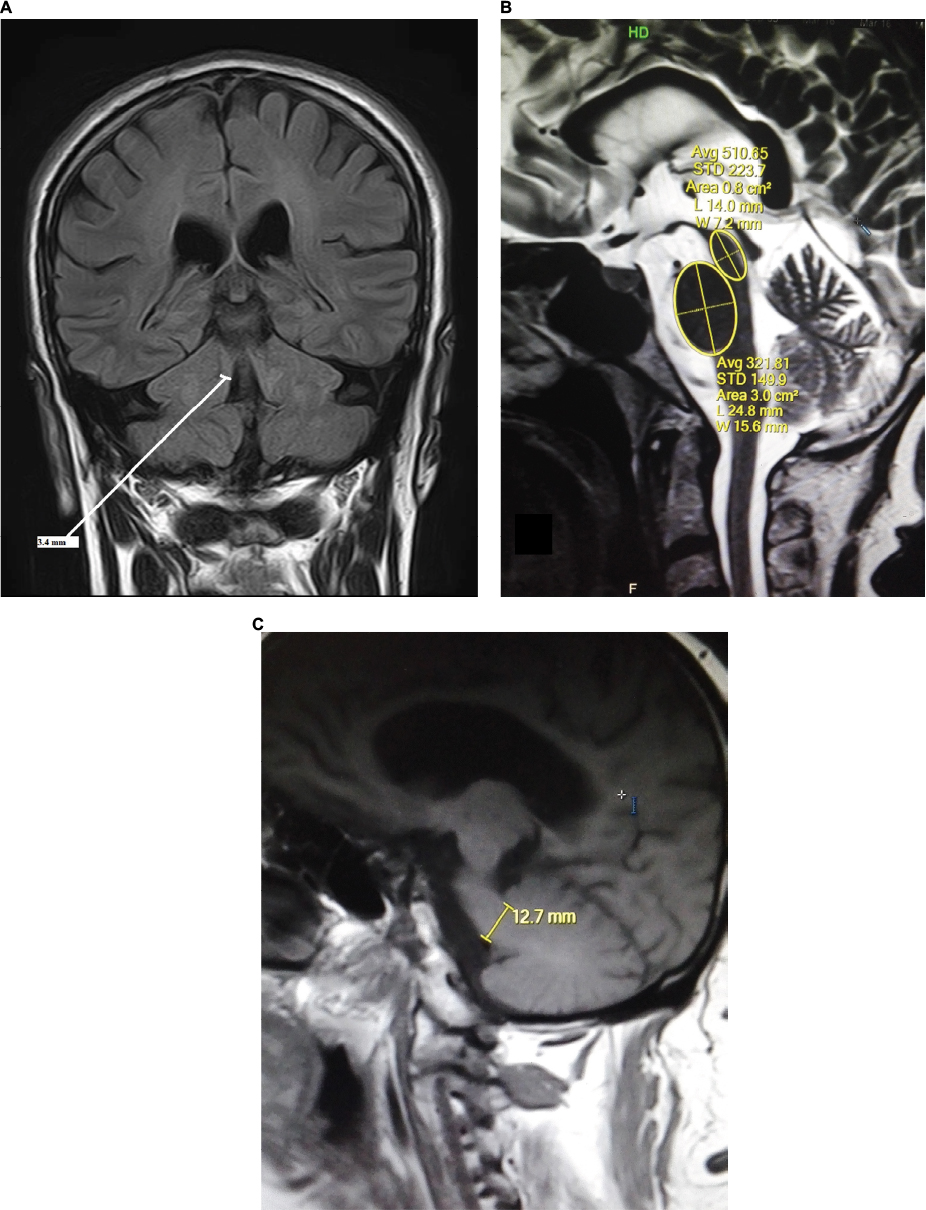 | Figure 1 MRI brain images of this study in orthogonal planes showing measurement annotations and appropriate planes for measurements. Notes: (A) Coronal FLAIR image shows measurement of right superior cerebellar peduncle. (B) Midsagittal T2W image represents the area of midbrain and pons. (C) T1W parasagittal image depicts middle cerebellar peduncle measurement. Abbreviation: FLAIR, fluid-attenuated inversion recovery. |
Statistical analyses
Statistical analysis was performed with statistical software (SPSS for Windows, version 21.0; IBM Corporation, Armonk, NY, USA). The analysis used c2 test followed by evaluation with pairwise test for comparison of two proportions, corrected according to Bonferroni method and one-way analysis of variance, and evaluation with unpaired t-test and Bonferroni correction to compare age at examination, disease duration and age at onset. To assess the differences in Hoehn–Yahr scores and MRI measurements among groups, the Kruskal–Wallis test was used, followed by evaluation with the Mann–Whitney U test for multiple comparisons.
Results
Thirty-four cases with clinical diagnosis of PD (20 males, 14 females; mean age =66.76±6.28; disease duration =6.3±3.86), 34 cases with clinical diagnosis of PSP (19 males, 15 females; mean age =66.76±6.27; disease duration =6.6±2.82) and 34 HC participants (17 males, 17 females; mean age =66.14±7.53) were studied. In all cases, age varied from 58 to 82 (mean age 66.55±6.66) years.
Table 1 shows the demographic information of both patients’ groups and HC participants involved in this study. MR planimetric measurements of all three groups are presented in Table 2. All the measurements are the mean values calculated from individual measurements. Midbrain measurement revealed significantly smaller mean midbrain area of 96.02 mm2 in PSP subjects in comparison to PD patients (mean area of 145.58 mm2) and HC participants (mean area of 149.41 mm2). Similarly, the mean width of SCP in patients with PSP was 2.81 mm, which was significantly smaller than 4.33 mm in PD patients and 4.36 mm in HC participants (P<0.001). The analysis of MCP dimensions showed that PSP, PD and HC cases had mean values of 12.78, 12.81 and 13.4 mm, respectively. No significant difference was found between PD and HC participants regarding individual measurements of midbrain, pons, SCP and MCP. Comparison of P/M and MCP/SCP ratio among the three groups demonstrated significantly higher values in patients with PSP than HC participants and PD patients (Figures 2 and 3).
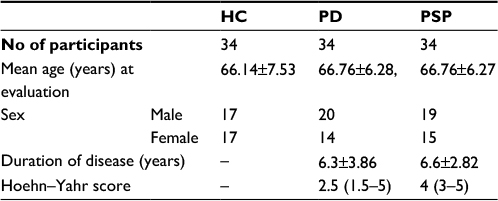 | Table 1 Demographic data of PD and PSP patients along with healthy control participants involved in this study Abbreviations: HC, healthy control; PD, Parkinson’s disease; PSP, progressive supranuclear palsy. |
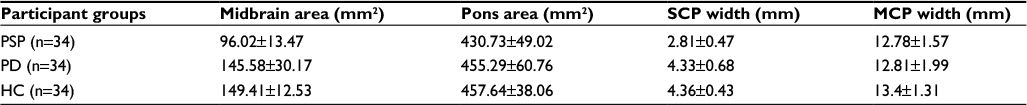 | Table 2 MR planimetric measurements in three different subgroups of this study Note: Values are medians and mean ± SD. Abbreviations: HC, healthy control; MCP, middle cerebellar peduncle; PD, Parkinson’s disease; PSP, progressive supranuclear palsy; SCP, superior cerebellar peduncle. |
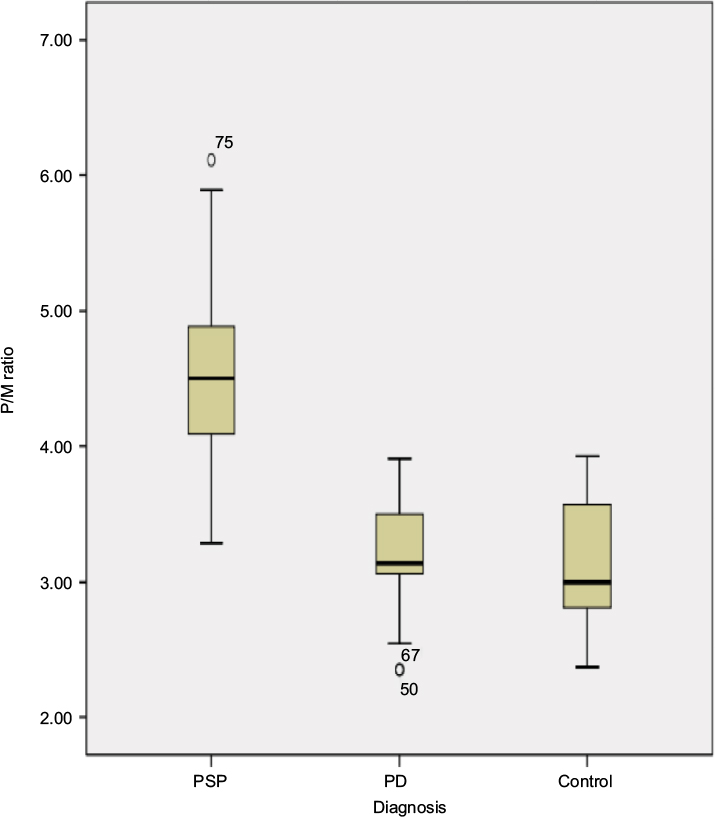 | Figure 2 Box plot of P/M ratio in patients with PSP. Notes: Median is shown as a line across each box, and vertical solid lines (whiskers) show lower and upper values: PSP patients (median =4.50; range, 3.29–6.11), PD patients (median =3.13; range, 2.35–3.91), control participants (median =3.0; range, 2.37–3.93). Abbreviations: P/M, pons area–midbrain area ratio; PD, Parkinson’s disease; PSP, progressive supranuclear palsy. |
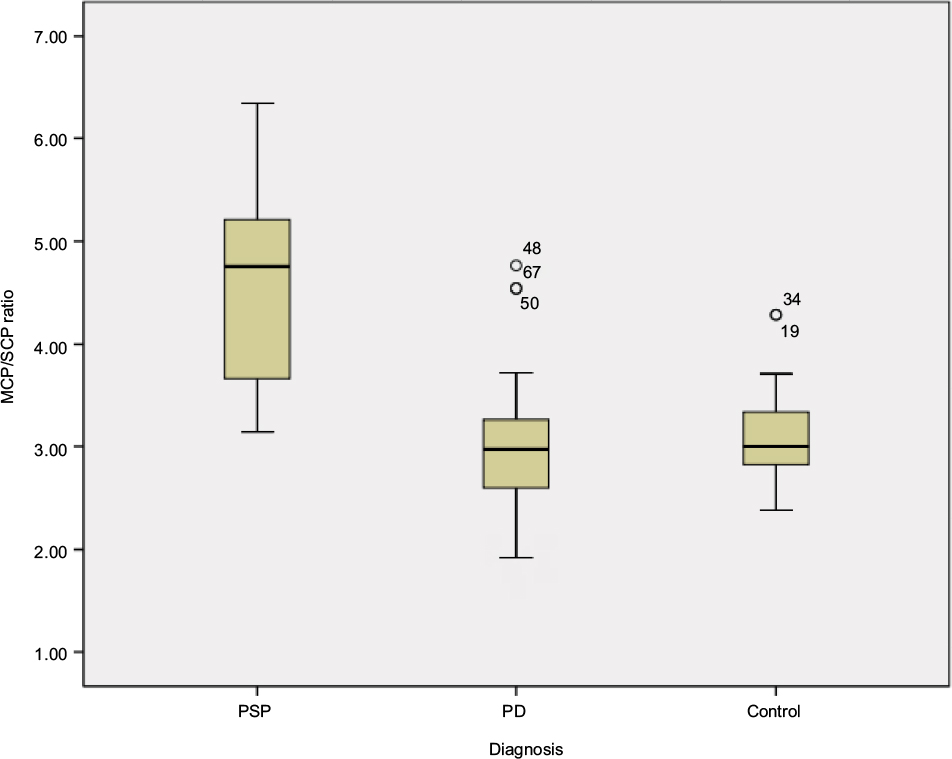 | Figure 3 Box plot of MCP/SCP ratio in PSP patients (median =4.75; range, 3.14–6.35), PD patients (median =2.97; range, 1.92–4.77), control participants (median =3.0; range, 2.38–4.29). Abbreviations: P/M, pons area–midbrain area ratio; PD, Parkinson’s disease; PSP, progressive supranuclear palsy; SCP, superior cerebellar peduncle. |
All obtained measurements showed minor overlap of values between patients with PSP and PD and HC participants. MRPI was significantly higher in PSP patients (mean 21) than PD patients (mean 9.50; P<0.001) and HC participants (mean 9.6; P<0.001), without overlapping of values among groups, as shown in Figure 4. No correlation was found between the duration of disease, PSP rating scale, PSP staging system and MRPI in this study. None of the patients with PSP received a misdiagnosis when this index was applied (sensitivity and specificity, 100%). However, in this study, we found the sensitivity and specificity of MCP/SCP ratio to be 85% and 92.86%, respectively, and that the P/M ratio was 85.71% sensitive in differentiating PSP from PD, but showed more specificity (97.67%) and diagnostic accuracy (87.87%) due to overlapping individual values (Table 3).
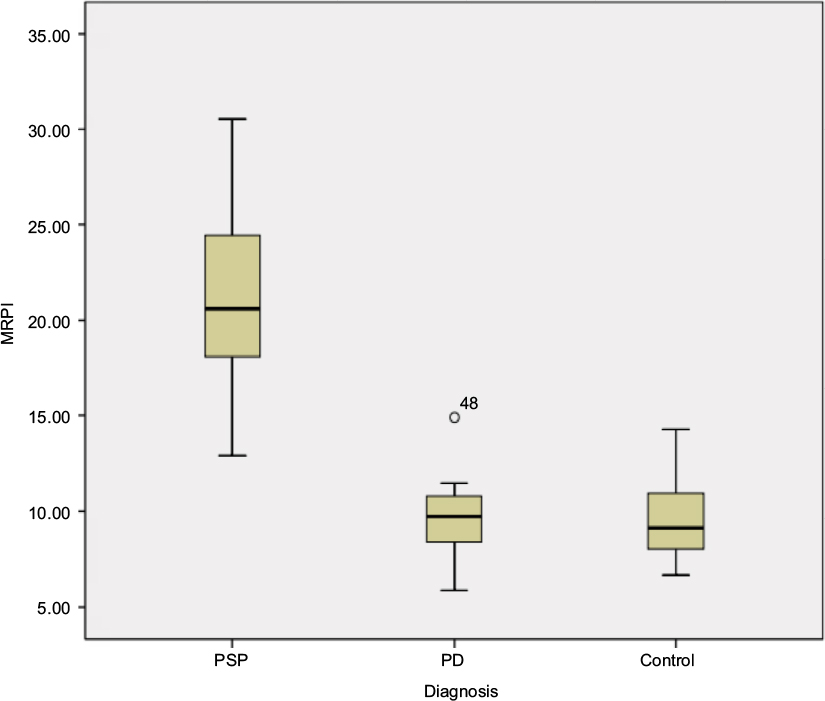 | Figure 4 Box plot of MRPI in PSP patients (median =21; range, 12.92–30.56), PD patients (median =9.5; range, 5.89–14.9), control participants (median =9.6; range, 6.67–14.29). MRPI values are higher in PSP patients compared to PD and HC. Abbreviations: HC, healthy controls; MRPI, Magnetic Resonance Parkinsonism Index; PD, Parkinson’s disease; PSP, progressive supranuclear palsy. |
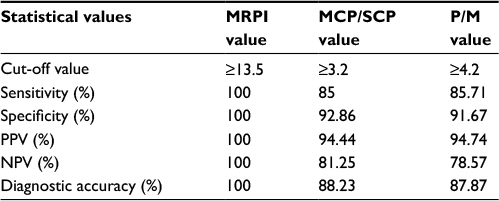 | Table 3 Sensitivity and specificity of MRPI for the differentiation of PSP and PD Abbreviations: MRPI, Magnetic Resonance Parkinsonism Index; NPV, negative predictive value; PD, Parkinson’s disease; P/M, pons area–midbrain area ratio; PPV, positive predictive value; PSP, progressive supranuclear palsy; SCP, superior cerebellar peduncle. |
Pair wise comparative analysis using MRPI values between different groups showed statistical significance (P<0.001) between PD and PSP patients and between PSP patients and HC participants. On the other hand, no statistical significance was found between PD patients and HC participants in pair wise comparison using MRPI values (Table 4).
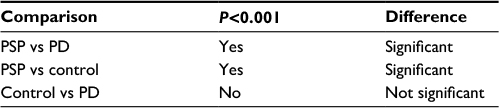 | Table 4 All pairwise multiple comparison procedures taking MRPI values Note: P values were determined with Mann–Whitney U test. Abbreviations: MRPI, Magnetic Resonance Parkinsonism Index; PD, Parkinson’s disease; PSP, progressive supranuclear palsy. |
Discussion
Among the neurodegenerative parkinsonian disorders, PSP is the second most common after idiopathic Parkinson’s disease.2 Since levodopa responsiveness is poor and clinical deterioration is faster in PSP, it is important to be able to differentiate between idiopathic Parkinson’s disease and PSP.12 It has been suggested that MR measurements of several brainstem structures could overcome the limitations inherent in the clinical diagnostic criteria for PSP.8,12,13
In addition, quantitative measurements of brainstem structures have been reported to be useful in differentiating patients with PSP from those with PD.19 Different brainstem measurements include P/M and MCP/SCP ratios; however, one study demonstrated that MRPI was more accurate than P/M in differentiating patients with possible PSP from those with PD and, as we have discussed earlier, that MRPI is calculated by the formula ([P/M]×[MCP/SCP]).8,20
Recent studies have shown extensive research work on MRPI, and a new automatic method for calculating the MRPI is formulated based on automatic algorithm, which helps in the early diagnosis of PSP with less time and more accuracy.21
In a very interesting study, the researchers have compared morphometric markers (midbrain area, pons to midbrain area ratio and MRPI) with Diffusion Tensor Imaging parameters (infratentorial structures) and volumetric analysis (thalamus, putamen and pallidus nuclei), and surprisingly found that the morphometric assessment is the best single diagnostic marker and should be routinely included in the neuroradiologic work-up of parkinsonian patients.22
The role of quantitative MRI in vascular parkinsonism was also analyzed by several studies, which revealed MRPI may represent an accurate tool in differentiating PSP from vascular parkinsonism, however, it is not discussed in detail in this article.23
The role of regional distribution of white matter damage by using Diffusion Tensor Imaging also improves the diagnostic accuracy of MRI in the diagnosis of supranuclear palsy, not independently, but only in combination with MRPI.24
In this study, we analyzed those neural structures that were primarily involved in PSP, in order to differentiate them from others. Atrophy of midbrain is the typical pathologic finding in PSP patients.10 Neuroimaging findings15,16 confirmed the diagnostic value of presence of midbrain atrophy in PSP patients and concluded that measurement of midbrain area could help in differentiation of PSP patients from PD patients. Our findings, however, reveal that measurement of midbrain area is unsuccessful to aid in distinction, on an individual basis, of patients with PSP from PD. In this study, the average midbrain area of PSP patients was significantly smaller than those of PD cases and HC participants, but individual values of midbrain area overlapped significantly with others.
MRPI is significantly higher in PSP patients than in HCs and PD cases. MRPI is proposed to distinguish PSP from PD on an individual basis. MRPI had a very high sensitivity, specificity and positive predictive value, when a cut-off of 13.5 was taken to discriminate rest of parkinsonian disorders from PSP.9,25
In this study, PSP had a mean MRPI of 21; on the other hand, the mean MRPI was 9.6 in HC and 9.5 in PD. The mean age at onset of the disease was 66.76 years, which is comparable to earlier studies. The average disease duration was found to be 6.6 years. Other studies have found a higher age at examination and longer disease duration. Therefore, MRPI can be helpful in differentiating PSP from PD in the early stages of the disease.25–27 However, further studies should be performed with large number of patients to obtain more reliable figures.
In this study, the midbrain area in PSP (mean 96.02 mm2) was significantly less than in PD (mean 145.58 mm2) and HC (mean 149.41 mm2). The individual values of midbrain area overlapped with other groups, making the differentiation difficult on an individual basis. This study also revealed slightly reduced mean pons area in PSP (430.73 mm2) than in PD (455.29 mm2). Our results were fairly comparable with the findings of previous international studies.25,28,29
The mean SCP width in PSP was 2.81 mm, which was remarkably less than those of PD (4.33 mm) and HC (4.36 mm) subjects. Based on previous studies, mean SCP width <3 mm is thought to be associated with PSP. We did not find considerable difference in mean SCP width in PD and HC. Similarly, due to overlapping of individual values, SCP width could not differentiate PSP from other groups on an individual basis.9,15,25,29
Our data also suggest that mean MCP width in PSP (12.78 mm) was smaller than those of PD (12.81 mm) and HC (13.4 mm), but with a minor difference. Comparable results were observed in the data from previous studies.9,25,28,29
Comparing the MRPI values of our study and previous studies, MRPI of 21.4 was calculated by Morelli et al,25 20.7 by Longoni et al,29 18.63 by Hussl et al,31 24.56 by Quattrone et al9 and 23.48 by Sankhla et al.30 In this study, mean MRPI was 21 in PSP, 9.5 in patients with PD and 9.6 in HC, a finding that is supportive with the results of other studies.9,25,29,31
As mentioned earlier, single brain measurements are unable to aid in differentiating PSP from other groups; rather, combined assessment of all four brain structures involved in this neurodegenerative process is proven to be more helpful. Single measurement of P/M ratio can differentiate PSP from PD and HCs in some cases9,15 The mean P/M ratio in PSP (4.54) was significantly higher than PD (3.18) and HC (3.08), with the values overlapping in individual cases. Overlapping of values between the PSP and other groups was also encountered in Morelli et al’s study.25
We found, MRPI as 100% sensitive, specific and accurate in distinguishing PSP from PD, when a cut-off level of 13.5 was used. Our results showed higher statistical values than previous studies that also showed close to 90% sensitivity and specificity.
Morelli et al also reported that P/M ratio was unsuccessful to distinguish PSP from PD on an individual basis. They found a relatively higher sensitivity of 92.9%, but lower specificity, and diagnostic accuracy of 85.3% and 86.8%, respectively.25 Hussl et al also reported relatively low sensitivity and diagnostic accuracy for the same.1,31
Correlation between MRPI and the disease duration was found by some researches,9,25 but we did not find any correlation of MRPI values with disease duration.
MRPI improved the diagnostic accuracy much more than that seen with the use of P/M ratio in discriminating PSP from PD because of the combined assessment of four brain structures involved in neurodegenerative disorders. Thus, atrophy of midbrain and SCP suggested the presence of PSP. These brain structures are usually not involved in PD. However, calculation of MRPI is more time consuming than calculation of the P/M ratio because it involves measurement of additional brain structures.
Our limitations were that we used clinical criteria for the diagnosis of PSP and we did not have a pathologic confirmation. Thus, it is likely that in some patients, the clinical diagnosis may be inaccurate. However, sensitivity and specificity of clinical diagnostic criteria for PSP are well documented, so the chances are unlikely. However, it is an important consideration that so far MRI brain is not a complete substitution for clinical and neuropathologic assessment. Thus, clinicians need to be acquainted with the diagnostic criteria for PSP and be sufficiently aware of the application of this method in patients’ clinical context.
Conclusion
In cases of clinically unclassifiable parkinsonism, MRPI is a reliable and accurate marker to predict the presence of PSP. In comparison to individual measurements such as midbrain to pons ratio or SCP to middle cerebellar peduncle ratio, it has superior diagnostic value as it accounts both measurements. It is also more reliable in early detection and can predict the disease on an individual basis without overlap.
Disclosure
The authors report no conflicts of interest in this work.
References
Burn DJ LA. Progressive supranuclear palsy: where are we now? Lancet Neurol. 2002;1(6):359–369. | ||
Litvan I, Bhatia K, Burn DJ, et al. Movement disorders society scientific issues committee report: SIC task force appraisal of clinical diagnostic criteria for parkinsonian disorders. Mov Disord. 2003;18(5):467–486. | ||
Litvan I, Agid Y, Calne D, et al. Clinical research criteria for the diagnosis of progressive supranuclear palsy (Steele Richardson-Olszewski syndrome): report of the NINDSSPSP international workshop. Neurology. 1996;47(1):1–9. | ||
Postuma RB, Berg D, Stern M, et al. MDS clinical diagnostic criteria for Parkinson’s disease. Mov Disord. 2015;12(30):1591–1601. | ||
Massey LA, Jager HR, Paviour DC, et al. The midbrain to pons ratio: a simple and specific MRI sign of progressive supranuclear palsy. Neurology. 2013;20(80):1856–1861. | ||
Gama RL, Tavora D, Bomfim RC, Silva CE, Bruin VM, Bruin PF. Morphometry MRI in the differential diagnosis of parkinsonian syndromes. Arq Neuropsiquiatr. 2010;3(68):333–338. | ||
Mascalchi M, Vella A, Ceravolo R. Movement disorders: role of imaging in diagnosis. J Magn Reson Imaging. 2012;35(2):239–256. | ||
Hauw JJ, Daniel S, Dickson D, et al. Preliminary NINDS neuropathologic criteria for Steele–Richardson–Olszewski syndrome (progressive supranuclear palsy). Neurology. 1994;44(11):2015–2019. | ||
Quattrone A, Nicoletti G, Messina D, et al. MR imaging index for differentiation of progressive supranuclear palsy from Parkinson disease and the Parkinson variant of multiple system atrophy. Radiology. 2008;246(1):214–221. | ||
Aiba I, Hashizume Y, Yoshida M, Okuda S, Murakami N, Ujihira N. Relationship between brainstem MRI and pathological findings in progressive supranuclear palsy–study in autopsy cases. J Neurol Sci. 1997;152(2):210–217. | ||
Morelli M, Arabia G, Novellino F, et al. MRI measurements predict PSP in unclassifiable parkinsonisms: a cohort study. Neurology. 2011;77(11):1042–1047. | ||
Hughes AJ, Daniel S, Kilford L, Lees AJ. Accuracy of clinical diagnosis of idiopathic Parkinson’s disease: a clinico-pathological study of 100 cases. J Neurol Neurosurg Psychiatry. 1992;55(3):181–184. | ||
Warmuth-Metz M, Naumann M, Csoti I, Solymosi L. Measurement of the midbrain diameter on routine magnetic resonance imaging: a simple and accurate method of differentiating between Parkinson disease and progressive supranuclear palsy. Arch Neurol. 2001;58(7):1076–1079. | ||
Sung YH, Park KH, Lee YB, et al. Midbrain atrophy in subcortical ischemic vascular dementia. J Neurol. 2009;256(12):1997–2002. | ||
Oba H, Yagishita A, Terada H, et al. New and reliable MRI diagnosis for progressive supranuclear palsy. Neurology. 2005(64):2050–2055. | ||
Kato N, Arai K, Hattori T. Study of the rostral midbrain atrophy in progressive supranuclear palsy. J Neurol Sci. 2003;210(1–2):57–60. | ||
Cosottini M, Ceravolo R, Faggioni L, et al. Assessment of midbrain atrophy in patients with progressive supranuclear palsy with routine magnetic resonance imaging. Acta Neurol Scand. 2007;116(1):37–42. | ||
Righini A, Antonini A, Ferrarini M, et al. Thin section MR study of the basal ganglia in the differential diagnosis between striatonigral degeneration and Parkinson disease. J Comput Assist Tomogr. 2002;26(2):266–271. | ||
Kim BC, Choi SM, Choi KH, et al. MRI measurements of brainstem structures in patients with vascular parkinsonism, progressive supranuclear palsy, and Parkinson’s disease. Neurol Sci. 2017;38(4):627–633. | ||
Nigro S, Morerlli M, Arabia G, et al. Magnetic Resonance Parkinsonism Index and midbrain to pons ratio: which index better distinguishes Progressive Supranuclear Palsy patients with a low degree of diagnostic certainty from patients with Parkinson Disease? Parkinsonism Relat Disord. 2017;41:31–36. | ||
Nigro S, Arabia G, Antonini A, et al. Magnetic Resonance Parkinsonism Index: diagnostic accuracy of a fully automated algorithm in comparison with the manual measurement in a large Italian multicentre study in patients with progressive supranuclear palsy. Eur Radiol. 2017;27(6):2665–2675. | ||
Zanigni S, Calandra-Buonaura G, Manners DN, et al. Accuracy of MR markers for differentiating Progressive Supranuclear Palsy from Parkinson’s disease. Neuroimage Clin. 2016;11:736–742. | ||
Mostile G, Nicoletti A, Cicero CE, et al. Magnetic resonance parkinsonism index in progressive supranuclear palsy and vascular parkinsonism. Neurol Sci. 2016;37(4):591–595. | ||
Agosta F, Pievani M, Svetel M, et al. Diffusion tensor MRI contributes to differentiate Richardson’s syndrome from PSP-parkinsonism. Neurobiol Aging. 2012;33(12):2817–2826. | ||
Morelli M, Arbia G, Salsone M, et al. Accuracy of magnetic resonance parkinsonism index for differentiation of progressive supranuclear palsy from probable or possible Parkinson disease. Mov Disord. 2011;26(3):527–533. | ||
Massey LA, Micallef C, Paviour DC, et al. Conventional magnetic resonance imaging in confirmed progressive supranuclear palsy and multiple system atrophy. Mov Disord. 2012;27(14):1754–1762. | ||
Osaki Y, Ben-Shlomo Y, Lees AJ, et al. Accuracy of clinical diagnosis of progressive supranuclear palsy. Mov Disord. 2004;19(2):181–189. | ||
Morelli M, Arabia G, Messina D, et al. Effect of aging on magnetic resonance measures differentiating progressive supranuclear palsy from Parkinson’s disease. Mov Disord. 2014;29(4):488–495. | ||
Longoni G, Agosta F, Kostić VS, et al. MRI measurements of brainstem structures in patients with Richardson’s syndrome, progressive supranuclear palsy-parkinsonism, and Parkinson’s disease. Mov Disord. 2011;26(2):247–255. | ||
Sankhla CS, Patil K, Sawant N, Gupta S. Diagnostic accuracy of Magnetic Resonance Parkinsonism Index in differentiating progressive supranuclear palsy from Parkinson’s disease and controls in Indian patients. Neurol India. 2016;64(2):239–245. | ||
Hussl A, Mahlknecht P, Scherfler C, et al. Diagnostic accuracy of the magnetic resonance Parkinsonism index and the midbrain-to-pontine area ratio to differentiate progressive supranuclear palsy from Parkinson’s disease and the Parkinson variant of multiple system atrophy. Mov Disord. 2010;25(14):2444–2449. |
 © 2017 The Author(s). This work is published and licensed by Dove Medical Press Limited. The full terms of this license are available at https://www.dovepress.com/terms.php and incorporate the Creative Commons Attribution - Non Commercial (unported, v3.0) License.
By accessing the work you hereby accept the Terms. Non-commercial uses of the work are permitted without any further permission from Dove Medical Press Limited, provided the work is properly attributed. For permission for commercial use of this work, please see paragraphs 4.2 and 5 of our Terms.
© 2017 The Author(s). This work is published and licensed by Dove Medical Press Limited. The full terms of this license are available at https://www.dovepress.com/terms.php and incorporate the Creative Commons Attribution - Non Commercial (unported, v3.0) License.
By accessing the work you hereby accept the Terms. Non-commercial uses of the work are permitted without any further permission from Dove Medical Press Limited, provided the work is properly attributed. For permission for commercial use of this work, please see paragraphs 4.2 and 5 of our Terms.