")
Back to Journals » Cancer Management and Research » Volume 13
Role of Bclaf1 in Promoting Adrenocortical Carcinoma Proliferation: A Study Combining the Use of Bioinformatics and Molecular Events
Authors Zhou H , Zou M , Ding X , Zou F
Received 20 April 2021
Accepted for publication 28 July 2021
Published 31 August 2021 Volume 2021:13 Pages 6785—6795
DOI https://doi.org/10.2147/CMAR.S316599
Checked for plagiarism Yes
Review by Single anonymous peer review
Peer reviewer comments 2
Editor who approved publication: Professor Bilikere Dwarakanath
Hui Zhou,1,* Mengchen Zou,2,* Xinyi Ding,1 Fei Zou1
1Department of Occupational Health and Occupational Medicine, School of Public Health, Southern Medical University, Guangzhou, People’s Republic of China; 2Department of Endocrinology and Metabolism, Nanfang Hospital, Southern Medical University, Guangzhou, People’s Republic of China
*These authors contributed equally to this work
Correspondence: Fei Zou
Department of Occupational Health and Occupational Medicine, School of Public Health, Southern Medical University, Guangzhou, 510515, People’s Republic of China
Email [email protected]
Purpose: Adrenocortical carcinoma (ACC) is a rare malignancy with poor prognosis, and researchers are interested in further studying its diagnosis and treatment. Our study aims to identify new potential therapeutic targets in ACC.
Patients and Methods: The core genes CDK1 and CCNB1 were previously screened using ACC data from The Cancer Genome Atlas (TCGA) as the most relevant to Bclaf1 and tumour prognosis. We used siRNA- or shRNA-based models to explore the role of Bcl-2-associated transcription factor 1 (Bclaf1) in SW-13 cell lines. Western blotting and qPCR were used to determine the effects of Bclaf1 on CDK1 and Cyclin B1.
Results: Based on biological information analysis, we found that Bcl-2-associated transcription factor 1 (Bclaf1) affected the progression of ACC and was associated with the cell cycle. Downregulated Bclaf1 expression inhibited the proliferation of SW-13 cells and affected the cell cycle process of SW-13 cells. BCLAF1 was correlated with CDK1 and CCNB1 and can regulate their mRNA and protein levels.
Conclusion: Bclaf1 might promote the development of ACC by regulating CDK1 and Cyclin B1 to drive mitosis.
Keywords: prognostic and predictive value, therapeutic targets, Bcl-2-associated transcription factor 1
Introduction
The available treatments for adrenocortical carcinoma (ACC) are limited, and among them, surgical resection is basically the only curative option.1,2 Nevertheless, up to 85% of patients who undergo radical resection exhibit poor outcomes, such as local disease recurrence and concurrent metastases.3–6 Not surprisingly, the prognosis of ACC is poor; the 5-year overall survival (OS) rate is only 38%.7
Therefore, the accurate identification of adrenal carcinoma at an early stage of the disease8,9 and understanding the mechanism of ACC are particularly urgent for exploring new drug targets.
The Oncomine database indicates that Bcl-2-associated transcription factor 1 (Bclaf1) mRNA is more highly expressed in ACC than in normal tissues. The Cancer Genome Atlas (TCGA) provides a gene map of human cancer and contains an abundant amount of complete clinical follow-up information.10,11 Our study aimed to identify core genes associated with BCLAF1 by analysing the TCGA database. G2/mitotic-specific cyclin B1 (Cyclin B1) and cyclin-dependent kinase 1 (CDK1) play important roles in controlling the transition of cells from the G2 phase to the M phase, which is a key event in the initiation of mitosis,12,13 and their disorder can lead to uncontrolled cell proliferation and contribute to the development of tumours.14 Previous studies have explored CDK1 and Cyclin B1 as drug targets.15
Bclaf1 is a powerful molecule that influences mRNA transcription and splicing to participate in tumour progression16,17 and might be a new target of CDK1 inhibitors. In our previous research, we found that Bclaf1 promotes the proliferation and clonal formation of hepatocellular carcinoma (HCC) cell lines.18 Thus, the mechanism through which Bclaf1 affects ACC remains unclear. Based on an analysis of RNA sequencing (RNA-seq) data of TCGA-ACC, we assessed the impact of Bclaf1 on ACC and explored its molecular mechanism.
Materials and Methods
Data Sources
Data retrieved from multiple research centres were used for the integrated analysis performed in this study. The Giordano Adrenal and Giordano Adrenal 2 datasets were selected from the Oncomine database19 (https://www.oncomine.org). The RNA-seq data of patients with ACC from the TCGA database, including data from 76 tumour tissues and the corresponding clinical information, were derived from the Genomic Data Commons (GDC) API (https://portal.gdc.cancer.gov), and samples with duplicated TCGA barcodes and incomplete survival data were excluded. GSE10927 and GSE90713 were then downloaded from the National Center for Biotechnology Information (NCBI) Gene Expression Omnibus (GEO) database. We used Gene Expression Profiling Interactive Analysis (GEPIA)20 to conduct a series of online analyses, including box plots and survival analysis. ChIP-seq data were acquired from the Cistrome Data Browser (http://cistrome.org).
Gene Expression Analysis
For the RNA-seq data, the expression levels of mRNA were computed as fragments per kilobase per million (FPKM). After transcripts per million (TPM) transformation, the median value of BCLAF1 expression was used to divide the patients into BCLAF1high and BCLAF1low groups. Using R language (limma package, R version 3.6.1), we identified key differentially expressed genes (DEGs) between the BCLAF1high and BCLAF1low groups. Genes with abs(log2(fold-change)) > 1 (absolute value) and a false discovery rate (FDR) < 0.01 were selected as candidate signatures for further analysis. Volcano plots were generated based on the DEGs and drawn using the ggplot2 and pheatmap R packages.
Weighted Gene Co-Expression Network Analysis (WGCNA) and Protein-Protein Interaction (PPI) Network
Gene co-expression network analysis was specifically performed using the R package WGCNA.21 The screened genes were uploaded to the Search Tool of the Retrieval of Interacting Genes/Proteins (STRING) database (http://string-db.org) to construct a PPI network with an upper confidence threshold of 0.400. The results from the STRING analysis were visualized in a degree-attributed circle layout using Cytoscape v.3.7.2 (http://cytoscape.org/).
Gene Set Enrichment Analysis and Receiver Operating Characteristic (ROC) Curve Analysis
WebGestalt22 (http://www.webgestalt.org/) was utilized for the GO and Kyoto Encyclopedia of Genes and Genomes (KEGG) pathway enrichment analyses of genes. ROC curves were analysed by employing the ggplot2 R package, and a Cox proportional hazards model was used to predict the 1–5-year survival states.
Gene Expression Analysis
For the RNA-seq data, the expression levels of mRNA were computed as fragments per kilobase per million (FPKM). After transcripts per million (TPM) transformation, the median value of BCLAF1 expression was used to divide the pa tients into BCLAF1high and BCLAF1low groups. We applied R language (limma package, R version 3.6.1) to identify key differentially expressed genes (DEGs) between the BCLAF1high and BCLAF1low groups. Genes with abs(log2(fold-change)) > 1 (absolute value) and an FDR < 0.01 were selected as candidate signatures for further analysis. Volcano plots were generated based on the DEGs and drawn using the ggplot2 and pheatmap R packages.
Cell Culture
SW-13 (RRID: CVCL_0542) and NCI-H295R (RRID: CVCL_0458) cell lines were purchased from Center for Excellence in Molecular Cell Science, CAS (Shanghai, China). SW-13 were maintained in L-15 medium supplemented with 10% foetal bovine serum (Gibco, USA), 1 mM glutamine, and 100 U/mL penicillin-streptomycin (Solarbio, Beijing, China). NCI-H295R were maintained in special medium for NCI-H295R cells. (Procell, Wuhan, China). The cell lines were authenticated by STR profiling.
Oligonucleotide and Plasmid Transfection and Stable Cell Line Generation
Effective siRNA oligonucleotides that target Bclaf1 were purchased from GenePharma (Suzhou, China). Full-length Bclaf1-overexpressing plasmids were kindly provided by Dr. Tang (College of Veterinary Medicine, China Agricultural University). SW-13 cells were transfected with oligonucleotides or plasmids using Lipofectamine 3000 (Invitrogen, CA, USA) and were harvested for assays 48 h after transfection. The synthesized short hairpin RNAs targeting Bclaf1 (shBclaf1) or nonspecific control RNAs (shNC) were designed and cloned into LV3 lentiviral vectors, which were constructed by GenePharma (Suzhou, China). The siRNA and shRNA sequences are listed in Table S1. SW-13 cell lines stably expressing shBclaf1 or the vector were generated after infection with the lentiviral particles and were selected with 0.8 μg/mL puromycin (MP Biomedicals, USA).
Western Blotting (WB)
The cells were lysed with lysate (KeyGEN, China; KGP2100), and proteins were extracted to measure the protein concentrations with Bradford reagent (Beyotime, China; P0006C). At least 50 μg of sample was then separated in 10% SDS-PAGE gels and transferred onto PVDF membranes (Merck Millipore, Billerica, MA, USA). The antibodies used in the Western blotting assay are detailed in Table S2.
RNA Extraction, Reverse Transcription and Quantitative PCR
RNAiso (Takara, Tokyo, Japan) was used to extract total RNA from SW-13 cells. Total RNA was used for reverse transcription with the Prime Script RT Reagent Kit (Takara). Then, real-time quantitative PCR was performed using SYBR Premix Ex Taq (Takara) on the CFX Maestro sequence detection system (Bio-Rad, Hercules, CA, USA). The relative expression levels were calculated using the 2-ΔΔCT method based on the normalization control β-actin for the SW-13 cell line. The primers for amplification of human genes are presented in Table S1.
Cell Proliferation
To measure cell proliferation, we conducted a series of cell proliferation experiments, including Cell Counting Kit-8 (Dojindo, Tabaru, Mashikimachi, Japan) assays, crystal violet staining, and EdU assays. The experimental methods are described below. After transfection, cells were incubated for 2 h at 37 °C with Cell Counting Kit-8 solution, and the absorbance at 450 nm was measured. For crystal violet staining, 5 × 10³ cells in 2 mL of medium were plated in six-well plates and cultured for 5 days. The cells were then fixed with methanol, stained with 0.1% crystal violet for 15 min and counted. For the EdU assay, immunofluorescence (IF) staining was performed with an EdU kit (RiboBio, Guangzhou, China) according to the manufacturer’s protocol. The results were then quantified with Image-Pro Plus 6.0 software.
Flow Cytometry
To analyse the cell cycle, the cells were trypsinized and fixed in 70% cold ethanol at −20 °C. Prior to flow cytometry, the cells were washed three times in phosphate-buffered saline (PBS) and treated with a final concentration of 0.2 mg/mL RNaseA and 50 μg/mL propidium iodide (PI) for 30 min at 37 °C while protected from light. Flow cytometry was performed with an Accuri C6 Plus flow cytometer (Becton, Dickinson and Company, USA).
Immunohistochemistry (IHC)
Paraffin sections of tissues were subjected to IHC according to the standard protocol (Huayin Health, Guangzhou, China) using primary antibodies against CDK1 (1:100) and Cyclin B1 (1:200). The normalized expression of CDK1 and Cyclin B1 (integrated optical density [IOD]) in tissues was statistically analysed using Image-Pro Plus 6.0.
Statistical Analysis and Other Software
All of the data are presented as the means ± standard deviations (SDs) from at least three independent experiments, and representative results are presented. The differences between groups were analysed by one-way ANOVA, Dunnett’s test, or Student’s t-test, and a simple correlation analysis was performed; all the analyses were performed with SPSS software version 22.0 (IBM, Chicago, IL, USA) and GraphPad Prism 7 software according to the data features. The significance level was set to p < 0.05. To identify the potential function of Bclaf1, GSEA was performed using GSEA v4.0.3 software.
Results
WGCNA Revealed That the Turquoise Gene Modules Were Related to Tumour Prognosis and the Expression of Bclaf1
Current situation should be considered with caution, as several of the patients were diagnosed with late-stage adrenal adenocarcinoma with distant metastasis in our hospital. Unfortunately, they had lost their best chance of surgical treatment by the time of diagnosis. Therefore, we aimed to explore this rare and highly malignant tumour. In the Giordano Adrenal 2 dataset from the Oncomine database, BCLAF1 was more highly expressed in ACC tissues (29 cases) than in normal tissues (Figure S1A). OS or disease-free survival (DFS) analysis performed using the GEPIA database revealed that high BCLAF1 expression in patients was significantly correlated with poor prognosis (Figure S1B and C). To further explore the role of Bclaf1, we used the median value of BCLAF1 expression obtained from an analysis of the TCGA dataset and divided the patients into BCLAF1high and BCLAF1low groups. Atotal of 2323 differentially expressed genes (DEGs) were identified from the comparison of the BCLAF1high group with the BCLAF1low group (Figure S1D). We then used the DEGs to construct gene co-expression networks using WGCNA based on complete clinical information from the TCGA database. After performing clustering, we excluded outliers (Figure S1E) and obtained 65 ACC samples. Several clinical traits of each sample are shown in the heat map, including age, sex, TNM stage classification, OS, and progress free survival (PFS) (Figure1A). To explore the relationship between BCLAF1 and each module, we used the mRNA expression level of BCLAF1 as characterization information to construct aWGCNA. Six was subsequently selected as the soft thresholding power (Figure S1F), and the correlated modules (r < 0.25) were then merged (Figure S1G and H). According to their co-expression relationships, we identified 14 modules and revealed their relevant clinical traits (Figure1B). The correlation coefficients (r) and pvalues are illustrated in aheatmap. Anegative correlation between turquoise gene modules and survival time (r=−0.46) indicated that the turquoise gene modules were strongly correlated with the prognosis of ACC. We found that BCLAF1 is closely related to the turquoise gene modules (r=0.53), which indicates that BCLAF1 plays an important role in the genetic mapping changes that lead to the prognosis of ACC.
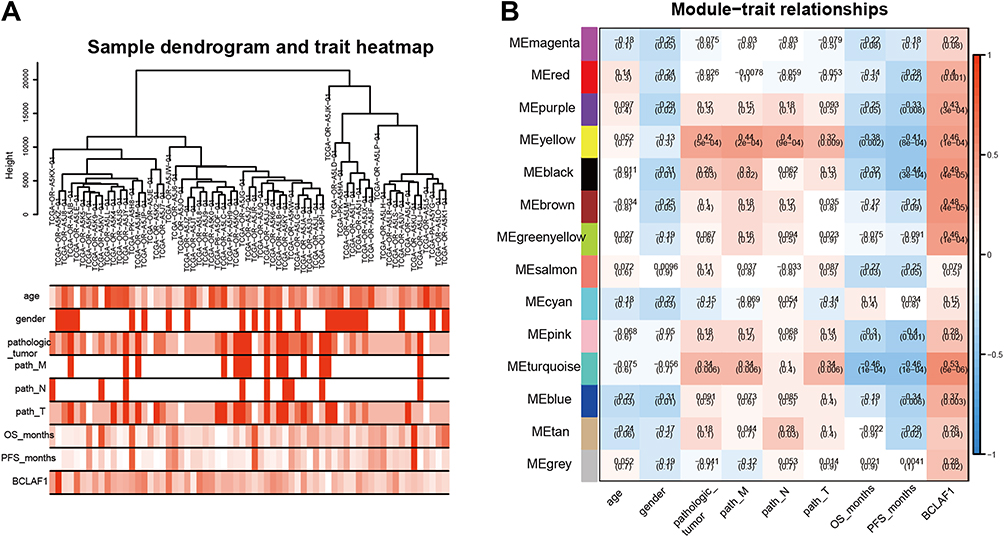 |
Figure 1 Identification of gene module related to Bclaf1. (A) Clustering of samples based on the gene expression (upper panel) and baseline characteristics of each sample was described by a heat map (lower panels). Deeper one refers to higher levels of clinical traits. The TNM staging system classifies tumours by using the tumour (T), lymph node (N), and metastasis (M) attributes, where “T” refers to the extent of the primary tumour (T) and “N” and “M” describe the absence or presence of lymph node(s) and distant metastasis, respectively. (B) Heatmaps of the correlations between different gene modules and clinical traits. Each cell contains the corresponding correlation and p-value. The colour of the right axis depicts the correlation coefficients of each cell. |
Bclaf1 Plays an Important Role in the Proliferation of ACC
To further underscore the biological role of Bclaf1 in ACC, two cell lines were used as an ACC model for the in vitro experiments. We knocked down (siBclaf1) and overexpressed Bclaf1 with a plasmid expressing the Bclaf1-encoding gene (FL) in cells using cell transfection techniques. The transfection efficiency was determined by Western blotting (Figure 2A and B). The downregulation of Bclaf1 by siRNA transfection reduced the proliferative capacity of NCI-295R cells in comparison with that of siRNA control cells (Figure S1I). For SW-13 cells, cell lines with stable knockdown of Bclaf1 were constructed (Figure S2A). In addition, the effect of si Bclaf1 and sh-Bclaf1 on SW-13 cell proliferation was the same as that on NCI-295R (Figure S2B). The inhibition of Bclaf1 expression reduced the growth rate and DNA replication activity of NCI-295R cells, whereas transient transfection with a plasmid expressing the Bclaf1-encoding gene (FL) yielded the opposite results (Figure 2C and D). Consistent data were obtained for the SW-13 cell line (Figure 2E and F). These results indicate that Bclaf1 might be an important molecule that promote tumour proliferation of ACC, as shown in Figure 2.
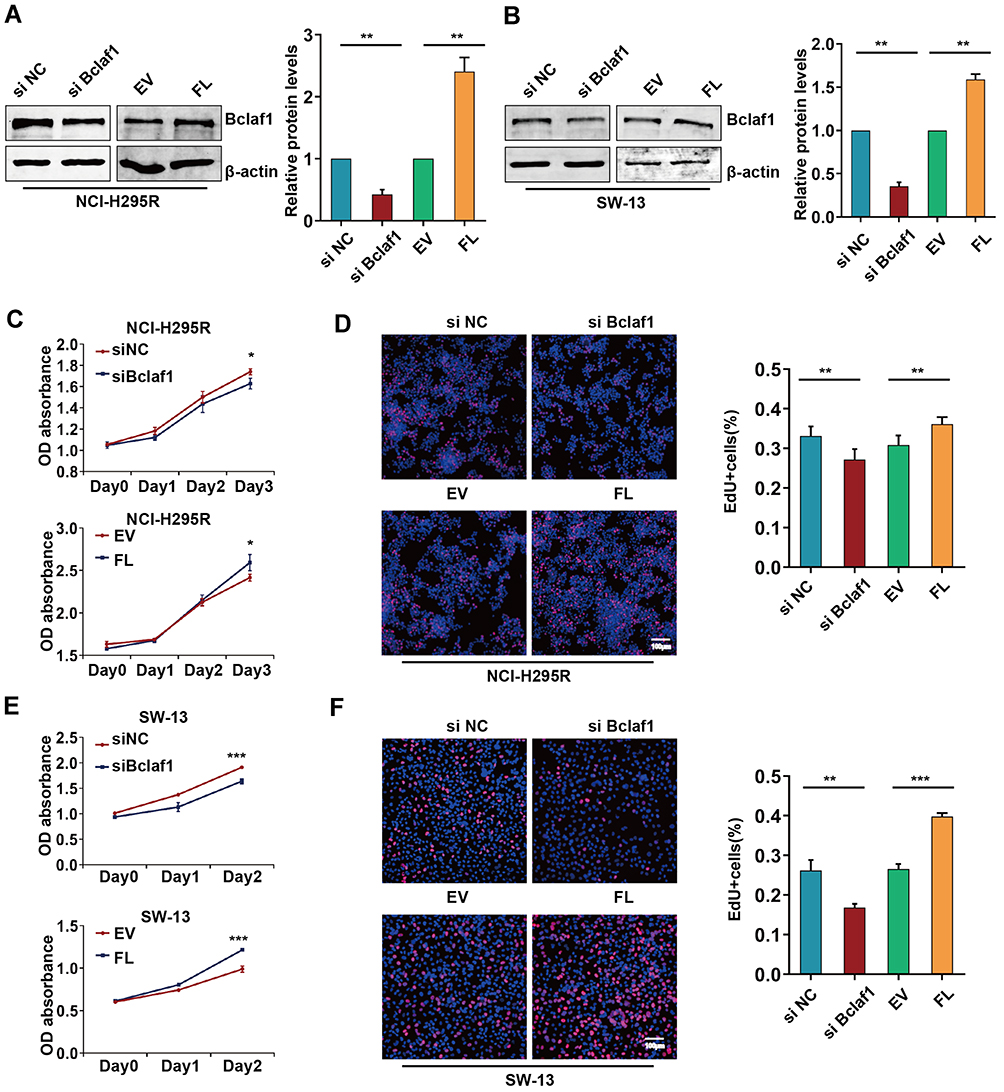 |
Figure 2 Effect of Bclaf1 on the proliferation of ACC cells. (A and B) Bclaf1 was downregulated and overexpressed by cell transfection. (C and E) The proliferation of NCI-H295R and SW-13 cells transfected as described above was determined by CCK-8 assay. (D and F) Cell proliferation following transfection was assessed by EdU IF staining. *p < 0.05, **p < 0.01, and ***p < 0.001 vs the control. |
Bclaf1 Contributes to Cell Cycle Progression in ACC
To determine the functions related to the DEGs, we performed an enrichment analysis using WebGestalt. A KEGG analysis revealed that BCLAF1high-specific genes were mainly involved in signalling pathways such as the cell cycle (Figure 3A). Notably, a GO analysis demonstrated that the mitotic cell cycle phase transition BP (Figure 3B) was significantly associated with the genes identified from the BCLAF1high samples. Furthermore, we performed GSEA to detect pathways connected with BCLAF1. Various gene sets were found to be upregulated in samples from patients with high BCLAF1 expression, and these included genes related to the mitotic spindle and G2/M checkpoint (Figure 3C–F). The results from the analysis of the GSE10927 dataset also showed that the expression level of BCLAF1 was correlated with the mitotic rate of tumours (Figure S2C). To further confirm the results from the bioinformatics analysis, we performed a cell cycle assay based on flow cytometry. More NCI-295R cells were arrested at the G2/M phase after cotreatment with siRNA transfection than after control treatment, whereas overexpressed Bclaf1 had the opposite effect (Figure 3G). Consistent data were obtained for the SW-13 cell line (Figure 3H). Based on the above-mentioned results, we surprisingly found that BCLAF1 in ACC is positively correlated with the cell cycle.
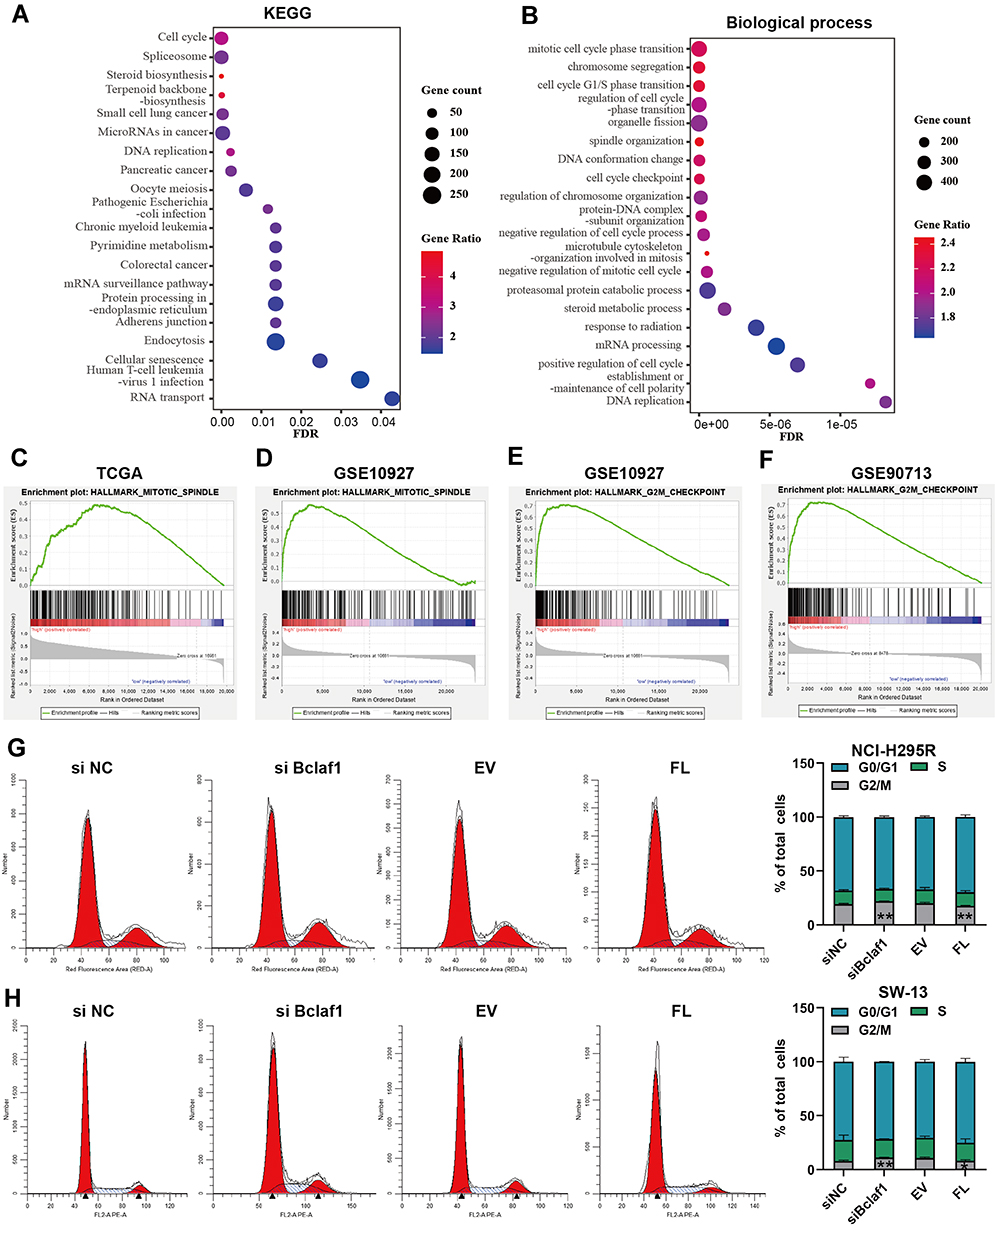 |
Figure 3 Bclaf1 is involved in cell cycle progression. (A and B) KEGG (A) pathway enrichment analysis and GO biological process analysis (B) of BCLAF1high- and BCLAF1low-specific mRNA expression. Screening was conducted at FDR < 0.05. (C–F) GSEA plot; several key pathways, including the mitotic spindle and G2/M checkpoint, which are related to the cell cycle, were visualized. Parameters: p-value < 0.05, FDR q-value < 0.25. (G and H) Images of the cell cycle results (left panels) and stacked bar charts (right panels) of the cell cycle phase distribution of SW-13 cells. *p < 0.05 and **p < 0.01 vs the control. |
CCNB1 and CDK1 are the Key Genes in the Turquoise Module That Correlate with Bclaf1
We then paid close attention to the meaningful clinical information (r > 0.4) in Figure 1B, including pathological tumour, OS (in months), and disease-free survival (PFS, in months). After overlapping these factors (Figure S2D), we identified 53 genes with the following criteria: module membership > 0.8, gene significance of pathological tumour > 0.2, and p value < 0.01. We further explored the prognostic value of these 53 genes by combining them to predict their impact on OS using R. We used Cox proportional hazards regression to analyse the risk of the patients based on the expression of the above-mentioned 53 genes and then divided the patients into high- and low-risk groups. The relationship between gene expression and patient risk score is plotted in Figure S2E. As seen from the figure, the high-risk group was on the right side of the figure and correspondingly had poor survival status and high gene expression. An ROC curve analysis revealed that these 53 genes were valuable with an AUC value of 1 to predict the survival status of patients after years of follow-up (Figure S2F). The survival curve indicated that high-risk patients had a poor prognosis (Figure 2G). These data demonstrated that BCLAF1high-specific genes are associated with the prognosis of ACC.
To identify highly connected hub genes among these 53 genes, we also constructed a PPI network of these 53 genes and sorted them by degree to evaluate the number of edges to which nodes were connected. CCNB1 was identified as the hub gene with the highest degree (Figure S3A), and CDK1 exhibited a high degree. This result was consistent with the scatter diagram (Figure 4A–C), in which we focused on the genes in the top right corner of the plot because these were correlated with both clinical traits and module membership. CCNB1 has been reported to affect the cell cycle together with CDK1.23,24 Importantly, OS or DFS analysis performed using the GEPIA database revealed that high expression of these two genes in patients was significantly correlated with poor prognosis (Figure S3B and C). To compare gene expression in different pathological types, we performed differential analysis by GEPIA, as shown in Figure S3D and E. CDK1 and CCNB1 were more highly expressed in ACC tissues than in normal tissues. We then used the Oncomine database for further verification (Figure S3F and G). Microarray-based IHC data, which included 10 ACC specimens, eight ACA specimens and four normal specimens, also confirmed higher levels of these two proteins in ACC tissues than in ACA and normal tissues, as illustrated in Figure 4D. These data suggest that CDK1 and CCNB1 are the hub genes among the BCLAF1high-specific genes and is highly expressed in tumour tissue.
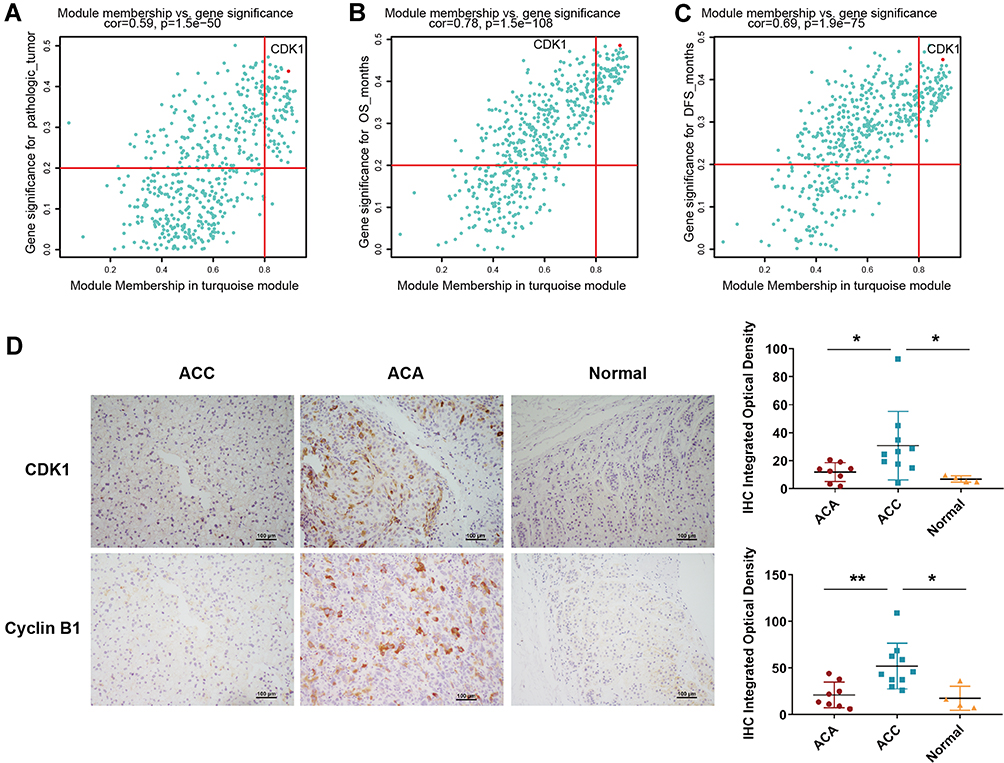 |
Figure 4 CCNB1 and CDK1 are the key genes in the turquoise module. (A–C) Significance of the genes in the turquoise module for three clinical characteristics. The significant genes were identified based on module membership > 0.8 and gene significance > 0.2. (D) Representative images of IHC staining of CDK1 and Cyclin B1 in different types of tissue specimens; the scale represents 100 μm (left panel). Quantification of protein levels according to IHC integrated optical density in ACC, ACA and normal tissues; *p < 0.05 and **p < 0.01 (right panel). |
Bclaf1 Promotes the Proliferation of ACC by Influencing CDK1 and Cyclin B1
Based on the above-described studies, we focused on two hub genes, CDK1 and CCNB1, which can play important roles in ACC progression and prognosis. By analysing the data from the TCGA and GEO databases, we found that BCLAF1 was linearly correlated with CDK1 and CCNB1 (Figure 5A–C). Consistent with the aforementioned results, we wondered whether Bclaf1 is involved in the cell cycle biological process of ACC by regulating CDK1 and Cyclin B1. We then verified our conjecture through molecular biology experiments with NCI-H295R and SW-13 cells. Consistent with our hypothesis, the abundance of CDK1 and CCNB1 mRNA in SW-13 cells significantly decreased after Bclaf1 downregulation (Figure S3H and I), which suggested that Bclaf1 acts on these at the mRNA level. Interestingly, the CDK1 and Cyclin B1 protein levels showed consistent changes: the downregulation of Bclaf1 protein levels by siRNA transfection reduced the protein levels of CDK1 and Cyclin B1, and the overexpression of Bclaf1 after transfection yielded the reverse effect (Figure 5D). For SW-13 cells, the downregulation of Bclaf1 levels by transient siRNA transfection or stable shRNA transfection reduced the levels of key proteins of the cell cycle (Figure 5E). Taken together, these findings support the hypothesis that Bclaf1 promote tumour proliferation and cell cycle transition by participating in the regulation of CDK1 and Cyclin B1.
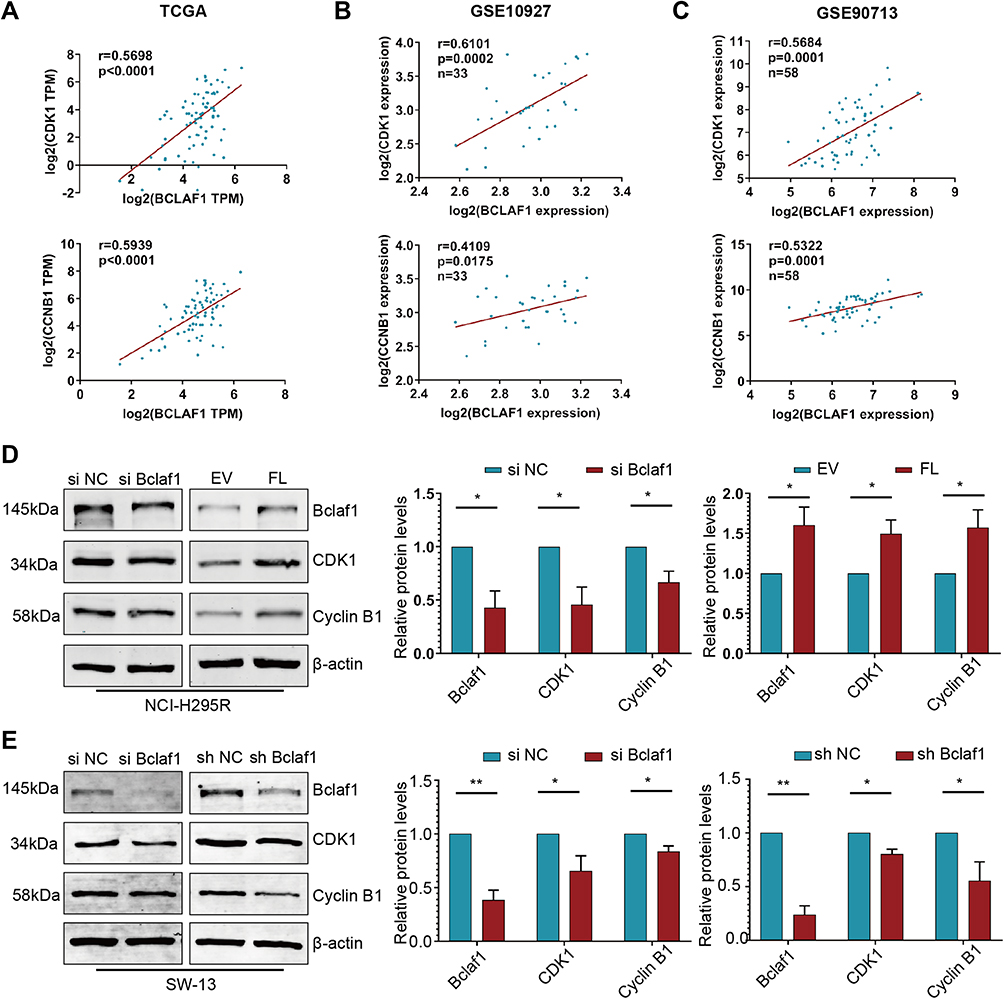 |
Figure 5 Bclaf1 promotes the proliferation of ACC by modulating CDK1 and Cyclin B1. (A–C) Correlation plots showing positive associations between Bclaf1 expression and the expression of CDK1 or CCNB1. Pearson correlation coefficient r values and p-values are shown. (D and E) Regulation of CDK1 and CCNB1 via Bclaf1 knockdown or overexpressed after cell transfection. The protein levels were detected by Western blotting (right panel). *p < 0.05 and **p < 0.01 vs the control. |
Discussion
Although ACC is a rare disease, it tends to progress rapidly and relapse easily and is thus associated with a poor prognosis. This study explores strategies for enabling ACC patients to receive accurate effective treatment as early as possible.
It is difficult to conduct prospective cohort studies or cross-sectional studies and even harder to conduct clinical trials because there are a limited number of ACC patients, and they are not easy to recruit. Fortunately, combining complete clinical follow-up information, we built a bridge using bioinformatics methods between macroscopic disease occurrence and microscopic molecular events to begin our study, which is the beginning consistent with the objective clinical reality.
Through a bioinformatics analysis, we found an association between BCLAF1 and CDK1. We identified the critical CDK1 and CCNB1 genes related to the development of ACC, which is in line with other strategic bioinformatics research results.25
The current treatment for ACC is mainly early surgical treatment with mitotane adjuvant therapy to prevent recurrence.1,2 Radiotherapy combined with chemotherapy is often selected after metastasis for patients with advanced disease,26 and the overall treatment plan is limited, particularly because the effect of treatment on patients with advanced disease is not good. CDK1 is a key protein regulating the cell cycle, whereas cyclin B1 binds to CDK1 to drive mitosis and promote cell passage through the M phase.23,24 Therefore, CDK1 has long been considered a good target for drug development against tumours and other proliferative disorders. Present studies show that CDK1 is part of the extensive cyclin protein family, and the selectivity and specificity of ATP-competitive CDK inhibitors are not ideal.15 Although some compounds have significant preclinical effects, their development and application are limited. It is thought that improving the selectivity of CDK1 inhibitors through further research might be key to their successful development. Many new approaches for CDK1 inhibitors have emerged recently.27
Interestingly, the experimental data investigated in this study demonstrated that Bclaf1 influences the cell cycle in ACC and participates in the regulation of CDK1 and cyclin B1 specifically through gene regulation. Bclaf1 is a promising prospective drug target for ACC. Furthermore, Bclaf1 is a powerful molecule that can both affect the proliferation of cancer cells and regulate the transcription of Hif1α,17 as indicated in our previous research. The cell adhesion molecule binding molecular function (Figure S4A) and the chromosomal region cellular component (Figure S4B) were significantly associated with the genes identified in BCLAF1high samples. Using the Cistrome Data Browser, we found that the binding of Bclaf1 to the promoter regions of CDK1 and CCNB1, particularly that of CDK1, shows strong specificity (Figure S4C and D). Bclaf1 might promptly adjust the transcription of CDK1 and CCNB1. Although this molecule might thus be a new potential therapeutic target of ACC, further work is needed to thoroughly interpret the molecular mechanism. Further confirmation is needed in in vivo and in vitro trials related to treatment.
Conclusions
In conclusion, the disease burden of ACC cannot be ignored. Our study indicated that tumour proliferation and cell cycle transition are influenced by Bclaf1, which has been shown to be involved in the regulation of CDK1 and Cyclin B1.
Abbreviations
ACA, adrenocortical adenoma; ACC, adrenocortical carcinoma; BP, biological process; CC, cellular component; DEGs, differentially expressed genes; DFS, disease-free survival; GO, Gene Ontology; GSEA, gene set enrichment analysis; KEGG, Kyoto Encyclopedia of Genes and Genomes; MF, molecular function; OS, overall survival; PFS, progress-free survival; PPI, protein-protein interaction; ROC, receiver operating characteristic; TCGA, The Cancer Genome Atlas; WGCNA, weighted gene co-expression network analysis.
Data Sharing Statement
Data are available in the publications cited in the manuscript.
Ethics Approval and Informed Consent
Samples were collected with the informed consent of patients under a protocol approved by the ethics committee of Yichang Second People’s Hospital (Hubei, China). This study was conducted in accordance with the Declaration of Helsinki.
Acknowledgments
We would like to thank the kind gifts of plasmid from Prof. J. Tang (China Agricultural University, China). We also thank all the patients who were involved in this study.
Funding
This research was supported by grants from the National Natural Science Foundation of China (NSFC): Nos. 81971783 to Fei Zou.
Disclosure
The authors declare that they have no competing of interests.
References
1. Fassnacht M, Assie G, Baudin E, et al. Adrenocortical carcinomas and malignant phaeochromocytomas: ESMO-EURACAN clinical practice guidelines for diagnosis, treatment and follow-up. Ann Oncol. 2020;31(11):1476–1490. doi:10.1016/j.annonc.2020.08.2099
2. Fassnacht M, Dekkers OM, Else T, et al. European society of endocrinology clinical practice guidelines on the management of adrenocortical carcinoma in adults, in collaboration with the European network for the study of adrenal tumors. Eur J Endocrinol. 2018;179(4):G1–G46.
3. Bellantone R, Ferrante A, Boscherini M, et al. Role of reoperation in recurrence of adrenal cortical carcinoma: results from 188 cases collected in the Italian national registry for adrenal cortical carcinoma. Surgery. 1997;122(6):1212–1218. doi:10.1016/S0039-6060(97)90229-4
4. Kerkhofs TM, Verhoeven RH, Van der Zwan JM, et al. Adrenocortical carcinoma: a population-based study on incidence and survival in the Netherlands since 1993. Eur J Cancer. 2013;49(11):2579–2586. doi:10.1016/j.ejca.2013.02.034
5. Gratian L, Pura J, Dinan M, et al. Treatment patterns and outcomes for patients with adrenocortical carcinoma associated with hospital case volume in the United States. Ann Surg Oncol. 2014;21(11):3509–3514. doi:10.1245/s10434-014-3931-z
6. Tierney JF, Chivukula SV, Poirier J, et al. National treatment practice for adrenocortical carcinoma: have they changed and have we made any progress? J Clin Endocrinol Metab. 2019;104(12):5948–5956. doi:10.1210/jc.2019-00915
7. Tran TB, Postlewait LM, Maithel SK, et al. Actual 10-year survivors following resection of adrenocortical carcinoma. J Surg Oncol. 2016;114(8):971–976. doi:10.1002/jso.24439
8. Schulick RD, Brennan MF. Long-term survival after complete resection and repeat resection in patients with adrenocortical carcinoma. Ann Surg Oncol. 1999;6(8):719–726. doi:10.1007/s10434-999-0719-7
9. Kebebew E, Reiff E, Duh QY, Clark OH, McMillan A. Extent of disease at presentation and outcome for adrenocortical carcinoma: have we made progress? World J Surg. 2006;30(5):872–878. doi:10.1007/s00268-005-0329-x
10. Ding L, Bailey MH, Porta-Pardo E, et al. Perspective on oncogenic processes at the end of the beginning of cancer genomics. Cell. 2018;173(2):305–320.e310.
11. Liu J, Lichtenberg T, Hoadley KA, et al. An integrated TCGA pan-cancer clinical data resource to drive high-quality survival outcome analytics. Cell. 2018;173(2):400–416.e411.
12. Lemmens B, Hegarat N, Akopyan K, et al. DNA replication determines timing of mitosis by restricting CDK1 and PLK1 activation. Mol Cell. 2018;71(1):117–128.e113.
13. Zhang H, Zhang X, Li X, et al. Effect of CCNB1 silencing on cell cycle, senescence, and apoptosis through the p53 signaling pathway in pancreatic cancer. J Cell Physiol. 2018;234(1):619–631. doi:10.1002/jcp.26816
14. Malumbres M, Barbacid M. Cell cycle, CDKs and cancer: a changing paradigm. Nat Rev Cancer. 2009;9(3):153–166. doi:10.1038/nrc2602
15. Asghar U, Witkiewicz AK, Turner NC, Knudsen ES. The history and future of targeting cyclin-dependent kinases in cancer therapy. Nat Rev Drug Discov. 2015;14(2):130–146. doi:10.1038/nrd4504
16. Vohhodina J, Barros EM, Savage AL, et al. The RNA processing factors THRAP3 and BCLAF1 promote the DNA damage response through selective mRNA splicing and nuclear export. Nucleic Acids Res. 2017;45(22):12816–12833. doi:10.1093/nar/gkx1046
17. Wen Y, Zhou X, Lu M, et al. Bclaf1 promotes angiogenesis by regulating HIF-1α transcription in hepatocellular carcinoma. Oncogene. 2019;38(11):1845–1859. doi:10.1038/s41388-018-0552-1
18. Zhou X, Wen Y, Tian Y, et al. Heat shock protein 90α-dependent B-cell-2-associated transcription factor 1 promotes hepatocellular carcinoma proliferation by regulating MYC proto-oncogene c-MYC mRNA stability. Hepatology. 2019;69(4):1564–1581. doi:10.1002/hep.30172
19. Rhodes DR, Kalyana-Sundaram S, Mahavisno V, et al. Oncomine 3.0: genes, pathways, and networks in a collection of 18,000 cancer gene expression profiles. Neoplasia. 2007;9(2):166–180. doi:10.1593/neo.07112
20. Tang Z, Li C, Kang B, Gao G, Li C, Zhang Z. GEPIA: a web server for cancer and normal gene expression profiling and interactive analyses. Nucleic Acids Res. 2017;45(W1):W98–W102. doi:10.1093/nar/gkx247
21. Langfelder P, Horvath S. WGCNA: an R package for weighted correlation network analysis. BMC Bioinform. 2008;9(1):559. doi:10.1186/1471-2105-9-559
22. Liao Y, Wang J, Jaehnig EJ, Shi Z, Zhang B. WebGestalt 2019: gene set analysis toolkit with revamped UIs and APIs. Nucleic Acids Res. 2019;47(W1):W199–W205. doi:10.1093/nar/gkz401
23. Wang Z, Fan M, Candas D, et al. Cyclin B1/Cdk1 coordinates mitochondrial respiration for cell-cycle G2/M progression. Dev Cell. 2014;29(2):217–232. doi:10.1016/j.devcel.2014.03.012
24. Xie B, Wang S, Jiang N, Li JJ. Cyclin B1/CDK1-regulated mitochondrial bioenergetics in cell cycle progression and tumor resistance. Cancer Lett. 2019;443:56–66. doi:10.1016/j.canlet.2018.11.019
25. Guo J, Gu Y, Ma X, et al. Identification of hub genes and pathways in adrenocortical carcinoma by integrated bioinformatic analysis. J Cell Mol Med. 2020;24(8):4428–4438. doi:10.1111/jcmm.15102
26. Kong J, Zheng J, Cai J, et al. A nomogram for individualized estimation of survival among adult patients with adrenocortical carcinoma after surgery: a retrospective analysis and multicenter validation study. Cancer Commun (Lond). 2019;39(1):80. doi:10.1186/s40880-019-0426-0
27. Peyressatre M, Prével C, Pellerano M, Morris MC. Targeting cyclin-dependent kinases in human cancers: from small molecules to peptide inhibitors. Cancers (Basel). 2015;7(1):179–237. doi:10.3390/cancers7010179
 © 2021 The Author(s). This work is published and licensed by Dove Medical Press Limited. The full terms of this license are available at https://www.dovepress.com/terms.php and incorporate the Creative Commons Attribution - Non Commercial (unported, v3.0) License.
By accessing the work you hereby accept the Terms. Non-commercial uses of the work are permitted without any further permission from Dove Medical Press Limited, provided the work is properly attributed. For permission for commercial use of this work, please see paragraphs 4.2 and 5 of our Terms.
© 2021 The Author(s). This work is published and licensed by Dove Medical Press Limited. The full terms of this license are available at https://www.dovepress.com/terms.php and incorporate the Creative Commons Attribution - Non Commercial (unported, v3.0) License.
By accessing the work you hereby accept the Terms. Non-commercial uses of the work are permitted without any further permission from Dove Medical Press Limited, provided the work is properly attributed. For permission for commercial use of this work, please see paragraphs 4.2 and 5 of our Terms.