")
Back to Journals » ClinicoEconomics and Outcomes Research » Volume 14
Robotic-Arm Assisted Total Knee Arthroplasty: Cost Savings Demonstrated at One Year
Authors Ong KL, Coppolecchia A, Chen Z , Watson HN, Jacofsky D, Mont MA
Received 3 February 2022
Accepted for publication 12 April 2022
Published 2 May 2022 Volume 2022:14 Pages 309—318
DOI https://doi.org/10.2147/CEOR.S357112
Checked for plagiarism Yes
Review by Single anonymous peer review
Peer reviewer comments 2
Editor who approved publication: Prof. Dr. Dean Smith
Kevin L Ong,1 Andréa Coppolecchia,2 Zhongming Chen,3 Heather N Watson,4 David Jacofsky,5 Michael A Mont3
1Exponent Inc, Philadelphia, PA, USA; 2Stryker Orthopaedics, Mahwah, NJ, USA; 3Sinai Hospital of Baltimore, Baltimore, MD, USA; 4Exponent Inc, Menlo Park, CA, USA; 5The CORE Institute, Phoenix, AZ, USA
Correspondence: Kevin L Ong, Exponent, Inc, 3440 Market Street, Suite 600, Philadelphia, PA, 19104, USA, Tel +1 215-594-8800, Fax +1 215-594-8899, Email [email protected]
Purpose: Robotic-arm assisted total knee arthroplasty (RATKA) has the potential to enhance radiographic, clinical, and patient-reported outcomes. The purpose of this study was to compare resource utilization, episode-of-care (EOC) costs, readmissions, and complications of robotic-arm assisted total knee arthroplasty (RATKA) and manual TKA (MTKA).
Methods: TKA procedures were identified from a private payer claims database. RATKA procedures required both a robotic arm-assisted procedure code and a 60-day pre-operative computed tomography scan. Propensity score matching (1:5 RATKA to MTKA) was performed, based on various patient characteristics and comorbidities. After matching, 4452 patients (742 RATKA and 3710 MTKA) were analyzed for 90-day and one-year EOC costs, index TKA costs, lengths of stay (LOS), discharge statuses, rehabilitation utilizations, as well as 90-day and one-year readmissions- and knee-related complications.
Results: RATKA patients had shorter LOS (mean 1.56 versus 1.91 days; p < 0.001), lower index costs by $1762 ($32,747 versus $34,509; p = 0.003), and higher discharges to home rates (51.8 versus 47.8%; p = 0.049) than MTKA patients. RATKA patients had less 90-day (68.5 versus 72.0%; p = 0.048) and one-year (70.8 versus 75.0%; p = 0.016) home health utilizations. The RATKA cohort had lower 90-day ($39,260 versus $41,458; p = 0.001) and one-year ($51,462 versus $54,171; p = 0.011) EOC costs. No significant differences in readmission and overall complication rates were observed (p > 0.05).
Conclusion: RATKA was associated with lower index costs and EOC costs at both 90 days and one year. These patients had shorter LOS, were discharged home more frequently, and used less home health services. Cost savings were demonstrated for RATKA beyond the 90-day period with an increase in savings between 90-day and one-year time points. These data may be of importance to payers and providers interested in the longer-term value of RATKA.
Keywords: robotic-arm assisted total knee arthroplasty, cost savings, complications, length of stay
Introduction
The implementation of computed tomography scan (CT)-based 3-dimensional (3-D) modeling operative technologies has been shown to improve upon many peri-operative metrics when compared to manual total knee arthroplasties (TKAs).1–3 Robotic-arm assisted total knee arthroplasty (RATKA) has the potential to enhance clinical, radiographic, and patient-reported outcomes.4–6 Many reports suggest that CT-based TKAs have improved accuracy of bone resections, decreased iatrogenic soft tissue and bone injuries, and increased achievement of desired alignments in all axes.7–14 Although this improved precision is important for implant positioning and survivorship, there has been continuing interest in the relationship of this technology to costs.7–13,15–18
Cost comparisons of RATKA versus manual TKA (MTKA) have shown savings over the 90-day episode-of-care (EOC; all the care that a patient receives during the period of interest) in both Medicare and private payer settings.19–23 Cool and co-authors evaluated 90-day EOC costs associated with RAKTA versus MTKA.19 A total of 519 RATKAs and 2595 MTKAs identified from the Medicare 100% claim files between January 1, 2016 and March 31, 2017 assessed EOC costs, index procedure costs, lengths-of-stay, discharge locations, and rates of readmission. The study showed that the overall EOC costs at 90 days were lower for RATKA by $2391 (p < 0.0001). In addition, even though post-acute services were used by greater than 90% of patients in both groups, RATKA accrued lower costs due to lower readmission rates and discharge locations that were more economically beneficial. Pierce et al investigated 90-day EOC costs for RATKA versus MTKA for patients from a private health plan.20 Similarly, they found that the 90-day mean EOC expenditures (index plus post-surgery) were $4049 less for RATKA patients ($28,204 versus $32,253, p < 0.0001) when compared to MTKA. They also demonstrated that the overall post-surgery costs were $1332 less in the RATKA arm versus MTKA ($6857 versus $8189, p = 0.0018). Furthermore, there was significantly less cost for RATKA patients who used outpatient rehab ($2272 versus $2494, p = 0.0194), and pharmacy ($588 versus $843, p = 0.0057) as compared to MTKA.
Cost evaluations on this topic beyond the 90-day period, however, to the best of our knowledge, have not been evaluated. Therefore, our purpose was to evaluate costs from the payer perspective through one year. Specifically, we assessed: (1) 90-day and one-year EOC costs; (2) costs for the index procedure; (3) discharge statuses for the index procedure; (4) 90-day and one-year rehabilitation utilizations; (5) 90-day and one-year readmissions; and (6) 90-day and one-year complications.
Methods
Study Cohorts
Patients who underwent TKA procedures between March 1, 2016 and December 31, 2018 were identified using a private payer Commercial and Medicare Supplemental claims database (International Business Machines Corporation, Somers, New York) containing claims between 2016 and 2019. The overall MarketScan dataset covers 273 million lives across more than 120 contributing employers, 40 health plans, and 350 unique carriers for employees, spouses, and dependents who are privately insured by employer-sponsored plans. The Commercial database contains data for several million individuals annually. The Medicare Supplemental portion of the data was based on retirees with employer-paid Medicare supplemental insurance, which also includes Medicare-covered and employer-paid portions and out-of-pocket expenses. The dataset also includes claims from the use of inpatient and outpatient services, along with claims for outpatient prescription drugs, which also include those from mail order prescriptions and specialty pharmacies. Each beneficiary in the de-identified dataset has a unique enrollee identifier so that the claims for the same individual can be tracked over time. Real-world evidence research of orthopaedic procedures has been conducted using this dataset.
Both International Classification of Diseases, Tenth Revision, Procedure Coding System (ICD-10-PCS) codes for knee replacement and Diagnosis Related Group codes (ICD-10-CM) for joint replacement were used to identify index TKA procedures (see Supplementary Table 1). Patients were stratified into RATKA and MTKA cohorts. RATKA procedures required both a robotic arm-assisted procedure code and a 60-day pre-operative computed tomography (CT) scan. MTKA procedures did not include either a pre-operative CT scan or a robotic arm-assisted procedure. Patients were excluded using the following criteria: 1) under 18 years of age or over 64 years; 2) did not have continuous enrollment for 60 days prior to index TKA (period used to identify pre-operative CT scans and to evaluate comorbidities); 3) did not have one-year continuous enrollment post-index TKA (follow-up duration); 4) underwent a second TKA or any total hip arthroplasty within one year of the index TKA (potential confounding factors); 5) encountered an in-hospital mortality within one year of the index TKA (follow-up duration); and 6) with coordination of benefits payment for the subject TKA (may contain incorrect costs for the index TKA). Patients with a second TKA on the contralateral knee or any total hip arthroplasty were excluded for the study due to the potential confounding effects of linking the knee-related complications to the post-index TKA rather than the second TKA or a total hip arthroplasty. A total of 93,065 patients who had index TKA were initially identified (Figure 1). Then, a total of 35,101 MTKA and 745 RATKA patients met the inclusion and exclusion criteria. As the distribution of costs is skewed, patients who had outlier costs were further excluded, using a Box-Cox/Yeo-Johnson power transformation with a lambda value to maximize the log likelihood and thresholds based on Tukey’s “far out” values.24–26 The transformation results in a distribution that approximates normality, reducing the skew and enabling exclusion of transformed values considered far out (beyond the outer fence of a box plot, ie, outside Q1–3*IQR to Q3+3*IQR with Q1 being the 25th percentile cost, Q3 being the 75th percentile cost, and IQR being the inter-quartile range). A total of 742 RTKA and 34,939 MTKA patients were available for propensity score matching.
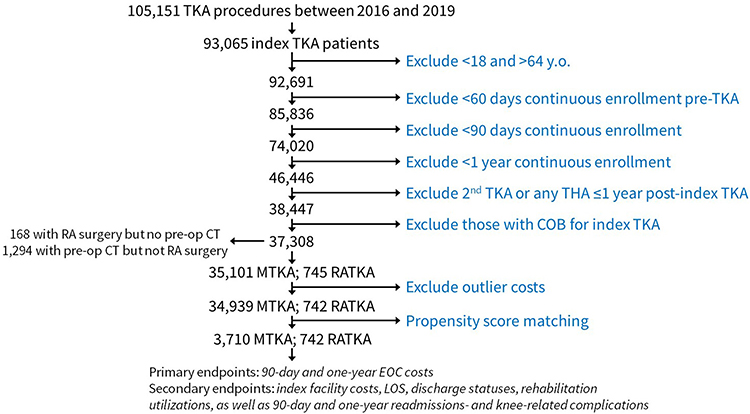 |
Figure 1 Patient selection and disposition. Abbreviations: COB, coordination of benefits; CT, computed tomography; EOC, episode-of-care; LOS, length of stay; MTKA, manual total knee arthroplasty; RA, robotic-arm assisted; RATKA, robotic-arm assisted total knee arthroplasty; THA, total hip arthroplasty; TKA, total knee arthroplasty. |
A nearest neighbor approach was used for propensity score matching with a 1:5 match between RATKA and MTKA cohorts. Propensity scores were calculated based on age, sex, census division, race, year of surgery, and comorbidities. The specific comorbidities considered were smoking, coronary artery disease, hypertension, chronic obstructive pulmonary disease (COPD), diabetes, and obesity. As race was not explicitly provided in the dataset, race in terms of variation was assessed using the relative proportion of non-Caucasian to the overall population of the beneficiary’s location of residence. Since the zip code for the beneficiary was not provided, the beneficiary’s metropolitan statistical area was used when available, otherwise the state was used. The selected comorbidities were identified based on the presence of their respective diagnosis codes (See Supplementary Table 1) within 60 days leading up to the index TKA. After matching, 4452 patients (742 RATKA and 3710 MTKA) were available for analyses.
PS-Matched Patient Characteristics
The majority of the PS-matched patients were women and were 55 to 64 years of age (Supplementary Table 2). Obesity was diagnosed for 39.2% and 40.9% of the RATKA and MTKA cohorts, respectively, while 7.4% of the RATKA and 6.4% of the MTKA cohorts were smokers. Hypertension, diabetes, coronary artery disease, and chronic obstructive pulmonary disease diagnosis rates did not appear to be lower for the RATKA cohorts.
Endpoints
Primary endpoints were 90-day and one-year EOC costs, while secondary endpoints included index facility costs, LOS, discharge statuses, rehabilitation utilizations, as well as 90-day and one-year readmissions- and knee-related complications as described by the Knee Society.27 Examples included, but were not limited to, bleeding, infection, thromboembolic disease, vascular injury, instability, stiffness, fracture, dislocation, and implant loosening (see Table 1). Costs were analyzed from a payer perspective in terms of payments from the health plans to the facilities and healthcare professionals. The 90-day and one-year costs were cumulative, ie, the 90-day costs would also be incorporated into the one-year costs.
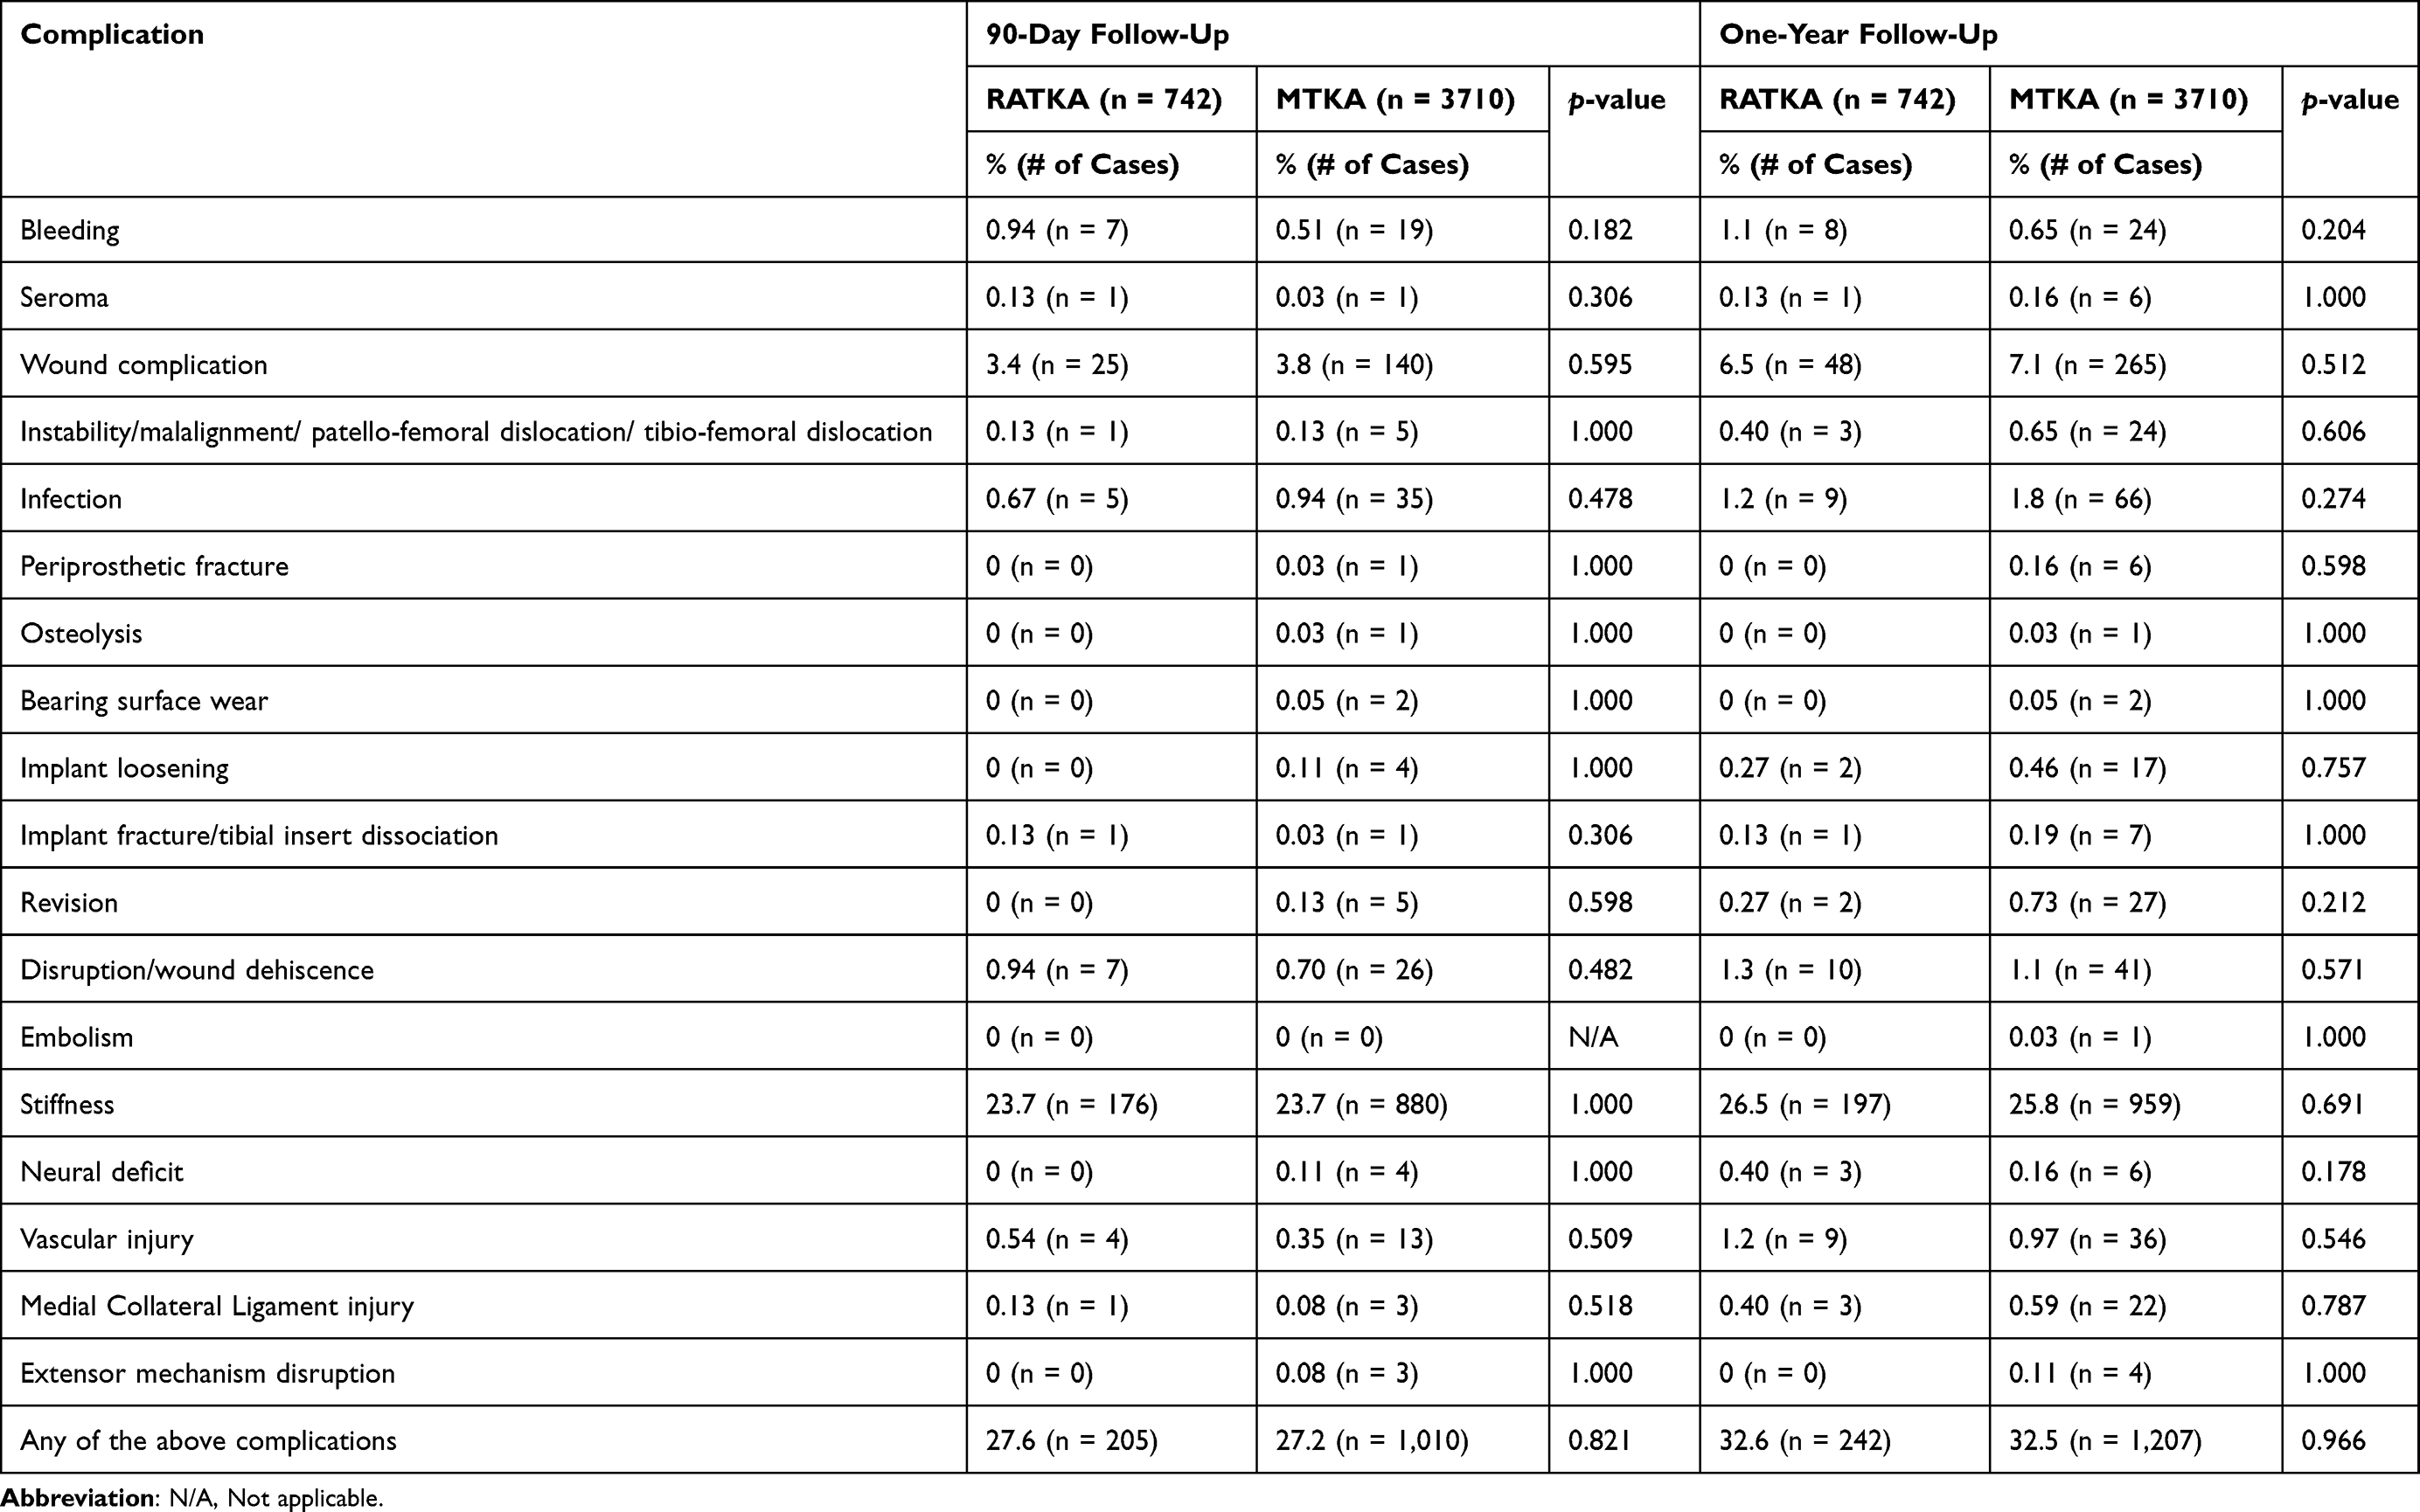 |
Table 1 Complications at 90 Days and One Year Following Robotic-Arm Assisted Total Knee Arthroplasty (RATKA) and Manual TKA (MTKA) |
Statistical Analyses
A non-linear mixed model was used to fit a two-part model to estimate the probability of utilization and then conditional on utilization, to test for differences in index TKA costs and total EOC costs (90-day and one-year periods). A binomial distribution was assumed for the likelihood (%) of utilization of a specified service, while the conditional Gamma distributions and log link functions were used to model costs for those with services. The reported mean costs were estimated as the product of the expected values from the first (binomial) and second (gamma) models. Index TKA LOS was compared using non-parametric Wilcoxon tests. Chi-square tests were used to compare complication rates and discharge statuses between cohorts. When low counts, ie, small samples of complications were found, Fisher’s exact tests were used instead. All analyses were performed in SAS v9.4 (SAS Institute Inc., Cary NC).
Results
Comparison of 90-Day and One-Year Episode-of-Care Costs
The RATKA cohort had lower overall 90-day EOC costs by $2198 (p = 0.001) and one-year EOC costs by $2709 (p = 0.011) (Table 2).
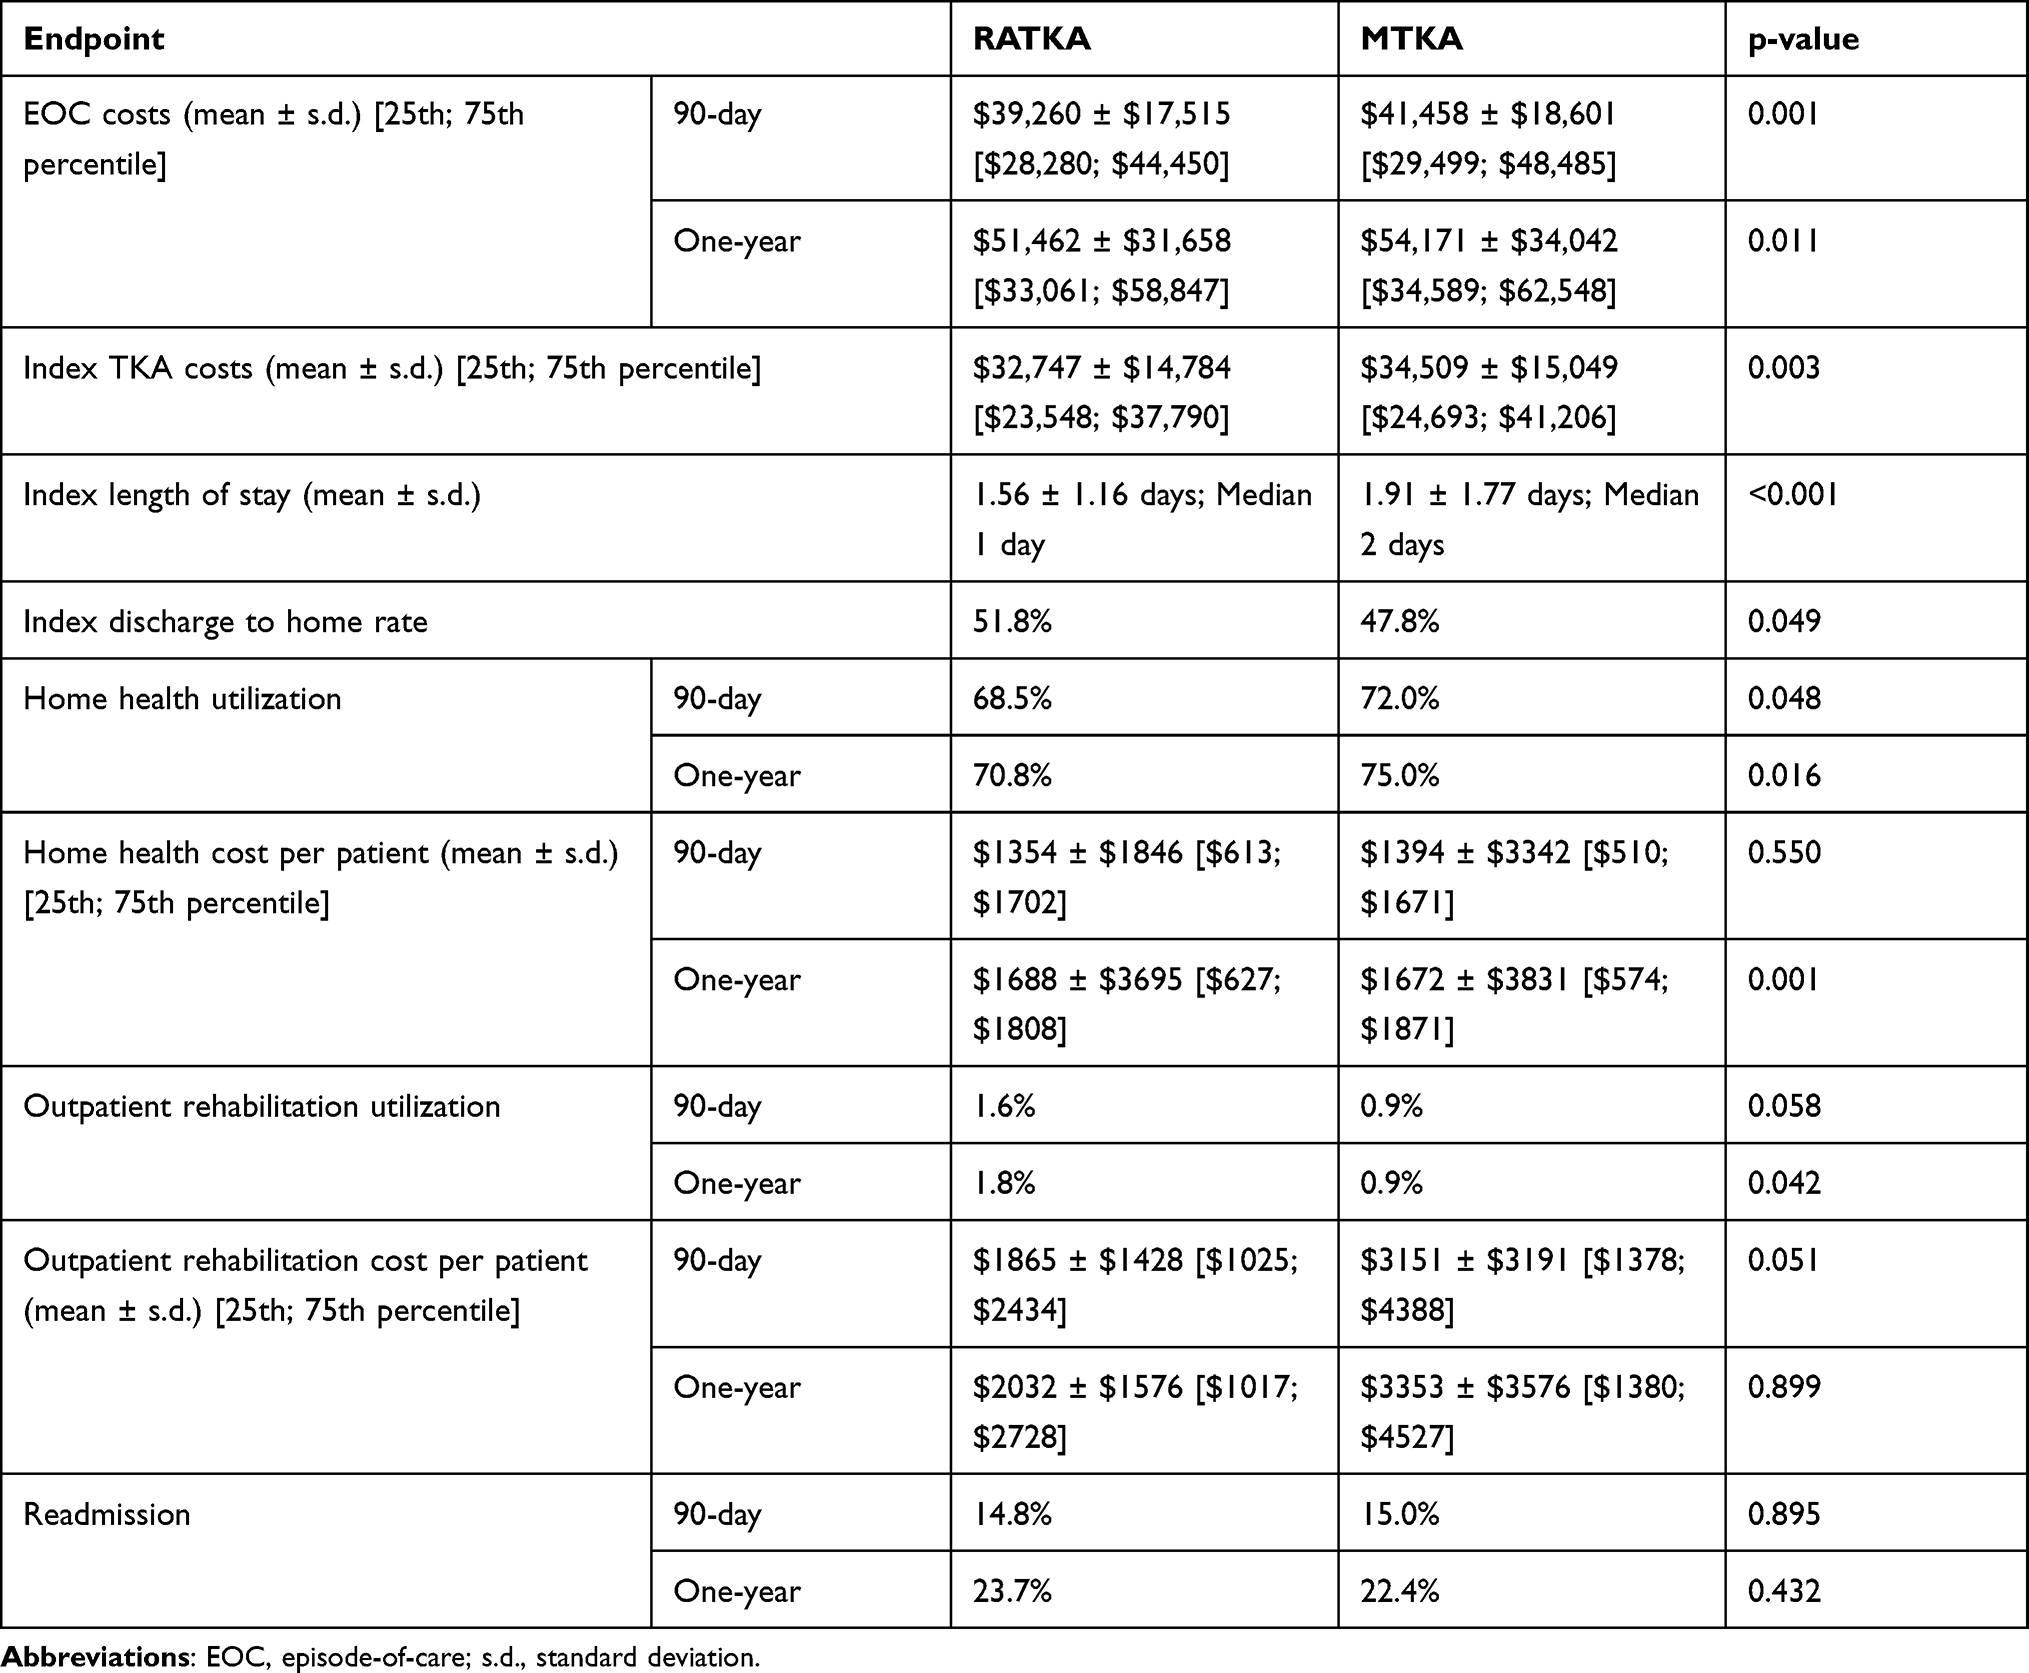 |
Table 2 Comparison of Episode-of-Care Costs, Index TKA Costs, Length of Stay, Discharge Statuses, Rehabilitation Utilizations, and Readmissions |
Lengths of Stay, Costs, and Discharge Statuses for the Index Procedure
RATKA patients had shorter LOS (mean 1.56 versus 1.91 days; p < 0.001), lower index TKA costs by $1762 (p = 0.003), and higher discharges to home rates (51.8 versus 47.8%; p = 0.049) than MTKA patients.
Analyses of 90-Day and One-Year Rehabilitation Utilizations
RATKA patients had less 90-day (68.5 versus 72.0%; p = 0.048) and one-year (70.8 versus 75.0%; p = 0.016) home health utilizations. Per-patient home health cost differences were $40 less for RATKA at 90 days (p=0.550) and $16 less for MTKA at one year (p=0.001). While small, the one-year cost difference showed statistical significance. Although outpatient rehabilitation was used by a small proportion in both cohorts, RATKA patients had more outpatient rehabilitation utilization at 90 days (1.6% for RATKA and 0.9% for MTKA; p=0.058) and one year (1.8% for RATKA and 0.9% for MTKA; p=0.042). The corresponding per-patient costs for outpatient rehabilitation tended to be lower for RATKA patients by $1286 at 90 days (p = 0.051) and by $1322 at one year (p = 0.899).
Rates of 90-Day and One-Year Readmissions
Readmission rates were similar for both cohorts (14.8% (RATKA) versus 15.0% (MTKA), p = 0.895 at 90 days and 23.7% (RATKA) versus 22.4% (MTKA), p = 0.432 at one year).
Observed Complications at 90 Days and One Year
No significant differences in overall complication rates were observed between the two cohorts (p > 0.05 for all) (see Table 1).
Discussion
Robotic-arm assisted total knee arthroplasties have demonstrated improved cost outcomes compared with manual total knee arthroplasties.19–23 However, longer-term studies clearly establishing these cost savings of RATKA are lacking.19–23 Therefore, the objective of the present study was to analyze robotic-arm assisted TKA cost outcomes over one year. We found that patients who underwent RATKA had a 0.35-day shorter LOS (22%; p < 0.001), lower index costs by $1762 (p = 0.003), and 4% higher discharges to home rates (p = 0.049) when compared with MTKA patients. RATKA patients also had 3.5% less 90-day (p = 0.048) and 4.2% less one-year (p = 0.016) home health utilizations. Additionally, the RATKA cohort had lower 90-day ($2198 difference; p = 0.001) and one-year ($2709 difference; p = 0.011) EOC costs. Furthermore, the authors believe these results to be inclusive of both common and more complex TKA procedures as the study cohorts were propensity score matched and there may be an inclination for centers with robotic-arm assisted technology to use it for more challenging cases due to the enhanced planning, visualization, and placement accuracy to plan.1,14
In addition to the Cool et al study mentioned above, other studies have similar results in demonstrating decreased costs for patients who have undergone RATKA, although those studies were limited to 90-day follow-ups.19–23 Pierce and co-authors evaluated utilization and expenditures in RATKA patients aged 65 years and younger.20 Using a different database, OptumInsight Inc., they analyzed 357 RATKA and 1785 MTKA procedures for 90 days after the index surgery. Their results demonstrated that the overall post-operative costs were lower by $1332 (p = 0.0018) and the combined 90-day index and post-operative costs were lower by $4049 (p < 0.0001) in the RATKA group. This may have been due to, at least in part, the decreased lengths of stay of about a day for the RATKA cohort (1.80 days) compared to the MTKA cohort (2.72 days; p < 0.0001). Similar to the results of the present study, RATKA patients using home health services were found to use significantly fewer home health days (5.33 versus 6.36 days; p = 0.0037). Additionally, fewer RATKA patients (2.2%) used inpatient services compared to 4.37% of MTKA patients (p = 0.0444). Similarly, only 1.68% of RATKA patients used skilled nursing facilities compared to 6.05% of MTKA patients (p < 0.0001). A study of 30-, 60-, and 90-day EOC costs, post-operative health care utilizations, and readmissions between RATKA and MTKA was also conducted by Mont and co-investigators.22 They analyzed 519 RATKA and 2595 MTKA patients between January 1, 2016, and March 31, 2017 from the 100% Medicare Standard Analytical Files dataset. Similar to the present study, their results also demonstrated lower EOC costs of $18,568 for RATKA versus $20,960 (p < 0.0001) for MTKA at 90 days and lower 90-day health care utilization for the RATKA cohort as well. Additionally, RATKA was found to have mean total episode payment of $17,768 at 30 days (MTKA: $19,899; p < 0.0001) and $18,174 at 60 days (MTKA: $20,492; p < 0.0001), as well as lower 30- and 60-day health care utilization. Furthermore, RATKA patients utilized less skilled nursing facility (SNF) services and home health visits, thus having lower costs for both at all time points (p < 0.05).22
However, some recent studies suggest that portions of RATKA may be more expensive or that the cost savings may not be as substantial.23,28 Cotter and co-authors of a retrospective single-surgeon and single-institution database study compared 90-day EOC hospital costs for 139 MTKAs and 147 RATKAs performed from April 1, 2015 to September 30, 2017.23 While total intra-operative costs to the hospital were higher when comparing RATKA ($10295.17) to MTKA ($9998.78; p < 0.001), inpatient costs were lower for RATKA ($3893.90) than MTKA ($5587.40; p < 0.001). Additionally, LOS was shorter and less opioids were prescribed (984 for RATKA and 2240 morphine milligram equivalents for MTKA, p < 0.0001) for patients who underwent RATKA. Furthermore, EOC costs at 90 days were approximately $2091 lower than for RATKA (p < 0.001). Although RATKA had higher intra-operative costs, this was more than offset by greater post-operative cost savings. Shah et al compared the total RATKA EOC costs with MTKA within Medicare’s bundled payment arrangement.28 A total of 194,020 MTKAs and 4351 RATKAs within Bundled Payment for Care Improvement analytic file of the 100% Medicare Inpatient Standard Analytic Files were analyzed to compare risk-adjusted, price-standardized payments for the surgical episode from admission through 90-days post-discharge as well as outcomes, utilization, and spending between the procedures. The risk-adjusted EOC mean cost was found to be only $587 less for patients who underwent RATKA after 90 days, but these patients still had shorter lengths of stay and were discharged less frequently to a post-acute care facility. In their study, they found a lower incidence of complications in the RATKA population as well. Therefore, these lower cost savings might only apply to this specific subset while still supporting the other benefits of RATKA.
Limitations
This study had some limitations. Investigations utilizing analyses of data drawn from large databases are retrospective in nature and can be prone to coding errors. These errors may lead to both over- and under-reporting of data. Also, there is the potential for selection bias when surgeons decide to perform either an RATKA or MTKA on a specific patient. However, we did propensity scoring with a 1:5 match between RATKA and MTKA cohorts based on age, sex, census division, race, year of surgery, and comorbidities in an attempt to minimize possible confounders. Moreover, the propensity-matched RATKA cohort did not have fewer comorbidities than the MTKA cohort. Instead, the number of health conditions (ie, coronary artery disease, COPD, smoking, and diabetes) appeared to be higher for the RATKA cohort. The comorbidities that were considered in the present study were based on high-cost comorbidities utilized in other cost analyses of RATKA and MTKA.19–21 Other comorbidities may have an effect but were not evaluated in the present study. The hospital ID was not sufficiently coded to be included as a covariate in the model and may cause potential confounding due to differing hospital characteristics of those performing each type of surgery. Furthermore, one would assume that if there was a bias between the cohorts, more complex deformities might be more likely to undergo a robotic-arm assisted TKA with 3-dimensional CT-scan planning. The use of this specific database allowed for the analyses of the costs of RATKA to the payer, but it did not factor in the initial equipment investments or the required pre-operative CT-scan. Although one-year RATKA versus manual TKA cost outcomes are promising, longer-term analyses can be tested in future studies. Patients with a second TKA on the contralateral knee or any total hip arthroplasty were excluded for the study due to the potential confounding effects of the linking the knee-related complications to the post-index TKA rather than the second TKA or a total hip arthroplasty. It is unclear if inclusion of these patients would have affected the findings. There were trends in lower rates of certain complications (eg, instability, infection, implant loosening, and revision) for the RATKA cohort, but the study may not have been sufficiently powered to show any statistical differences. However, overall the authors believe that this study provides useful information that was performed on a large-scale real-world dataset on this topic, which can be used as a reference for further work. The statistical approach for the present cost analysis involves the use of a two-part model to model zeros and the gamma distribution to address skewness in the data and limit the mean costs to be positive values. Although hurdle models, which are also two-part models,29–31 may be considered an alternative approach, it is unclear to what extent using alternative approaches would affect the findings.
Conclusions
RATKA was associated with lower index costs and EOC costs at both 90 days and one year. These patients were more likely to have shorter LOS, be discharged home, and use less home health services. To the best of our knowledge, this is the first study to demonstrate cost savings for RATKA beyond the 90-day period and an increase in savings between 90-day and one-year time points. These data may be of importance to payers and providers interested in the longer-term value of RATKA.
Role of Sponsor
AC is an employee and shareholder of the sponsor. AC was involved in developing the study design, data interpretation, revising the manuscript, and deciding to submit the manuscript. The sponsor did not collect the data nor analyze the data.
Ethics Statement/Ethics Waiver
The present study utilized a publicly available data set. This contained de-identified data. It did not involve the research of human subjects and was determined not to require institutional review board approval. Studies involving the use of publicly available databases that do not include personal identifying information have been determined by an IRB (Exponent) to be exempt, with a waiver of approval. Such studies meet the criteria stipulated in the Code of Federal Regulations, Title 45, Part 46, section 46.101(b)(4), which states that “… (b) Unless other required by department or agency heads, research activities in which the only involvement of human subjects will be in one or more of the following categories are exempt from this policy: … (4) Research, involving the collection or study of existing data, documents, records, pathological specimens, or diagnostic specimens, if these sources are publicly available or if the information is recorded by the investigator in such a manner that subjects cannot be identified, directly or through identifiers linked to the subjects.
Funding
Exponent, Inc. received funding from Stryker Orthopaedics for this study.
Disclosure
K Ong is an employee and shareholder of Exponent, a scientific and engineering consulting firm. Exponent has been paid fees for his consulting services from Stryker Orthopaedics for this study; Exponent has also been paid fees for his consulting services from Bioventus, Medtronic, Ferring Pharmaceuticals, Sanofi, Pacira Pharmaceuticals, St. Jude Medical, Relievant MedSystems, International Society for the Advancement of Spine Surgery, from SI-Technology, LLC, Zimmer Biomet, Joerns Healthcare, SpineFrontier, Ethicon, DJO, Ossur, Karl Storz Endoscopy-America, Rex Medical, Smith & Nephew, Covidien, outside of the submitted work; he is on the editorial board for the Journal of Arthroplasty. A Coppolecchia reports being employed by and a shareholder of Stryker Orthopaedics. Z Chen reports no conflicts of interest. H Watson is an employee of Exponent, a scientific and engineering consulting firm. Exponent has been paid fees for her consulting services from Stryker Orthopaedics for this study. M Mont is a board/committee member for the American Association of Hip and Knee Surgeons, Knee Society, and Hip Society, receiving research support from National Institutes of Health, on the editorial board for the Journal of Arthroplasty and Surgical Technology International, as well as receiving company support from 3M, Centrexion, Johnson & Johnson, Kolon TissueGene, NXSCI, Organogenesis, Pacira Pharmaceuticals, Pfizer-Lily, Smith & Nephew, Stryker Orthopaedics, CERAS Health, MirrorAR, Peerwell, US Medical Innovations, RegenLab, Medicus Works LLC, Up-to Date, and Wolters Kluwer Health – Lippincott Williams & Wilkins. D Jacofsky is a board/committee member for Plasmology4, Healthcare Outcomes Performance Company; on the editorial board for the Journal Hip Surgery, Journal Knee Surgery; receives research support from Stryker, DePuy, Smith-Nephew, Zimmer-Biomet; receives royalties from Stryker; serves as a consultant for Stryker.
References
1. Marchand RC, Sodhi N, Khlopas A, et al. Coronal correction for severe deformity using robotic-assisted total knee arthroplasty. J Knee Surg. 2018. doi:10.1055/s-0037-1608840
2. Hampp EL, Chughtai M, Scholl LY, et al. Robotic-arm assisted total knee arthroplasty demonstrated greater accuracy and precision to plan compared with manual techniques. J Knee Surg. 2019;32:239–250. doi:10.1055/s-0038-1641729
3. Scholl LY, Hampp EL, De Souza KM, et al. How does robotic-arm assisted technology influence total knee arthroplasty implant placement for surgeons in fellowship training? J Knee Surg. 2020;35:198–203. doi:10.1055/s-0040-1716983
4. Khlopas A, Sodhi N, Sultan AA, Chughtai M, Molloy RM, Mont MA. Robotic arm–assisted total knee arthroplasty. J Arthroplasty. 2018;33(7):2002–2006. doi:10.1016/j.arth.2018.01.060
5. Marchand RC, Sodhi N, Khlopas A, et al. Patient satisfaction outcomes after robotic arm-assisted total knee arthroplasty: a short-term evaluation. J Knee Surg. 2017;30(9):849–853. doi:10.1055/s-0037-1607450
6. Kayani B, Konan S, Tahmassebi JRT, Pietrzak J, Haddad FS. Robotic-arm assisted total knee arthroplasty is associated with improved early functional recovery and reduced time to hospital discharge compared with conventional jig-based total knee arthroplasty. Bone Jt J. 2018;100-B:930–937. doi:10.1302/0301-620X.100B7.BJJ-2017-1449.R1
7. Batailler C, Fernandez A, Swan J, et al. MAKO CT-based robotic arm-assisted system is a reliable procedure for total knee arthroplasty: a systematic review. Knee Surgery, Sport Traumatol Arthrosc. 2020. doi:10.1007/s00167-020-06283-z
8. Bargren JH, Blaha JD, Freeman MAR. Alignment in total knee arthroplasty. Correlated biomechanical and clinical observations. Clin Orthop Relat Res. 1983;173:178–183. doi:10.1097/00003086-198303000-00024
9. Bonner TJ, Eardley WGP, Patterson P, Gregg PJ. The effect of post-operative mechanical axis alignment on the survival of primary total knee replacements after a follow-up of 15 years. J Bone Jt Surg. 2011;93-B(9):1217–1222. doi:10.1302/0301-620X.93B9.26573
10. Moreland JR. Mechanisms of failure in total knee arthroplasty. Clin Orthop Relat Res. 1988;226:49–64. doi:10.1097/00003086-198801000-00010
11. Oswald MH, Jakob RP, Schneider E, Hoogewoud HM. Radiological analysis of normal axial alignment of femur and tibia in view of total knee arthroplasty. J Arthroplasty. 1993;8:419–426. doi:10.1016/S0883-5403(06)80042-2
12. Ranawat CS, Boachie-Adjel O. Survivorship analysis and results of total condylar knee arthroplasty. Eight- to 11-year follow-up period. Clin Orthop Relat Res. 1988;226:6–13. doi:10.1097/00003086-198801000-00003
13. Vaidya NV, Deshpande AN, Panjwani T, Patil R, Jaysingani T, Patil P. Robotic-assisted TKA leads to a better prosthesis alignment and a better joint line restoration as compared to conventional TKA: a prospective randomized controlled trial. Knee Surgery, Sport Traumatol Arthrosc. 2020. doi:10.1007/s00167-020-06353-2
14. Marchand RC, Scholl L, Bhowmik-Stoker M, et al. Total knee arthroplasty in the valgus knee: can new operative technologies affect surgical technique and outcomes? Surg Technol Online. 2021. doi:10.52198/21.sti.39.os1462
15. Berend ME, Ritter MA, Meding JB, et al. Tibial component failure mechanisms in total knee arthroplasty. Clin Orthop Relat Res. 2004;428:26–34. doi:10.1097/01.blo.0000148578.22729.0e
16. Zhang J, Matzko CN, Sawires A, Ehiorobo JO, Mont MA, Hepinstall MS. Adoption of robotic-arm-assisted total knee arthroplasty is associated with decreased use of articular constraint and manipulation under anesthesia compared to a manual approach. J Knee Surg. 2021. doi:10.1055/s-0040-1721123
17. Schiraldi M, Bonzanini G, Chirillo D, de Tullio V. Mechanical and kinematic alignment in total knee arthroplasty. Ann Transl Med. 2016;4(7):130. doi:10.21037/atm.2016.03.31
18. Cherian JJ, Kapadia BH, Banerjee S, Jauregui JJ, Issa K, Mont MA. Mechanical, anatomical, and kinematic axis in TKA: concepts and practical applications. Curr Rev Musculoskelet Med. 2014;7(2):89–95. doi:10.1007/s12178-014-9218-y
19. Cool CL, Jacofsky DJ, Seeger KA, Sodhi N, Mont MA. A 90-day episode-of-care cost analysis of robotic-arm assisted total knee arthroplasty. J Comp Eff Res. 2019;8(5):327–336. doi:10.2217/cer-2018-0136
20. Pierce J, Needham K, Adams C, Coppolecchia A, Lavernia C. Robotic arm-assisted knee surgery: an economic analysis. Am J Manag Care. 2020;26(7):e205–e210. doi:10.37765/ajmc.2020.43763
21. Mont MA, Cool C, Gregory D, Coppolecchia A, Sodhi N, Jacofsky DJ. Health care utilization and payer cost analysis of robotic arm assisted total knee arthroplasty at 30, 60, and 90 days. J Knee Surg. 2021. doi:10.1055/s-0039-1695741
22. Cotter EJ, Wang J, Illgen RL. Comparative cost analysis of robotic-assisted and jig-based manual primary total knee arthroplasty. J Knee Surg. 2020;35:176–184. doi:10.1055/s-0040-1713895
23. Emara AK, Zhou G, Klika AK, et al. Robotic-arm–assisted knee arthroplasty associated with favorable in-hospital metrics and exponentially rising adoption compared with manual knee arthroplasty. J Am Acad Orthop Surg. 2021;29(24):e1328–e1342. doi:10.5435/jaaos-d-21-00146
24. Box GEP, Cox DR. An analysis of transformations. J Royal Stat Soc. 1964;26(2):211–252.
25. Tukey JW. Exploratory Data Analysis. Reading, Mass: Addison-Wesley Pub. Co; 1977.
26. Yeo I, Johnson RA. A new family of power transformations to improve normality or symmetry. Biometrika. 2000;87:954–959. doi:10.1093/biomet/87.4.954
27. Healy WL, Della Valle CJ, Iorio R, et al. Complications of total knee arthroplasty: standardized list and definitions of the knee society knee. Clin Orthop Relat Res. 2013. doi:10.1007/s11999-012-2489-y
28. Shah R, Diaz A, Phieffer L, et al. Robotic total knee arthroplasty: a missed opportunity for cost savings in bundled payment for care improvement initiatives? Surgery. 2021;170(1):134–139. doi:10.1016/j.surg.2020.12.046
29. Belotti F, Deb P, Manning WG, et al. Twopm: two-part models. Stata J. 2015;15(1):3–20. doi:10.1177/1536867X1501500102
30. Farewell VT, Long DL, Tom BDM, et al. Two-part and related regression models for longitudinal data. Ann Rev Stat Appl. 2017;4:283–315. doi:10.1146/annurev-statistics-060116-054131
31. Cragg JG. Some statistical models for limited dependent variables with application to the demand for durable goods. Econometrica. 1971;39(5):829–844. doi:10.2307/1909582
 © 2022 The Author(s). This work is published and licensed by Dove Medical Press Limited. The full terms of this license are available at https://www.dovepress.com/terms.php and incorporate the Creative Commons Attribution - Non Commercial (unported, v3.0) License.
By accessing the work you hereby accept the Terms. Non-commercial uses of the work are permitted without any further permission from Dove Medical Press Limited, provided the work is properly attributed. For permission for commercial use of this work, please see paragraphs 4.2 and 5 of our Terms.
© 2022 The Author(s). This work is published and licensed by Dove Medical Press Limited. The full terms of this license are available at https://www.dovepress.com/terms.php and incorporate the Creative Commons Attribution - Non Commercial (unported, v3.0) License.
By accessing the work you hereby accept the Terms. Non-commercial uses of the work are permitted without any further permission from Dove Medical Press Limited, provided the work is properly attributed. For permission for commercial use of this work, please see paragraphs 4.2 and 5 of our Terms.