")
Back to Journals » Clinical Epidemiology » Volume 11
Risk Prediction of Dyslipidemia for Chinese Han Adults Using Random Forest Survival Model
Authors Zhang X, Tang F , Ji J, Han W, Lu P
Received 18 July 2019
Accepted for publication 29 November 2019
Published 10 December 2019 Volume 2019:11 Pages 1047—1055
DOI https://doi.org/10.2147/CLEP.S223694
Checked for plagiarism Yes
Review by Single anonymous peer review
Peer reviewer comments 2
Editor who approved publication: Dr Eyal Cohen
Xiaoshuai Zhang,1 Fang Tang,2 Jiadong Ji,1 Wenting Han,3 Peng Lu3
1School of Statistics, Shandong University of Finance and Economics, Jinan, People’s Republic of China; 2Center for Data Science in Health and Medicine, Shandong Provincial Qianfoshan Hospital, The First Hospital Affiliated with Shandong First Medical University, Jinan, People’s Republic of China; 3Department of Preventive Medicine, School of Public Health and Management, Binzhou Medical University, Yantai, People’s Republic of China
Correspondence: Xiaoshuai Zhang
School of Statistics, Shandong University of Finance and Economics, Jinan 250014, People’s Republic of China
Tel +86 13589896463
Email [email protected]
Objective: Dyslipidemia has been recognized as a major risk factor of several diseases, and early prevention and management of dyslipidemia is effective in the primary prevention of cardiovascular events. The present study aims to develop risk models for predicting dyslipidemia using Random Survival Forest (RSF), which take the complex relationship between the variables into account.
Methods: We used data from 6328 participants aged between 19 and 90 years free of dyslipidemia at baseline with a maximum follow-up of 5 years. RSF was applied to develop gender-specific risk model for predicting dyslipidemia using variables from anthropometric and laboratory test in the cohort. Cox regression was also adopted in comparison with the RSF model, and Harrell’s concordance statistic with 10-fold cross-validation was used to validate the models.
Results: The incidence density of dyslipidemia was 101/1000 in total and subgroup incidence densities were 121/1000 for men and 69/1000 for women. Twenty-four predictors were identified in the prediction model of males and 23 in females. The C-statistics of the prediction models for males and females were 0.731 and 0.801, respectively. The RSF model shows better discriminative performance than CPH model (0.719 for males and 0.787 for females). Moreover, some predictors were observed to have a nonlinear effect on dyslipidemia.
Conclusion: The RSF model is a promising method in identifying high-risk individuals for the prevention of dyslipidemia and related diseases.
Keywords: random survival forest, Cox proportional hazard model, dyslipidemia, risk prediction
Introduction
Dyslipidemia has been recognized as a major and modifiable risk factor for the development of cardiovascular diseases (CVD), which is a leading cause of mortality worldwide.1,2 The prevalence of dyslipidemia has increased continuously during the past decade especially in developing countries due to diet and lifestyle changes with the rapid economic growth.3,4 Several studies have indicated that early prevention and management of dyslipidemia is effective in the primary prevention of cardiovascular events,5,6 which provide a considerable opportunity to reduce the disease burden and provide great social value. Therefore, it is essential to identify subjects at high risk of lipid conditions in the prevention of dyslipidemia and associated cardiovascular diseases.
Several studies have identified individual risk factors of dyslipidemia and developed risk models depending on the questionnaire including dietary, lifestyle, anthropometric data and genetic markers.7–10 However, researches on dyslipidemia prediction were mainly based on cross-sectional studies for disease diagnosis and screening. Cross-sectional study could only provide a snapshot of the disease information that is inferior to cohort study with respect to risk assessment. In this regard, it is more preferable to use appropriate survival models based on cohort study to predict the risk of dyslipidemia at any time-point in the next few years. Cox proportional hazard model (CPH) has been commonly employed in a cohort study to identify the risk factors and construct the prediction model using time-to-event data.11,12 CPH is an intuitive regression model that can be used to identify the predictors and presents the importance of the variables using hazard ratios. However, Cox regression subjects to restrictive assumptions such as proportionality of hazards and linearity, and the prediction performance is not reliable when the assumptions are not satisfied.13,14 In addition, although the interaction term of the variables can be added in the regression model, the complex relationship with nonlinear effects between the variables is difficult to be considered. It has been demonstrated the Cox regression model suffers from high variance when the model is very complicated.15 Thus, it would be critical to enhance the performance of the prediction models using techniques that require little assumption.
Random Survival Forests (RSF) are data-driven learning algorithm to analyze right-censored survival data.16 It is fully nonparametric that requires no restrictive assumption, and can automatically deal with the nonlinear effects and high-level interactions among the variables. RSF can also be applied to select or rank variables and has been successfully applied in risk prediction for several diseases.17–19 Moreover, RSF has another advantage of handling missing values by using multiple imputation strategy. To the best of our knowledge, though the promising performance of RSF compared to Cox regression has been illustrated in different studies, there is no attempt to use RSF in dyslipidemia prediction. Therefore, the present study aimed to develop risk prediction model for dyslipidemia using random forest survival model based on routine health check-up cohort. Cox regression model was also conducted to compare the performance with the proposed RSF model.
Method
Study Population
The study cohort was based on the routine health check-up system in Center for Health Management of Shandong Provincial Qianfoshan Hospital. To be eligible, participants must have their first check-ups between 2010 and 2015 and with at least three health checks in the 5-year follow-up. Individuals who had been diagnosed as having dyslipidemia, diabetes, cardiovascular disease, hepatosis, renal dysfunction, or hypothyroidism at baseline were excluded. A total of 6328 participants were eligible for this study. Following the 2016 Chinese guideline for the management of dyslipidemia in adults issued by joint committee,20 dyslipidemia was defined as having triglycerides (TG) ≥ 2.3mmol/L, and/or low-density lipoprotein cholesterol (LDL-C) ≥ 4.1 mmol/L, and/or total cholesterol (TC) ≥ 6.2 mmol/L, and/or high-density lipoprotein cholesterol (HDL-C) ≤ 1.0 mmol/L.
Study Variables
All individuals in the study cohort underwent anthropometric and laboratory tests. The anthropometric tests included height, weight, and blood pressure. Height and weight were measured with light clothing without shoes, and body mass index (BMI) was calculated as weight (kg) divided by squared height (m). Systolic blood pressure (SBP) and diastolic blood pressure (DBP) were measured on the right arm from a sitting position after a five-min rest. Peripheral blood samples were collected from subjects after an overnight fast for measuring the following variables: fasting blood-glucose (FBG), total cholesterol (TC), low-density lipoprotein cholesterol (LDL-C), high-density lipoprotein cholesterol (HDL-C), triglycerides (TG), gamma-glutamyl transpeptidase (GGT), alanine transaminase (ALT), aspartate transaminase (AST), red blood cell count (RBC), white blood count (WBC), hematocrit (HCT), absolute lymphocyte count (ALC), absolute monocytes count (AMC), mean platelet volume (MPV), hemoglobin (HGB), neutrophil granulocyte (GRA), mean corpuscular hemoglobin (MCH), platelet large cell ratio (P-LCR), serum creatinine (SCr), blood urea nitrogen (BUN), blood uric acid (BUA). All measurements were conducted following same and standard procedures. This study was approved by the Ethics Committee of Shandong Provincial Qianfoshan Hospital, and written informed consent was obtained from all eligible participants. The study was carried out in accordance with the principles of the Declaration of Helsinki.
Statistical Analysis
Baseline characteristics were assessed for participants with and without incident dyslipidemia diagnosis during the follow-up and described as means (SD) for continuous variables and proportions for categorical variables. We compared the baseline characteristics using t-test for continuous variables and chi-square test for categorical variables.
Random Survival Forest is an extension of random forest which was designed for right-censored time-to-event data. The Random Forest is a collection of decision trees using bootstrap samples from the training dataset which reduces the variance and improves the prediction performance. In this method, 1000 bootstrap samples are randomly drawn from the training dataset to grow an independent tree. Each bootstrap sample consists approximately 63% of the observations and remains the left 37% as the Out-of-Bag (OOB) sample, which can be used to validate the model.16 Tree node splitting was implemented according to maximizing survival differences between child nodes. Survival time and status of the participants were considered as the response variables. Although RSF is capable of utilizing all variables to construct the prediction model, the prediction accuracy of the RSF may decrease with deep tree growing. We applied variable importance (VIMP), a variable selection algorithm widely used in RSF, to avoid overfitting problem and to gain more prediction accuracy with a smaller number of variables. In short, the VIMP is defined as the difference in OOB prediction error before and after permutation.21 The positive VIMP value indicates one variable improves predictive accuracy, while negative value means adverse effect in the prediction. Thus, we ignored variables with negative value and construct the final RSF using the variables with the positive values. Cox proportional hazards model was also conducted to compare the performance with the RSF model. Ten-fold cross-validation technique was employed to validate the models. Harrell’s concordance statistic (C-statistic) was used to compare the discrimination performance of the two models, which is related to the area under the ROC curve.22 RSF and Cox regression were performed with R package “randomForestSRC” and “cph,” respectively.
Results
Dyslipidemia Incidence
A total of 6328 participants were included in our study among which 3885 (61%) were male and 2443 (39%) were female. The incidence density of dyslipidemia was 101/1000 and subgroup incidence densities were: 121/1000 for men; 69/1000 for women. The mean (SD) age for males and females was 45 (14.41) and 41 (12.53), respectively. Table 1 summarizes the baseline characteristics of participants with and without incident dyslipidemia diagnosis during follow-up. Overall, compared to individuals who were not diagnosed as dyslipidemia, participants who developed dyslipidemia were more likely to be male (55% vs 73%, P value < 0.001), with lower HDL-C, MPV, P-LCR, and with higher age, SBP, DBP, BMI, TC, TG, LDL-C, FBG, GGT, ALT, AST, ALC, AMC, RBC, HCT, MCH, HGB, GRA, WBC, SCr, BUA, BUN at baseline, and all the differences were statistically significant.
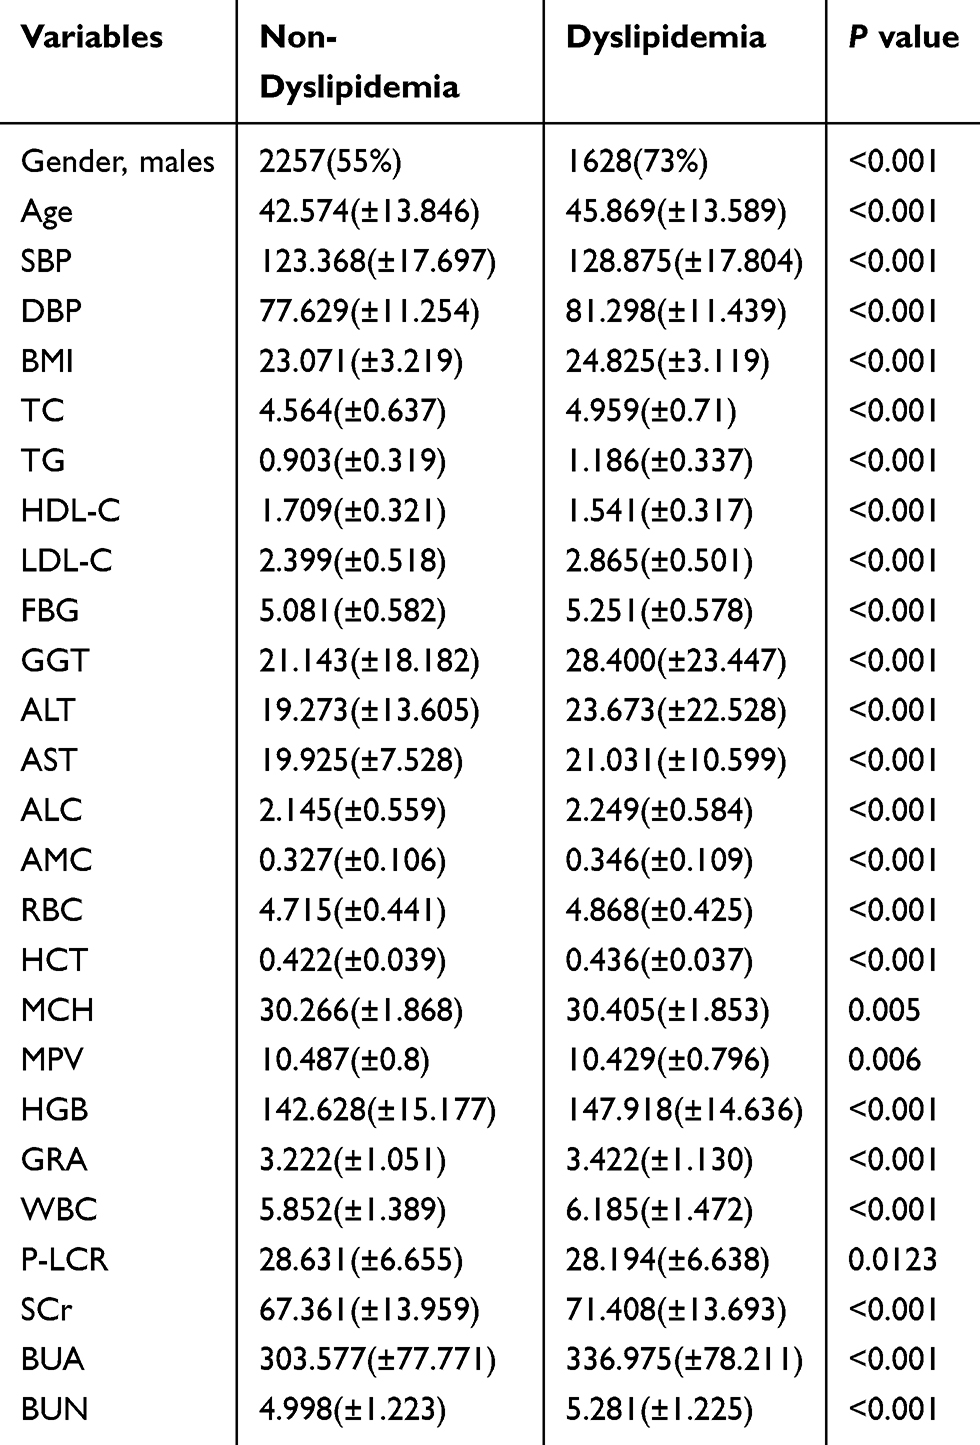 |
Table 1 Baseline Characteristics by Incident Dyslipidemia Status |
Figure 1 depicts Kaplan-Meier survival estimates comparing males and females. As shown in Figure 1, there is an obvious difference between male with female participants, and the prediction models were subsequently constructed by males and females, respectively.
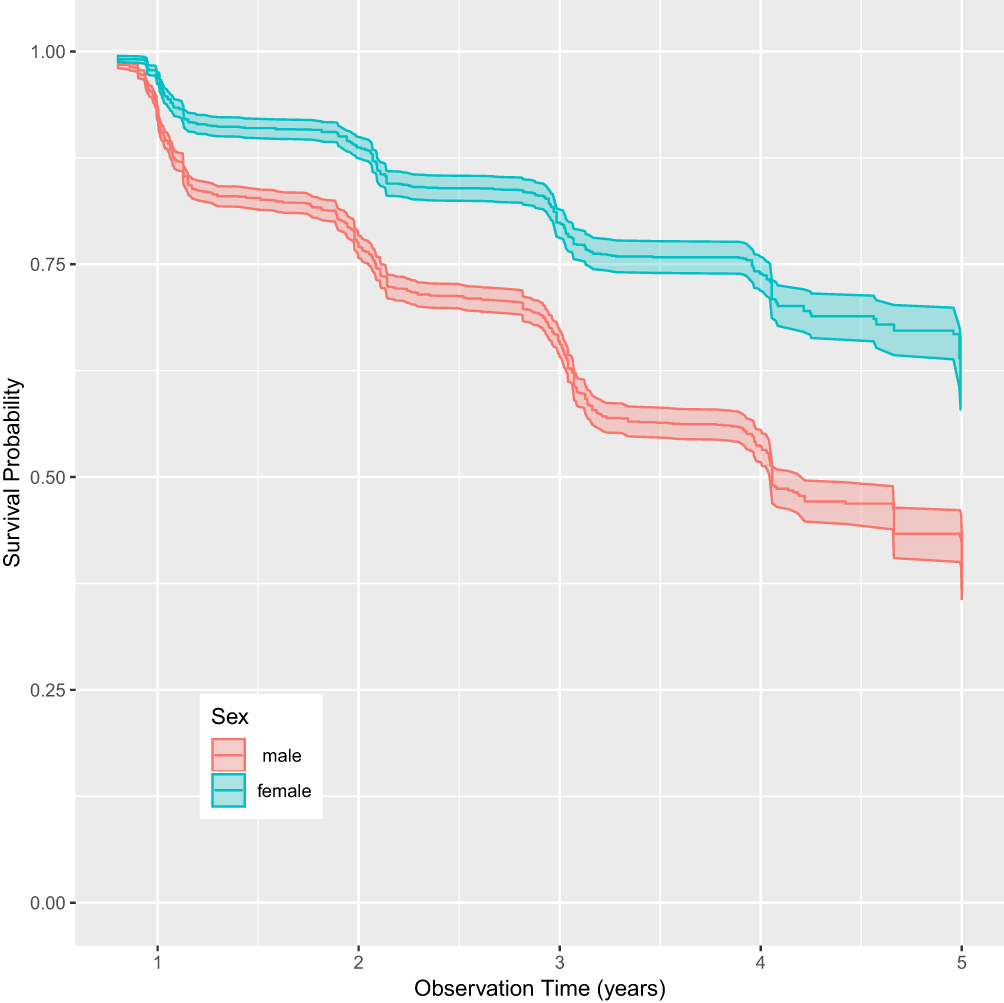 |
Figure 1 Kaplan-Meier survival estimates with shaded 95% confidence band comparing male with female participants. |
Risk Model with RSF
Figure 2 shows the prediction error and VIMPs of each variable in males and females. Figure 2A and C demonstrate the prediction error rates for ensemble cumulative hazard function in males and females. The prediction errors are both stable when the number of trees in the forest comes to 1000, and the error rate in females is smaller than that in males. As shown in Figure 2B and D, for males, all the variables except BUN have positive VIMP values indicating the predictive power of the RSF model is dependent on those variables. The most predictive variables for men include baseline LDL-C, TC, TG, HDL-C, BMI and GGT. For females, the non-predictive variables are those with negative values including P-LCR and AST. Baseline LDL-C, TC, TG, HDL-C, age and FBG are the most important variables in the prediction model for women. The C-statistics of the RSF prediction model are 0.731 and 0.801 for males and females, respectively.
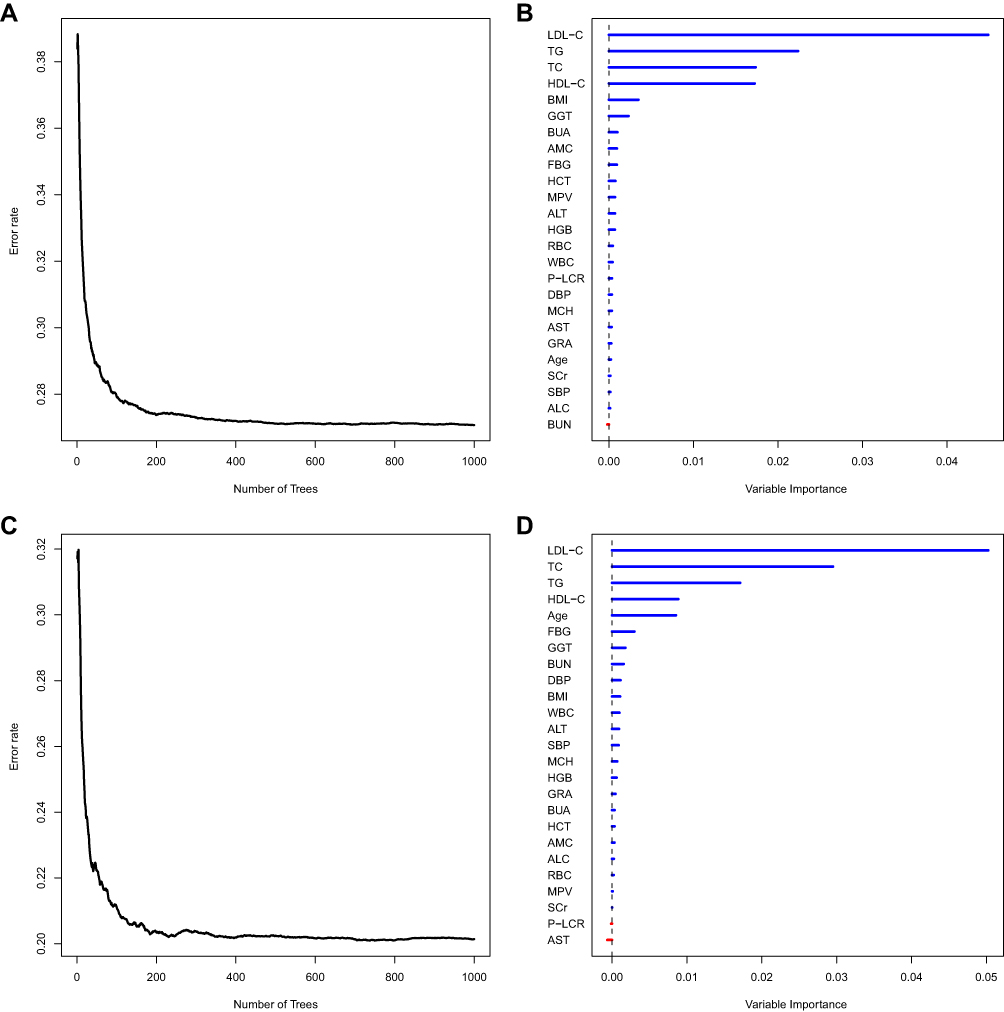 |
Figure 2 Prediction error of RSF and VIMP values of each variable in males and females. (A and C) depict the prediction error rates for ensemble cumulative hazard function in males and females. (B and D) show the VIMP values for males and females. |
Risk Model with CPH model
Gender-specific CPH model for predicting dyslipidemia was conducted in comparison with the RSF model. For males, the significant variables in the final prediction model included age, BMI, TC, TG, HDL-C, LDL-C, GGT, ALT, GRA, and WBC. For females, the prediction model included age, TC, TG, HDL-C, LDL-C, GGT, GRA, and AMC. Table 2 shows the regression coefficient and hazard ratios of the prediction models for both males and females. Figure 3 shows the partial plots of the top four predictors on the 3-year survival probability of the RSF model. The four predictors including baseline TC, TG, HDL-C, and LDL-C appear to have a non-linear relationship to survival, and similar trends can be found for most of the predictors (Supplementary Figures). As shown in Table 3, the C-statistics are 0.719 and 0.787 for males and females, respectively, which are slightly lower than those of RSF.
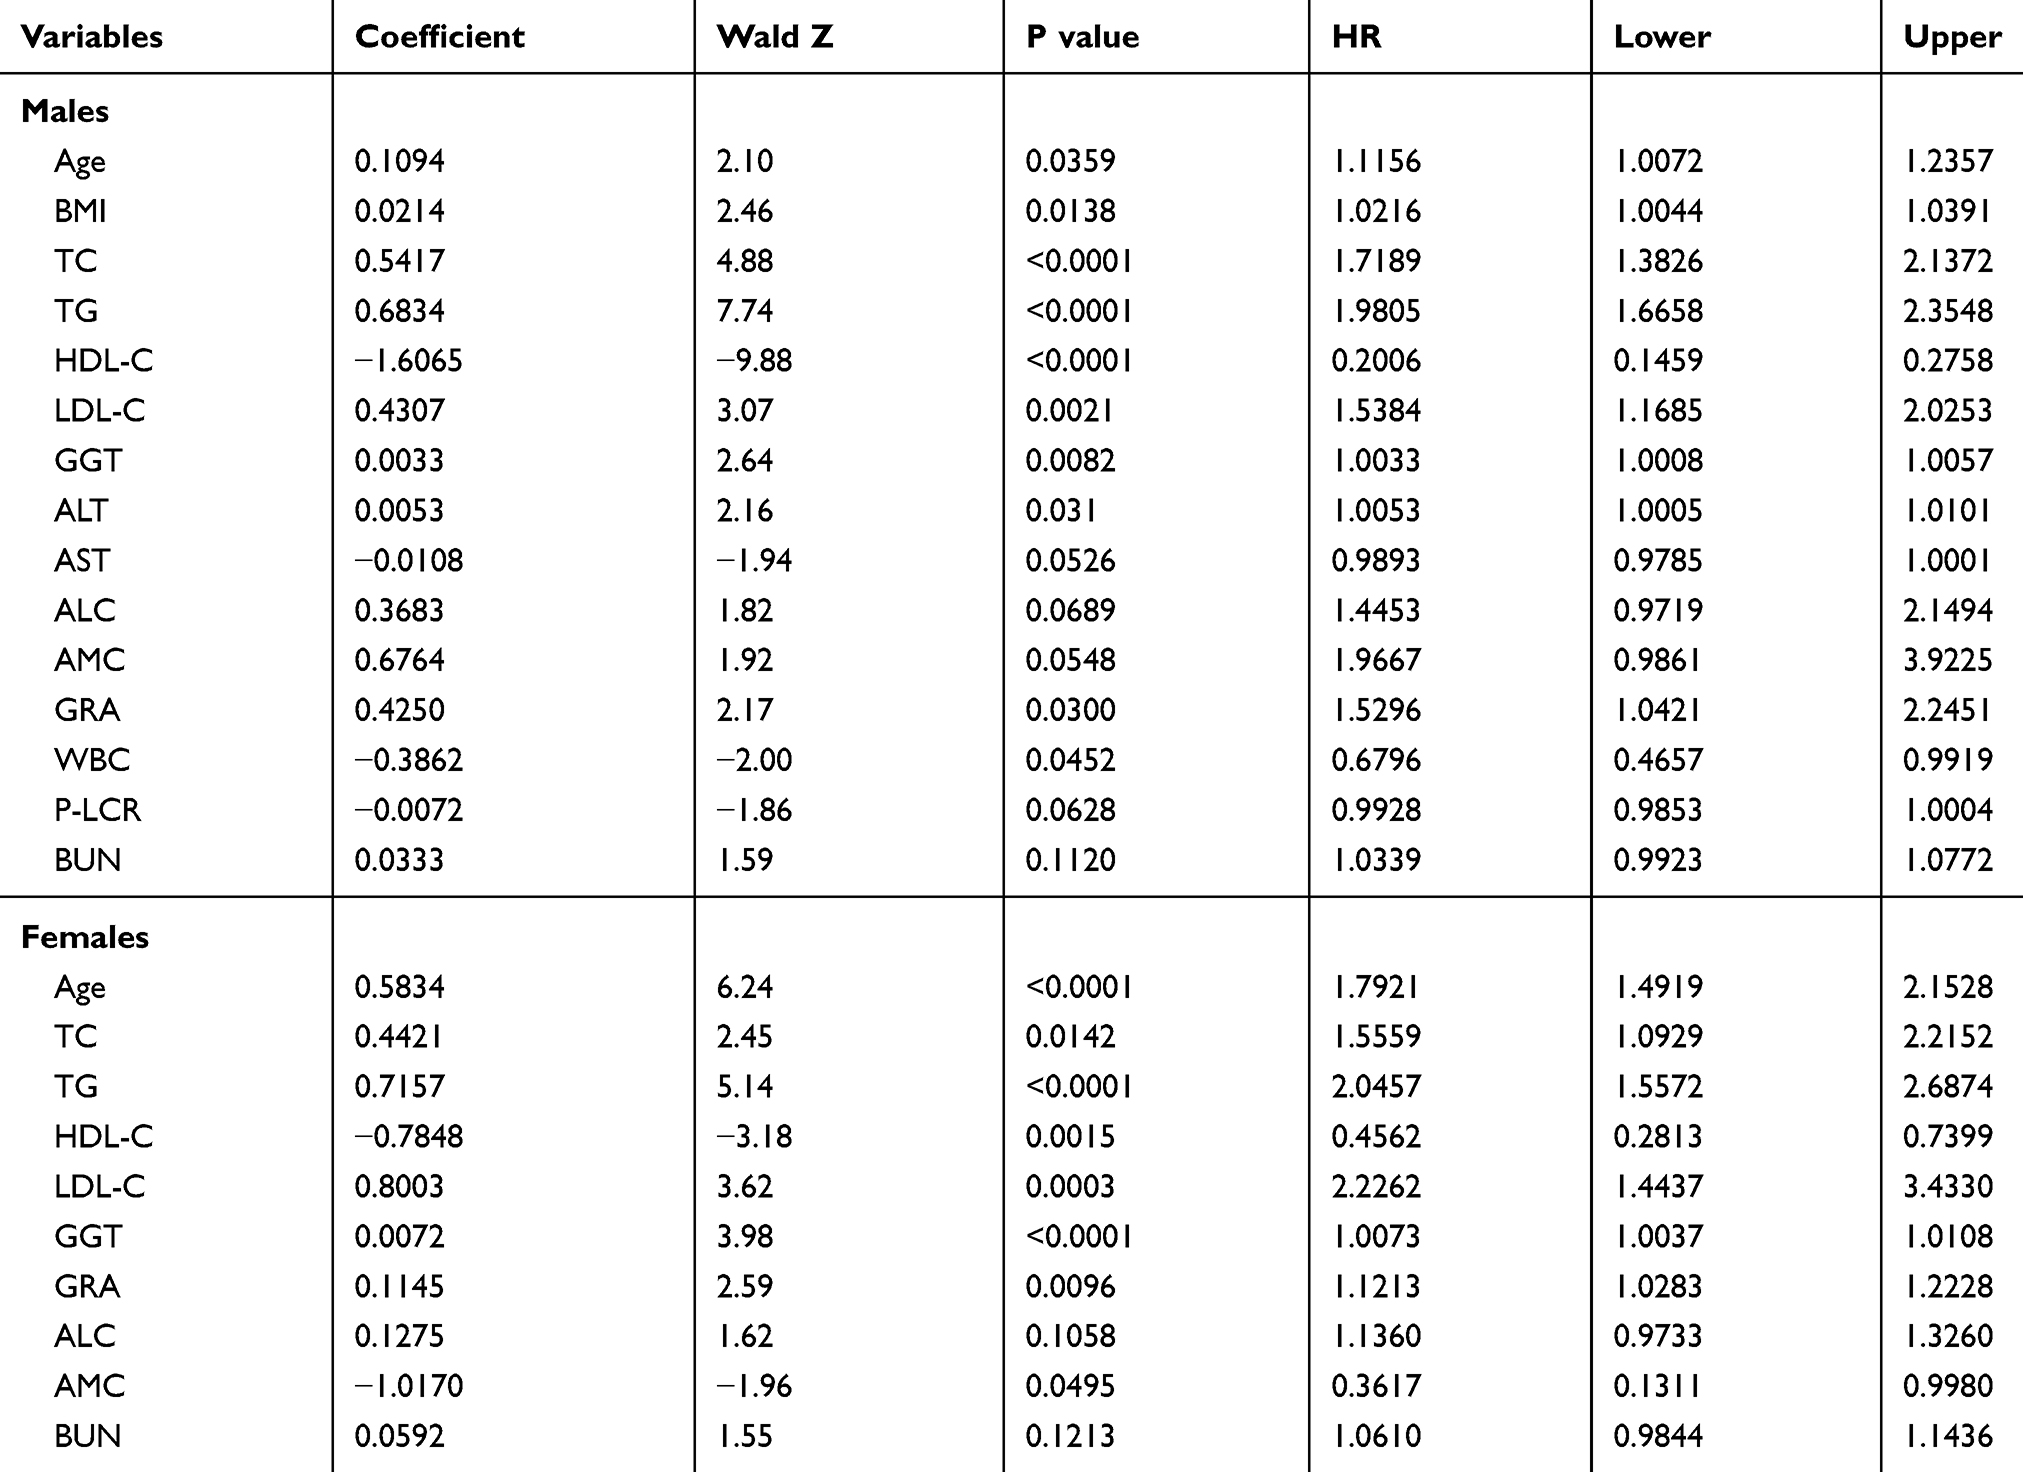 |
Table 2 Cox Proportional Hazard Model for Predicting Dyslipidemia in Males and Females |
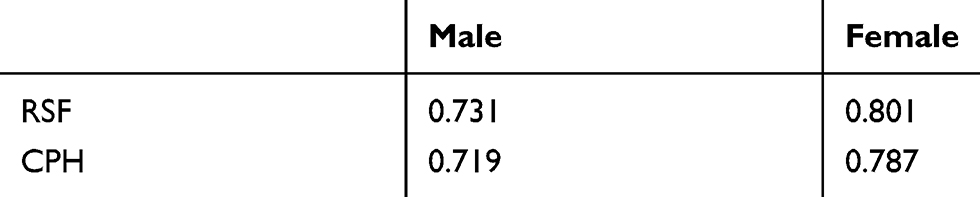 |
Table 3 C-Statistics for Prediction Model with RSF and CPH Model in Males and Females |
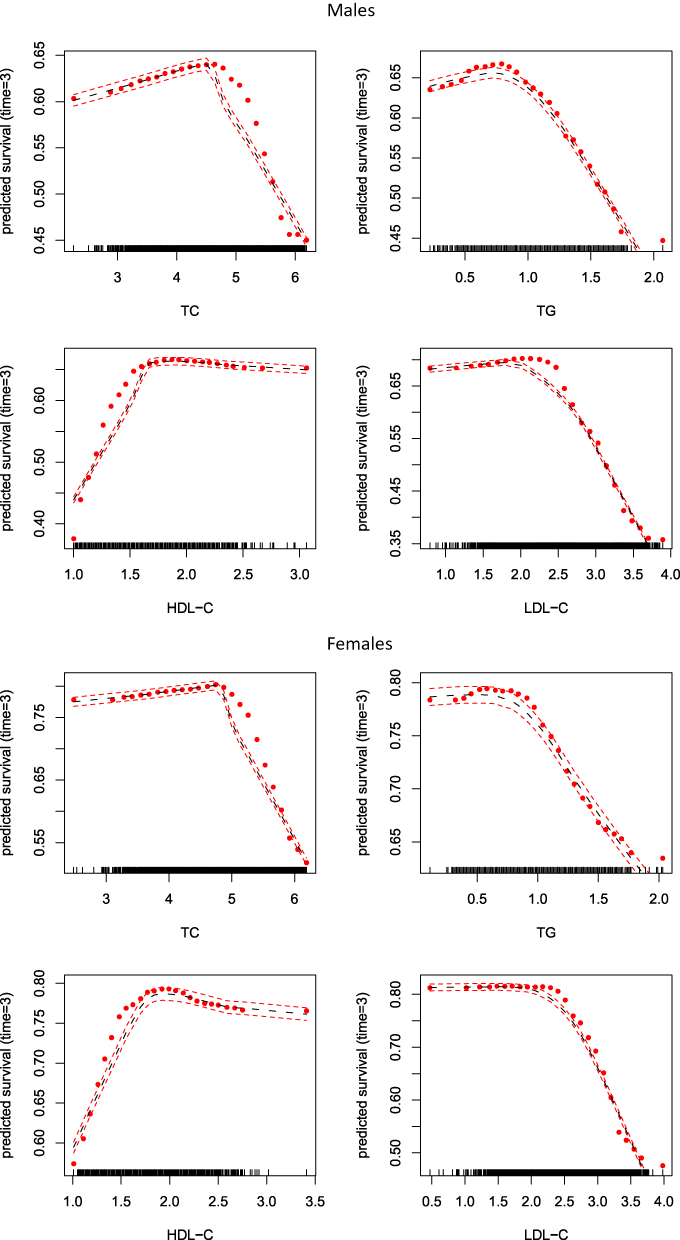 |
Figure 3 Partial plots of the top four predictors including the partial values (red points) |

Discussion
In this study, the total incidence of dyslipidemia in males is greater than that in females, and the Kaplan-Meier survival estimates of men vary apparently from women. This finding of gender-related differences is in agreement with the result of other studies.23,24 Plausible explanation for this could be attributed to different levels of circulating sex hormones, specifically androgens and estrogens in males and females. Thus, we developed the prediction model for males and females, respectively.
According to the results, RSF identified baseline lipoprotein profiles including TC, TG, HDL-C and LDL-C as the four top most important predictors of dyslipidemia in both males and females with a different order, and the LDL-C is the most important predictors in the two groups. This is a reasonable result that unhealthy current plasma lipoprotein profiles will lead to dyslipidemia in the future. We also found the dyslipidemia is age-dependent especially in females. The fifth most important variable of RSF was age in females and BMI in males, which has been reported as risk factors for dyslipidemia in other studies.15,25,26 Most of the predictors contributed to the prediction model in the present study are consistent with previous researches. The four baseline lipoprotein variables were also statistically significant using Cox regression model, while the most important variable affected cumulative incidence probabilities were HDL-C and LDL-C in males and females, respectively.
In the present study, the RSF model identified a larger number of variables than the CPH model. Variable selection algorithm like stepwise method was commonly employed to select important variables in advance in Cox regression models, since too many variables with complex relationships would influence the efficiency and lead to an unstable performance. While random survival forest is not a parsimonious algorithm, and a larger number of variables can be used for the survival analysis directly. RSF is completely data-driven that can automatically deal with the complex relationship between the variables and seek a best model that explained the data. For tree growing, the correlation of the variables was interrupted since correlated variables are selected independently to split nodes.19 As a consequence, the RSF model is still reliable in the presence of multicollinearity between the biomarkers. All the biomarkers used in the present study were annually collected in the routine check-up system even if they are not selected in the prediction model, thus it is worthy to use all possible readily obtained variables in order to improve the prediction performance.
Results showed that RSF outperformed the CPH model in terms of higher C-statistics in both males and females (C-statistic of 0.731 versus 0.719 for males and 0.801 versus 0.787 for females using 10-fold cross-validation). This might be attributed to RSF models consider complicated relationships between the predictors and the outcome.27 As shown in Figure 3, the four predictors including baseline TC, TG, HDL-C, and LDL-C have a non-linear relationship to the survival, and similar trends can be found for most of the predictors. A number of studies have compared the performance of RSF to CPH model, which have shown RSF is better than or at least comparable to CPH with respect to prediction performance.19,28–30 The present study confirmed that RSF is capable of producing accurate predictions.
One of the limitations in our study was that study subjects in the routine check-up cohort were mainly from large companies or institutions who are in a relatively high socioeconomic status, which might affect the application of the prediction model to other populations. Moreover, the date of annual physical check-up was used as the beginning of dyslipidemia to estimate the survival time. However, some participants might develop dyslipidemia before that time which leads to an underestimation of the actual survival time. Potential predictors such as lifestyle and physical activity were not added in our prediction models as they were not collected. The validation of the prediction model in other populations would be needed in further study.
In conclusion, we developed a gender-specific risk model for predicting dyslipidemia using random survival forest. The RSF model has better discriminative performance than the CPH model. The prediction models can be used to identify high-risk individuals in routine health check-ups who would benefit greatly for the prevention of dyslipidemia and related diseases.
Acknowledgements
The authors would like to acknowledge the financial support from National Natural Science Foundation of China (81903410 and 71804093), Shandong Provincial Key Research and Development Program (2016GSF201075), Shandong Provincial Medical and Health Science and Technology Development Project (2016WS0478), Shandong Provincial Natural Science Foundation (ZR2015HL102).
Disclosure
The authors report no conflicts on interest in this work.
References
1. Stamler J, Daviglus ML, Garside DB, Dyer AR, Greenland P, Neaton JD. Relationship of baseline serum cholesterol levels in 3 large cohorts of younger men to long-term coronary, cardiovascular, and all-cause mortality and to longevity. J Am Med Assoc. 2000;284(3):311–318. doi:10.1001/jama.284.3.311
2. Nelson RH. Hyperlipidemia as a risk factor for cardiovascular disease. Prim Care. 2013;40:195–211. doi:10.1016/j.pop.2012.11.003
3. Ni W.Q, Liu X-L, Zhuo Z-P, et al. Serum lipids and associated factors of dyslipidemia in the adult population in Shenzhen. Lipids Health Dis. 2015;14:1–11. doi:10.1186/s12944-015-0073-7
4. Reddy KS, Yusuf S. Emerging epidemic of cardiovascular disease in developing countries. Circulation. 1998;97:596–601. doi:10.1161/01.CIR.97.6.596
5. Miller M. Dyslipidemia and cardiovascular risk: the importance of early prevention. QJM. 2009;102:657–667. doi:10.1093/qjmed/hcp065
6. Hendrani AD, Adesiyun T, Quispe R, et al. Dyslipidemia management in primary prevention of cardiovascular disease: current guidelines and strategies. World J Cardiol. 2016;8:201-210. doi:10.4330/wjc.v8.i2.201
7. Costanza MC, Paccaud F. Binary classification of dyslipidemia from the waist-to-hip ratio and body mass index: a comparison of linear, logistic, and CART models. BMC Med Res Methodol. 2004;4:1–10. doi:10.1186/1471-2288-4-7
8. Wang CJ, Wang CJ, Li YQ, Wang L, et al. Development and evaluation of a simple and effective prediction approach for identifying those at high risk of dyslipidemia in rural adult residents. PLoS One. 2012;7:1–7.
9. Yamada Y, Matsuo H, Warita S, et al. Prediction of genetic risk for dyslipidemia. Genomics. 2007;90:551–558. doi:10.1016/j.ygeno.2007.08.001
10. Marateb HR, Mohebian MR, Javanmard SH, et al. Prediction of dyslipidemia using gene mutations, family history of diseases and anthropometric indicators in children and adolescents: the CASPIAN-III study. Comput Struct Biotechnol J. 2018;16:121–130. doi:10.1016/j.csbj.2018.02.009
11. Levy WC, Mozaffarian D, Linker DT, et al. The seattle heart failure model: prediction of survival in heart failure. Circulation. 2006;113:1424. doi:10.1161/CIRCULATIONAHA.105.584102
12. Joo E-J, Chang Y, Yeom J-S, Cho YK, Ryu S. Chronic hepatitis B virus infection and risk of dyslipidemia: a cohort study. J Viral Hepat. 2019;26:162–169. doi:10.1111/jvh.13014
13. Breiman L. Heuristics of instability and stabilization in model selection. Ann Stat. 1996;24:2350–2383. doi:10.1214/aos/1032181158
14. Lezcanovalverde JM, Salazar F, León L, et al. Development and validation of a multivariate predictive model for rheumatoid arthritis mortality using a machine learning approach. Sci Rep. 2017;7(1):10189.
15. Breiman L. Bagging predictors. Mach Learn. 1996;24:123–140. doi:10.1007/BF00058655
16. Ishwaran H, Kogalur UB, Blackstone EH, Lauer MS. Random survival forests. Ann Appl Stat. 2008;2:841–860. doi:10.1214/08-AOAS169
17. Hamidi O, Tapak M, Poorolajal J, Amini P, Tapak L. Application of random survival forest for competing risks in prediction of cumulative incidence function for progression to AIDS. Epidemiol Biostat Public Heal. 2017;14:
18. Hu H, Nakagawa T, Yamamoto S, et al. Development and validation of risk models to predict the 7-year risk of type 2 diabetes: the Japan epidemiology collaboration on occupational health study. J Diabetes Investig. 2018;9(5):1–8. doi:10.1111/jdi.12809.
19. Dietrich S, Floegel A, Troll M, et al. Random survival forest in practice: a method for modelling complex metabolomics data in time to event analysis. Int J Epidemiol. 2016;45:1406–1420. doi:10.1093/ije/dyw145
20. Zhu JR, Gao RL, Zhao SP, Lu GP, Zhao D, Li JJ. 2016 Chinese guidelines for the management of dyslipidemia in adults. J Geriatr Cardiol. 2018;15:1–29.
21. Ehrlinger J ggRandomForests: exploring random forest survival. ArXiv Prepr ArXiv. 2016;1612.08974.
22. Harrell FE
23. Yang W, Xiao J, Yang Z, et al. Serum lipids and lipoproteins in Chinese men and women. Circulation. 2012;125:2212–2221. doi:10.1161/CIRCULATIONAHA.111.065904
24. Habib SS, Aslam M, Hameed W. Gender differences in lipids and lipoprotein (a) profiles in healthy individuals and patients with type 2 diabetes mellitus. Pak J Physiol. 2005;1(1–2).
25. Zhu Y, Shao Z, Jing J, et al. Body mass index is better than other anthropometric indices for identifying dyslipidemia in Chinese children with obesity. PLoS One. 2016;11:1–11.
26. Qi L, Ding X, Tang W, et al. Prevalence and risk factors associated with dyslipidemia in Chongqing, China. Int J Environ Res Public Health. 2015;12:13455–13465. doi:10.3390/ijerph121013455
27. Datema FR, Moya A, Krause P, et al. Novel head and neck cancer survival analysis approach: random survival forests versus Cox proportional hazards regression. Head Neck. 2012;34:50–58. doi:10.1002/hed.21698
28. Hsich E, Gorodeski EZ, Blackstone EH, Ishwaran H, Lauer MS. Identifying important risk factors for survival in systolic heart failure patients using random survival forests. Circ Cardiovasc Qual Outcomes. 2011;4:39–45. doi: 10.1161/CIRCOUTCOMES.110.939371
29. Kurt Omurlu I, Ture M, Tokatli F. The comparisons of random survival forests and Cox regression analysis with simulation and an application related to breast cancer. Expert Syst Appl. 2009;36:8582–8588. doi:10.1016/j.eswa.2008.10.023
30. Hamidi O, Poorolajal J, Farhadian M, Tapak L. Identifying important risk factors for survival in kidney graft failure patients using random survival forests. Iran J Public Health. 2016;45:27–33.
 © 2019 The Author(s). This work is published and licensed by Dove Medical Press Limited. The full terms of this license are available at https://www.dovepress.com/terms.php and incorporate the Creative Commons Attribution - Non Commercial (unported, v3.0) License.
By accessing the work you hereby accept the Terms. Non-commercial uses of the work are permitted without any further permission from Dove Medical Press Limited, provided the work is properly attributed. For permission for commercial use of this work, please see paragraphs 4.2 and 5 of our Terms.
© 2019 The Author(s). This work is published and licensed by Dove Medical Press Limited. The full terms of this license are available at https://www.dovepress.com/terms.php and incorporate the Creative Commons Attribution - Non Commercial (unported, v3.0) License.
By accessing the work you hereby accept the Terms. Non-commercial uses of the work are permitted without any further permission from Dove Medical Press Limited, provided the work is properly attributed. For permission for commercial use of this work, please see paragraphs 4.2 and 5 of our Terms.