")
Back to Journals » Diabetes, Metabolic Syndrome and Obesity » Volume 14
Risk of Thyroid Cancer Associated with Use of Liraglutide and Other Antidiabetic Drugs in a US Commercially Insured Population
Authors Funch D, Mortimer K, Ziyadeh NJ, Seeger JD, Zhou L, Ng E, Ross D, Major-Pedersen A, Bosch-Traberg H, Gydesen H, Dore DD
Received 10 February 2021
Accepted for publication 22 May 2021
Published 10 June 2021 Volume 2021:14 Pages 2619—2629
DOI https://doi.org/10.2147/DMSO.S305496
Checked for plagiarism Yes
Review by Single anonymous peer review
Peer reviewer comments 4
Editor who approved publication: Professor Ming-Hui Zou
Donnie Funch,1 Kathleen Mortimer,1 Najat J Ziyadeh,1 John D Seeger,1 Li Zhou,1 Eva Ng,1 Douglas Ross,2,3 Atheline Major-Pedersen,4 Heidrun Bosch-Traberg,5 Helge Gydesen,6 David D Dore1,7
1Optum Epidemiology, Boston, MA, USA; 2Massachusetts General Hospital, Thyroid Associates, Boston, MA, USA; 3Harvard Medical School, Department of Medicine, Boston, MA, USA; 4Global Safety, Novo Nordisk A/S, Copenhagen, Denmark; 5Global Development, Novo Nordisk A/S, Copenhagen, Denmark; 6Epidemiology, Novo Nordisk A/S, Copenhagen, Denmark; 7Department of Health Services, Policy & Practice, Brown University School of Public Health, Providence, RI, USA
Correspondence: Najat J Ziyadeh
Optum Epidemiology, 1325 Boylston Street, 11th Floor, Boston, MA, 02215, USA
Email [email protected]
Background: Quantify association between the glucagon-like peptide-1 receptor agonist liraglutide and risk of thyroid cancer (TC) compared to other antidiabetics.
Patients and Methods: Initiators of liraglutide, exenatide, metformin, pioglitazone or groups of dipeptidyl peptidase-4 inhibitors or sulfonylureas were identified in a US health plan (2010– 2014) and followed for a median of 17 months. Thyroid cancer cases during follow-up were identified via a validated algorithm. Incidence rates of TC among liraglutide and comparators were assessed using relative risks estimated within propensity score-matched cohorts using intention to treat (ITT) and time on drug analyses. Latency effects and potential surveillance bias were evaluated.
Results: Relative risks from ITT analyses ranged from 1.00 (95% confidence interval (CI) 0.56– 1.79) versus metformin to 1.70 (95% CI 1.03– 2.81) versus all comparators excluding exenatide. Effect estimates from latency analyses were slightly attenuated. Time on drug analyses suggested no increased risk for either longer duration or higher cumulative dose of liraglutide. Medical record review found 85% were papillary or a follicular variant of papillary or both; 46% were microcarcinomas (≤ 10 millimeters), which were more prevalent in the liraglutide cohort (67% versus 43% in all comparators).
Conclusion: Relative risks were elevated for several comparisons, which should be interpreted cautiously because of potential residual confounding and surveillance bias. Liraglutide cases had smaller thyroid nodules and shorter time-to-diagnosis, suggesting increased surveillance for TC among liraglutide initiators, especially shortly after the drug´s approval. After adjusting the primary analyses (ITT) for latency, no significant elevated risk of TC was observed among liraglutide initiators.
Keywords: glucagon-like peptide-1 receptor agonist, type 2 diabetes, administrative claims, intention-to-treat, time-on-drug
Introduction
Type 2 diabetes mellitus (T2DM) is the most common type of diabetes, accounting for approximately 90% of all cases worldwide, and incretin-based therapies are widely used by patients with T2DM. Liraglutide is a once-daily glucagon-like peptide-1 receptor agonist (GLP-1 RA) approved for use in the United States (US) in 2010 to improve glycemic control in adults with T2DM as an adjunct to diet and exercise. On liraglutide’s approval, the Food and Drug Administration (FDA) required a five-year epidemiological study to compare the incidence of thyroid cancer (TC) between initiators of liraglutide and initiators of other antidiabetic drugs (ADs).1 The GLP-1 receptor is expressed in all types of thyroid cells including normal, premalignant or malignant tissues. This research requirement arose from studies showing that GLP-1 RAs, including liraglutide, caused thyroid C-cell hyperplasia and C-cell tumors in carcinogenicity studies in rodents.2 However, animal experiments with monkeys did not show increased proliferation of C-cells in thyroid glands after chronic administration of liraglutide, and longitudinal data from clinical trials have not demonstrated a causal association between GLP-1 analogs and thyroid C-cell pathology.2,3
The incidence of TC has been increasing on average 4.5% annually over the past decade,4 and specifically, medullary thyroid carcinoma (MTC), the subtype that originates from C cells, accounts for 1–2% of TCs in the US.5 The FDA label contains a warning regarding MTCs for GLP-1 RAs; however, the applicability of rodent studies to the occurrence of MTC or TC generally in humans remains uncertain, and the rarity and difficulty of identifying MTC without pathology reports complicates its study.6,7
Rates of spontaneous reports of TC from 2004 through 2009 were elevated with exenatide, another GLP-1 RA.8,9 Although spontaneous reporting systems enable identification of a range of potential safety signals, biased reporting is common and often profound; therefore, evidence on GLP-1 RA and TC has been sparse and inconclusive.9,10
In this paper, results of the primary analyses of the FDA post-marketing requirement are presented where the relationship between liraglutide and TC relative to several matched comparison groups initiating other ADs was quantified, using a new-user, active-comparator study design within a well-defined population.11,12
Methods
The patients included in this prospective cohort study were drawn from the Optum Research Database (ORD), a proprietary research database that contains the eligibility data, medical claims, and pharmacy claims from a large, commercial health plan affiliated with Optum. The individuals covered by this health plan are geographically diverse across the US and comprise approximately 4% of the US population.13
Data Source
The ORD is a proprietary research database containing claims and enrollment data dating back to 1993 for members of a large US health plan. For 2014, data relating to approximately 12.7 million individuals with both medical and pharmacy benefit coverage and an average of 2.5 years of enrollment were available. The medical and pharmacy claims for these individuals forms a longitudinal record of reimbursed medical services, irrespective of treatment site, along with detailed information on drug dispensings (including drug name, dosage form, strength, fill date, days of supply, and financial information) and on medical claims (including multiple diagnosis codes, procedures, site of service, provider specialty, and paid amounts) collected from available health-care sites (ie, inpatient hospital, outpatient hospital, emergency room, physician’s office, etc.) for virtually all types of provided services, allowing for longitudinal tracking of patients. Access to a subset of patients’ medical charts (ie, approximately 35% of all patients within the ORD) allows for confirmation of outcomes identified through claims.
Study Population
Study ADs included liraglutide and comparator medications (exenatide, metformin, pioglitazone, a sulfonylurea [SU; glyburide, glipizide, glimepiride] or a dipeptidyl peptidase-4 inhibitor [DPP-4i; sitagliptin, saxagliptin, linagliptin]). Patients aged 18–89 years who initiated liraglutide or another AD following at least 6 months of continuous health plan enrollment with complete medical and pharmacy benefits. Drug initiation was defined by pharmacy claims for ADs, with no dispensing of that specific drug or drug class (ie, SU or DPP-4i) during the preceding 6-month baseline period. The operational definition of an initiator included patients who were naïve to AD treatments, those who switched to cohort-defining therapy from another specific AD or drug class, and those who started cohort-defining therapy as add-on treatment to existing therapy. Patients with claims for International Classification of Diseases, 9th Revision (ICD-9) diagnosis codes 193 (Malignant neoplasm of thyroid gland) or V10.87 (Personal history of malignant neoplasm of thyroid) during baseline were excluded to allow for identification of incident cancers during follow-up.
Accrual occurred from 01 February 2010 to 30 November 2014. Due to changing prescribing patterns and composition of ADs in the US market, cohorts were assembled quarterly for the first 3 years (2010–2012) and annually thereafter (2013–2014), for 14 total calendar blocks. Patients were assigned to the cohort of the first drug initiated during a calendar accrual block. Throughout the study, however, patients were permitted to enter more than one cohort if they met eligibility criteria with initiations in later accrual blocks. Follow-up began the day after first eligible initiation and continued until the earliest of disenrollment from health plan, TC occurrence, or end of study period (31 December 2014). A National Death Index search was conducted to identify deaths due to TC, but because it is rarely fatal, results were sparse; therefore, date of death was not used to censor.
Propensity Score Matching
Treatment of (T2DM) consists of a stepwise escalation of therapy along the progressive continuum of the disease with metformin widely accepted as the first-line therapy.14,15 This treatment strategy may create a selection bias within observational studies, and in order to mitigate this potential bias, baseline demographics, comorbidities, medications, and healthcare utilization covariates in addition to the 150 most frequently occurring diagnoses, procedures, and drug dispensings in the ORD were balanced using propensity scores (PS), which were estimated separately for 8 comparison groups (5 comparator drugs as well as all comparators, all comparators minus exenatide [to remove any GLP-1 RA effect], and all comparators minus exenatide and DPP-4i [to remove any incretin effect from the all comparator cohort]).16–18
A priori variables correlated with exposures and likely to be correlated with TC were forced into the model including known risk factors (benign thyroid disease, overweight/obese, markers for diabetes severity, and variables representing baseline AD use [number of AD dispensings, use of insulin, individual ADs]). For the remaining baseline and Top 150 variables, a stepwise selection technique was used with an entry p-value of ≤0.20 and an exit p-value of ≥0.30. Candidate variables for inclusion in PS models are in Supplementary Appendix 1.
To account for changes in prescribing patterns and availability of ADs on the market, PS estimation and matching were performed by calendar periods and separately for each comparator. Initiators of liraglutide were PS-matched 1:1 to initiators in each of the comparison groups using a standard greedy matching algorithm.19–21 Patients who did not match during one accrual time block, but initiated any study drug in a later accrual block, were eligible for matching, with PS estimated based on updated variable information for the later initiation. Patients could enter into multiple matched cohorts but only once for each drug cohort pair.
Identification of TC
Thyroid cancer cases were identified during follow-up using an algorithm developed within this population and validated through medical record review.22 The algorithm had a positive predictive value (PPV) of 0.91 (95% confidence interval [CI] 0.81–0.96) requiring both a thyroidectomy and at least 2 separate diagnoses for malignant neoplasm of thyroid gland (ICD-9 193) within 90 days of the thyroidectomy. Date of diagnosis was the first TC claim associated with thyroidectomy.
Analysis
Baseline distributions of covariates were calculated for liraglutide initiators and all combined comparators. Because of the complexity of drug use patterns and the different mechanisms of cancer occurrence, several analytic methods were undertaken to quantify the risks associated with initiating liraglutide, recency of use of liraglutide, and cumulative exposure history.
As the primary analysis, an intent to treat (ITT) analysis quantified the risk associated with starting treatment by attributing follow-up time in the cohort to the drug used at cohort entry and accounting for potential risk after drug discontinuation, especially relevant when investigating cancer outcomes. Incidence rates (IR; TC cases per 100,000 person-years [py]) were estimated as number of patients with TC divided by py at-risk. Poisson regression models computed estimated IR ratios (RRs) and 95% CIs for liraglutide versus each comparator. Generalized estimating equations (GEE) with exchangeable correlation structures and robust variance estimators accounted for the paired nature of the data created by matching, except where data were too sparse to support GEE.23 In a latency analysis, person-time and TC cases from the first year of follow-up were excluded to account for the probable latency period of any exposure effect on TC.
Two time on drug (TOD) analyses evaluated the effect of recency of use and cumulative exposure to liraglutide. Based on dispensing date and days’ supply, each person-day was assigned to “current”, “recent”, and “past” use categories independently for each study drug. A “grace period” of 31 days was added to account for medication non-adherence and the uncertainty surrounding duration of biologic effect for these drugs. Current use was defined as the initiation date through end of days’ supply plus the 31-day grace period and continued as long as new dispensings were observed before the grace period ended. If the grace period expired, it was assumed the patient discontinued that drug, and the subsequent 31 days were considered “recent” use. Person-time occurring after “recent” use was categorized as “past”, which persisted unless the patient re-started the same treatment, thereby reentering the current use category. Because many patients were on more than one AD and switched therapies regularly, those in matched pairs may have had exposure to both liraglutide and the comparator during follow-up. If TC was diagnosed while the patient was currently on liraglutide and had past use of the comparator, for example, the TC case (and corresponding person-time) counted toward both the incidence estimate for current liraglutide use and past comparator use. Poisson regression estimated RRs and 95% CIs for current, recent, and past use of liraglutide versus the same category for comparators, adjusted by the logit of the PS to address confounding.
For the second TOD analysis, each patient’s cumulative person-time exposed and unexposed to liraglutide was quantified. If a patient initiated another study drug, subsequent person-time was categorized as “liraglutide-unexposed” and continued until end of follow-up or TC diagnosis. All person-time was categorized as “liraglutide-exposed” time once a dispensing for liraglutide was observed. Rate ratios were estimated using Poisson regression modeling within observed categories of cumulative time (<6, 6–18, >18 months) relative to all “liraglutide-unexposed” time, and models were adjusted for the logit of the PS.
Concerns about increased screening for TC among liraglutide initiators were evaluated by tabulating frequencies of TC screening and diagnostic tests during follow-up. In addition, time-to-diagnosis by drug cohort and calendar years were plotted to assess whether screening intensity was higher soon after liraglutide’s approval. For the subset of cases confirmed via medical records, tumor histology and count of microcarcinomas were summarized by exposure to test the assumption that a higher proportion of papillary microcarcinomas may indicate more vigilant screening.24,25
Privacy and Confidentiality
Approval of the study protocol and a waiver of patient authorization from the New England Institutional Review Board and affiliated Privacy Board was obtained. All analyses were conducted using appropriately de-identified data.
Analyses were conducted using SAS Version 9.4.
Results
Before matching, there were 27,287 eligible liraglutide initiators and 362,809 comparators. The size of matched cohorts varied considerably due to patient characteristics and prevalence of drugs on the market. Follow-up times ranged from one day to 58.5 months (Table 1, Section A). Median lengths of follow-up were similar within matched cohorts, with some variation across matched sets (eg, medians for the matched liraglutide: pioglitazone cohorts were over 2 months longer than those for the liraglutide: sulfonylurea matched cohorts). Median time to TC was shorter for liraglutide than most comparator cohorts (Table 1, Section B; Supplementary Appendix Figures S-1A–S-1H). Composition of these all comparator groups by specific study drug is available in Supplementary Appendix Table S-1. Propensity score matching balanced baseline characteristics of liraglutide initiators and all comparators (Supplementary Appendix Table S-2) and within all other comparator pairs (data not shown).
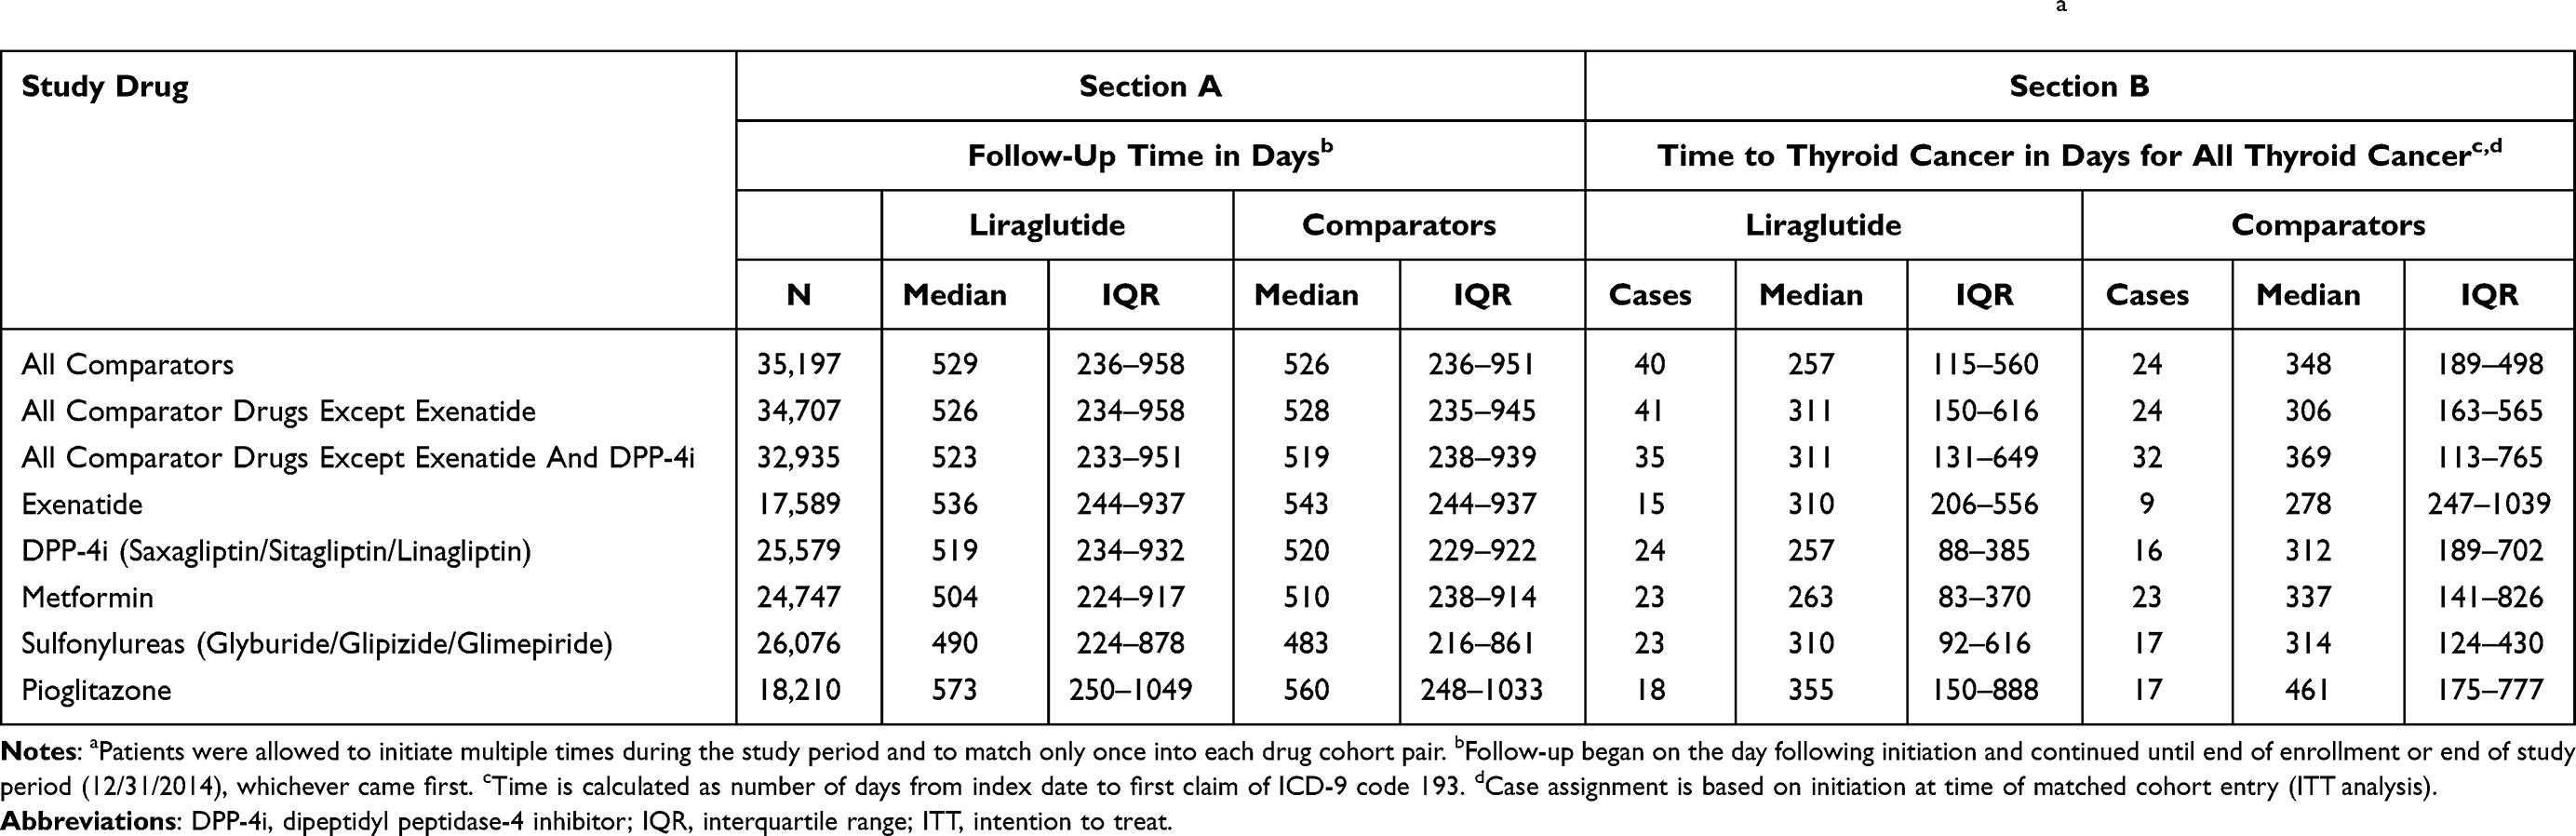 |
Table 1 Amount of Follow-Up Time Available [Section A] and Time to Thyroid Cancer Diagnosis (in Days) [Section B] by Matched Drug Pairsa |
ITT and TOD Analyses
Results for primary ITT analyses are displayed in Figure 1. Across drug comparisons, RRs ranged from 1.00 (95% CI 0.56–1.79) for the comparison with metformin to approximately 1.70 for each of the following comparisons: all comparators (RR 1.66, 95% CI 1.00–2.75), all comparators except exenatide (RR 1.70, 95% CI 1.03–2.81), and exenatide (RR 1.66, 95% CI 0.73–3.79). In the latency analysis, RRs ranged from 0.54 (95% CI 0.20–1.47) to 1.62 (95% CI 0.76–3.43).
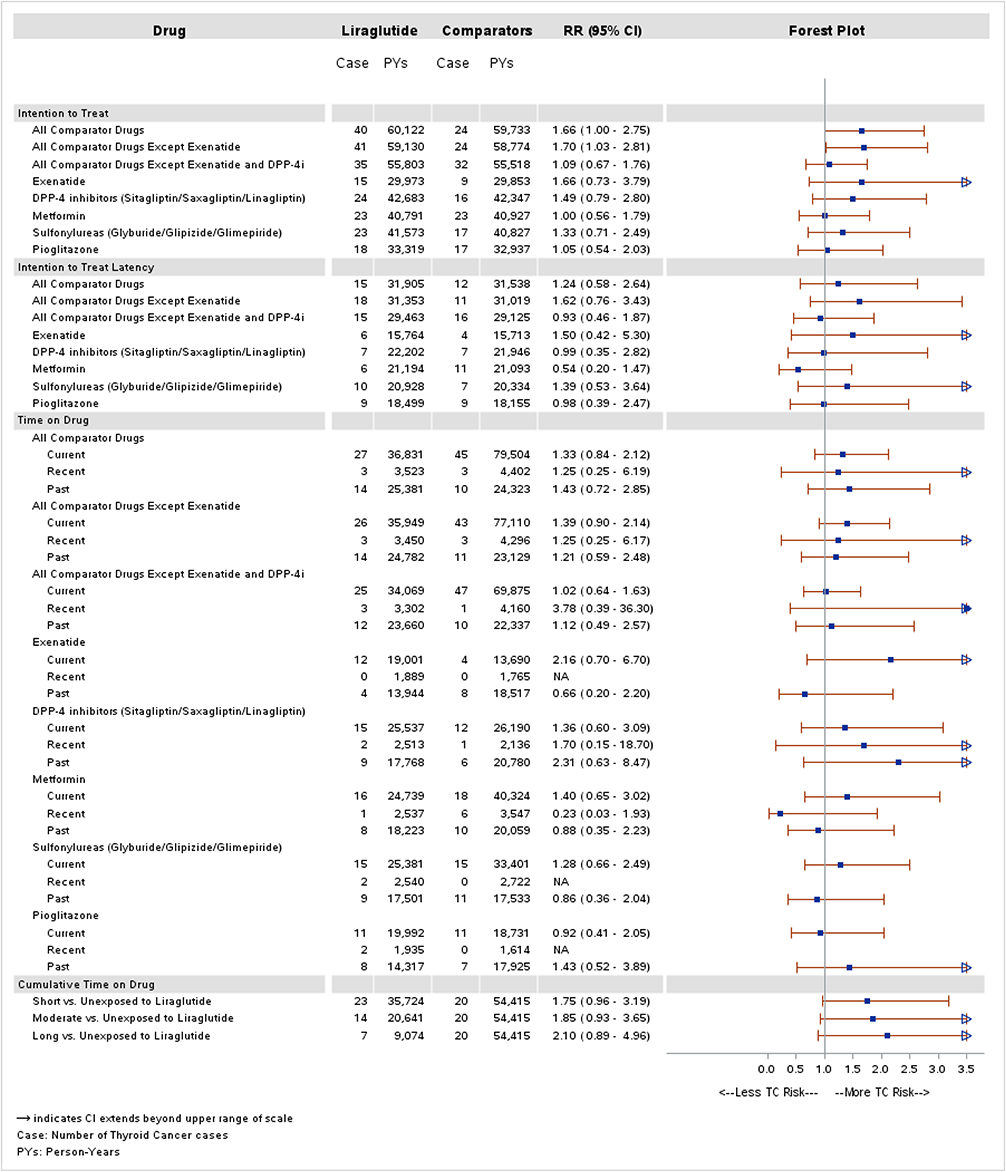 |
Figure 1 Propensity score matched ITT and TOD analyses for thyroid cancer. |
In TOD analyses, RRs among current users ranged from 0.92 (95% CI 0.41–2.05) versus pioglitazone to 2.16 (95% CI 0.70–6.70) versus exenatide. Recent use RRs were higher than current but were imprecise due to the small amount of person-time. Past-time RRs followed no consistent pattern. Adjusted RRs were 1.75 (95% CI 0.96–3.19) for <6 months exposure, 1.85 (95% CI 0.93–3.65) for 6–18 months, and 2.10 (95% CI 0.89–4.96) for >18 months exposure.
Across all ITT and TOD analyses, the only comparison that excluded the null was the ITT analysis for all comparators except exenatide (RR 1.70, 95% CI 1.03–2.81).
Surveillance Bias Assessments
The percentage of initiators with thyroid-related assays, imaging procedures or diagnostic procedures, or presence of goiters/nodules during follow-up was similar among matched liraglutide initiators, relative to all comparators (49.8% versus 48.5%, respectively) (Supplementary Appendix Table S-3).
In 2010 and 2011, when liraglutide was new to the market, time to TC diagnosis was substantially shorter among liraglutide initiators (Figure 2). This difference attenuated over calendar time; specifically, among patients who initiated in 2010, 12 of 17 (70.6%) cases of TC among liraglutide initiators occurred within the first 500 days of follow-up (approximate median follow-up time), in contrast to 3 of 7 cases (42.9%) for all comparators.
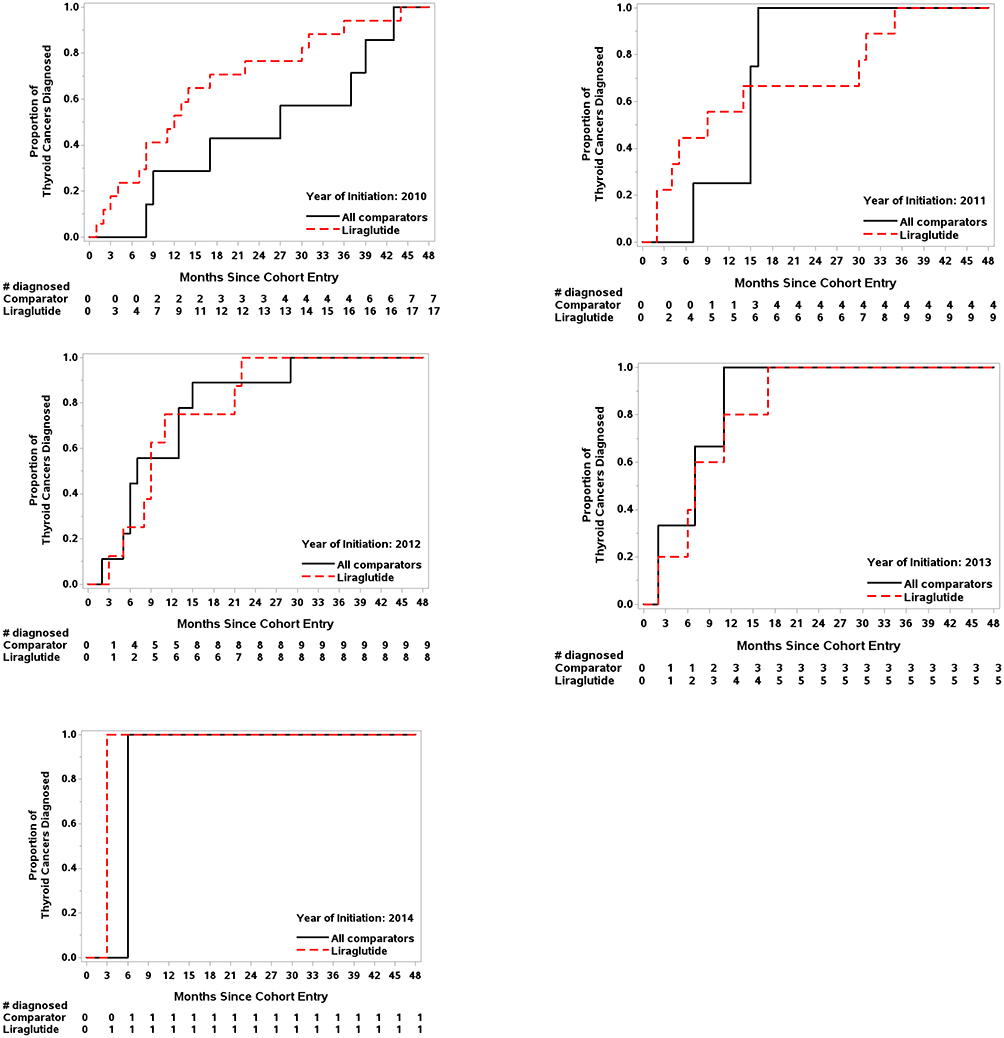 |
Figure 2 Proportion of thyroid cancer cases diagnosed since cohort entry by year of initiation. |
Medical records for 150 patients identified with potential TC were obtained and adjudicated by a clinician. Of those, 72 cases were confirmed, and pathology information was available for most. There was little variation in histology by exposure: 85% were either papillary or follicular variant of papillary or both, 7% were follicular, 4% had other papillary and follicular or papillary, follicular and follicular variant papillary cancer, and 4% had no histology available (Table 2). There were no cases of MTC alone or in combination with other cell types. All microcarcinomas were papillary or a follicular variant of papillary (PTMC). Among confirmed cases, patients who initiated liraglutide were more likely to have a PTMC compared with all comparators (67% versus 43%) (Table 3). Many PTMC were incidental (eg, associated with multinodular goiters), and consistent with other reports, were more likely to be ≤5 millimeters in size and to present with no cervical node involvement.26,27
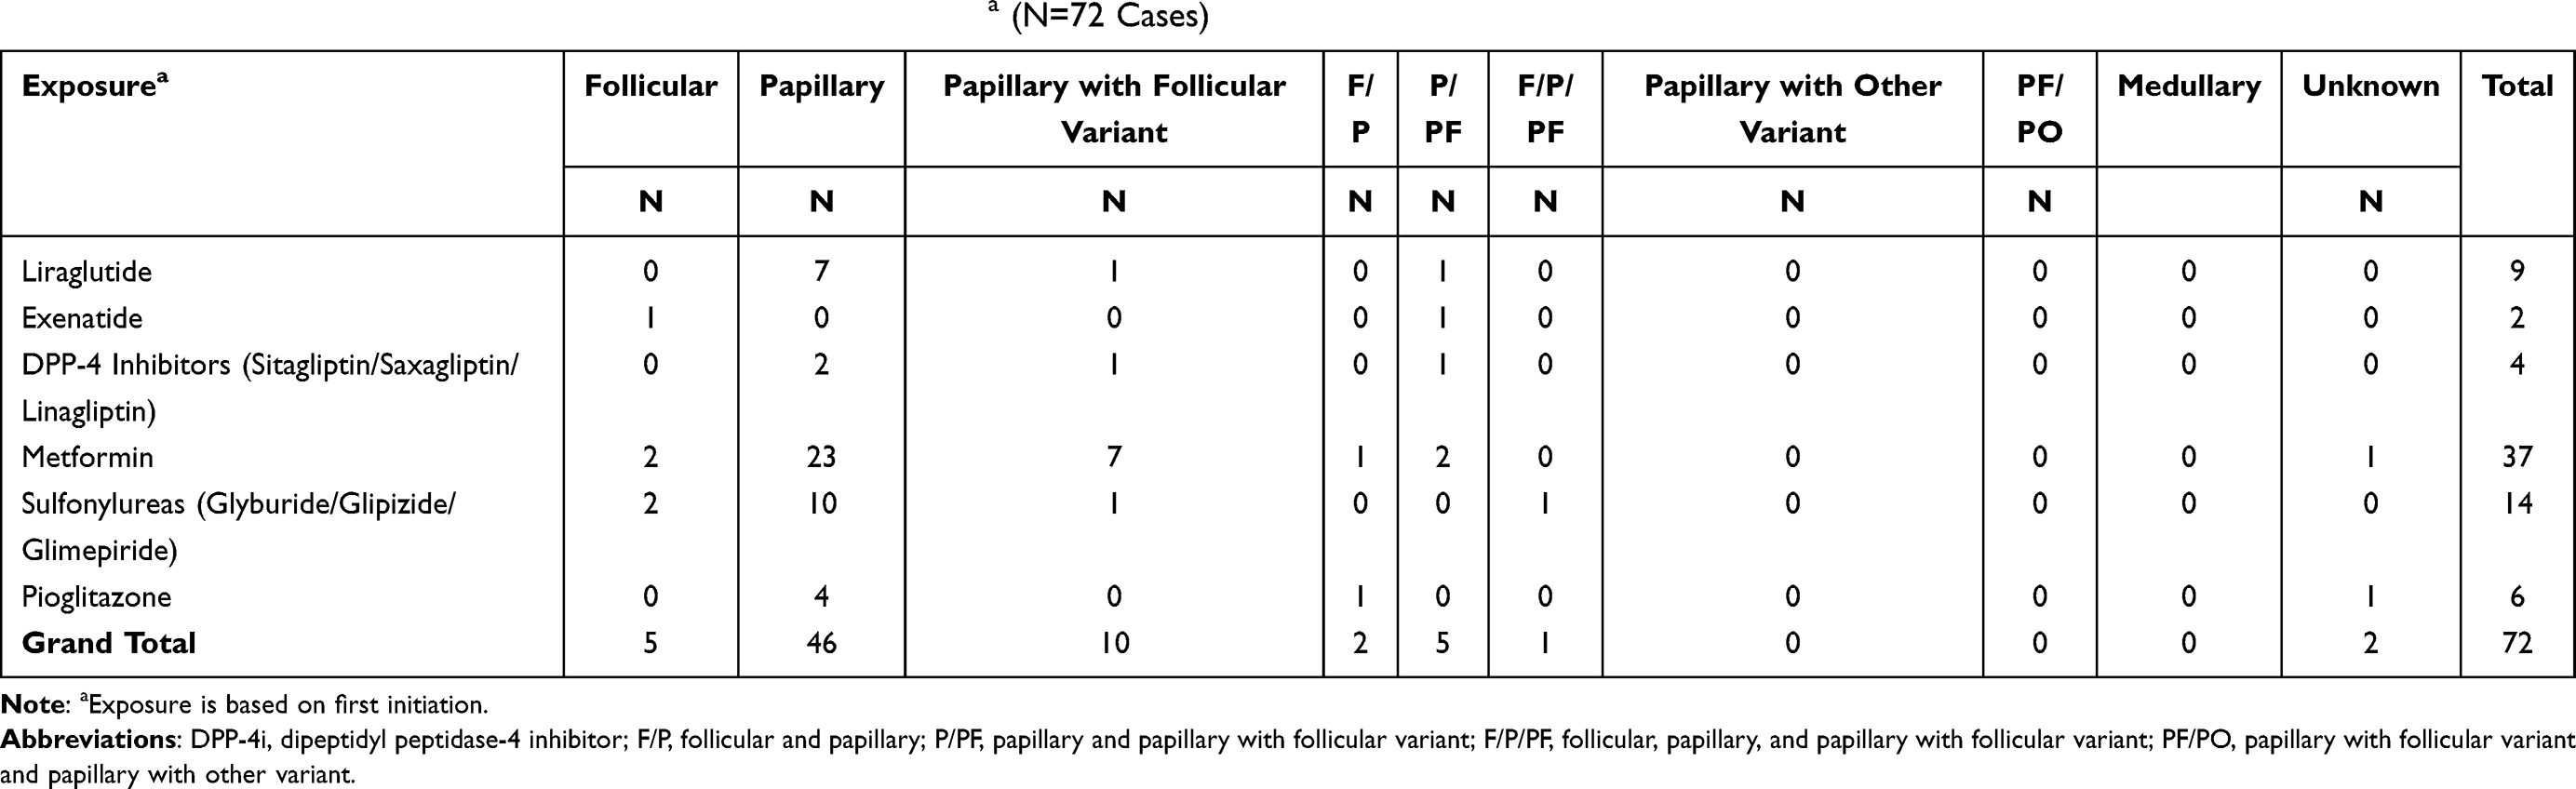 |
Table 2 Histology of Confirmed Thyroid Cancer Cases by Exposurea (N=72 Cases) |
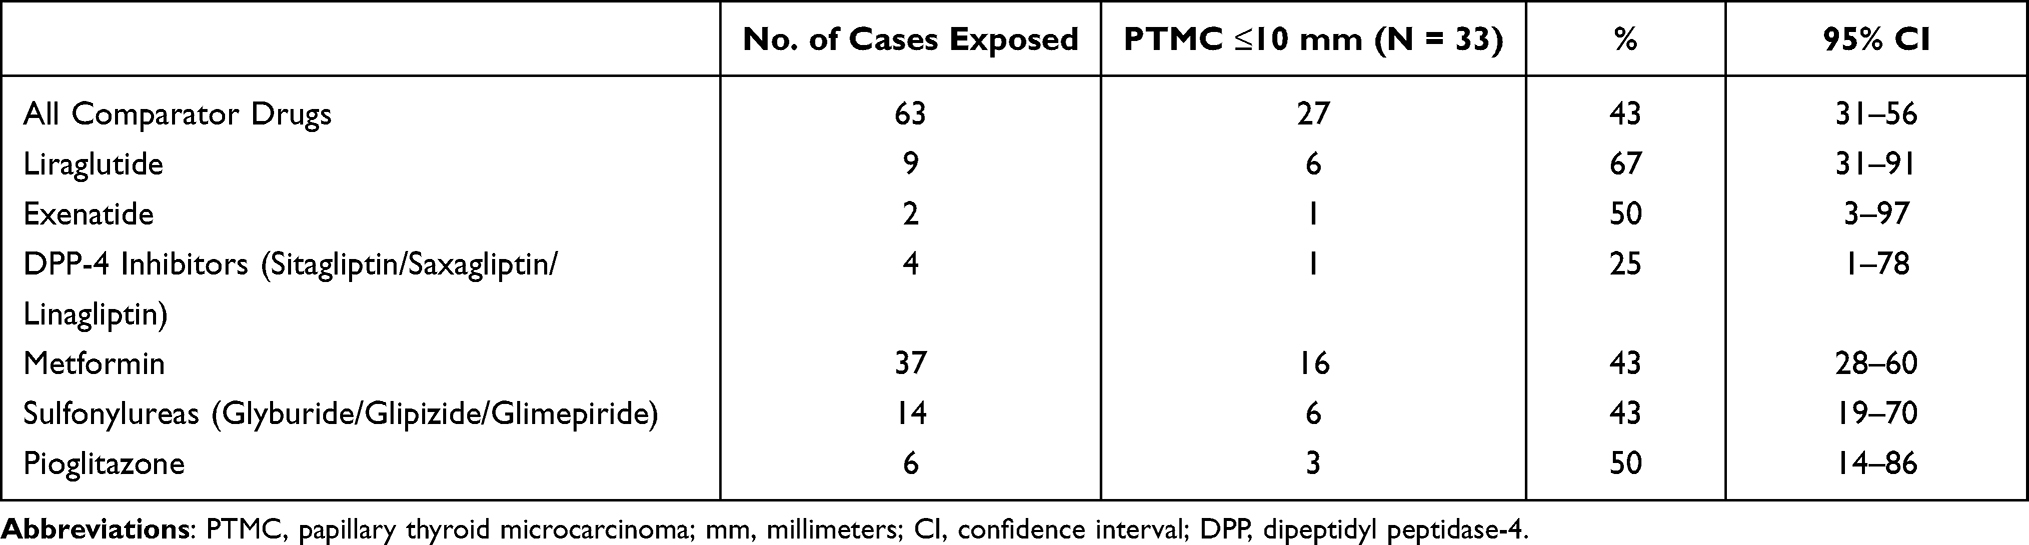 |
Table 3 Proportion of Papillary Thyroid Microcarcinomas by Exposure for All Chart-Adjudicated Cases |
Discussion
This 5-year prospective cohort study was designed to fulfill the FDA’s post-marketing requirement to quantify the risk of TC associated with liraglutide. Cohorts were constructed within an administrative claims database, and TC outcomes were validated through medical record review. Analyses addressed plausible sources of bias and compared therapies with different mechanisms of action. Overall, the data are consistent with no effect of liraglutide on the occurrence of TC. While RRs were elevated for several comparisons, there was a differential prevalence of papillary microcarcinomas and evidence of increased TC surveillance among the liraglutide cohort, especially shortly after its approval.
Limited and conflicting data are available on the association between GLP-1 RAs and TC. Published works refer primarily to an analysis of the FDA Adverse Event Reporting System data, which found higher TC reporting with exenatide (odds ratio [OR] 4.73).8 A more robust analysis found a significant increase in risk with exenatide (OR >3.0), although the report acknowledged limitations of spontaneous report data that affect both studies and represent plausible explanations for the findings.9 These limitations include heightened exenatide reporting arising from public awareness of concerns regarding TC and GLP-1 RAs and selective prescribing of exenatide due to its weight-lowering properties in obese patients who are at greater risk for TC.7,8,28,29 A meta-analysis of 25 longitudinal studies (22 randomized controlled trials, 3 retrospective cohort analyses, 775,602 patients) concluded that liraglutide was not associated with an increased risk of TC (liraglutide OR 1.54, 95% CI 0.40–6.02).30
Randomized trials cannot easily characterize rare outcomes. Even the relatively large Liraglutide Effect and Action in Diabetes: Evaluation of Cardiovascular Outcome Results (LEADER) trial could not achieve sufficient power to analyze TCs (5 TC cases with liraglutide and 3 with placebo).31 Intention to treat, TOD, and latency analyses were conducted in this study, and results were generally consistent with no increase in risk of TC among liraglutide initiators. The study findings support existing evidence that surveillance bias is likely when the AD is new to market.32,33 Among liraglutide-exposed cases, there was a larger proportion of PTMCs and shorter time to TC diagnosis, especially in the first 2 years of liraglutide’s availability.
This study has a number of strengths. The database source used is a commercial US health insurance plan, which allowed for a well-powered and generalizable analysis. The age distribution of the ORD is similar to that of the US population through age 64. Approximately 4.5% of members in the database are aged 65 and older, compared with approximately 13% of the US 2014 Census Population. Because it is one of the largest administrative healthcare databases in the US, the ORD supports surveillance on cohorts exposed to liraglutide and the study of rare outcomes. Moreover, while some healthcare products or services may be paid for out-of-pocket, the majority of services used for diagnosis and treatment of TC are likely to be reimbursed by the health plan and therefore, captured in the ORD. These results are representative of the US working population under age 65 and contribute external validity to this area of drug safety.
The 5-year study time period is sufficient to cover not only the time around initial drug approval (when provider uncertainty regarding the new therapy may result in shifting patient characteristics in the liraglutide group) but also considerable time after liraglutide became part of standard practice (when patient characteristics stabilize). The PS matching generated cohorts that were similar on a range of measurable covariates and addressed changing prescribing patterns and other temporal changes by applying the matching models throughout calendar time. Matching has also been shown to control for potential confounding in studies using claims data where markers for confounders are missing or incomplete.34,35 Additionally, TC cases were identified using an ORD-validated algorithm with a high PPV, rather than relying on a single ICD-9 code.
Similar to randomized clinical trials, the results of ITT analyses, where all cases and person-time are ascribed to patients’ initiation drug, are reported. Latency analyses provide further examination of the potential causal nature of observed associations while restricting analyses to more clinically relevant time periods. In contrast, TOD analyses classify subjects’ follow-up experience into categories defined by drugs dispensed. Crossovers between study drugs and discontinuation of treatment bring about changes in exposure category. In the TOD analysis, time off drug, which is typically months or years after cohort entry, could be informative about long-term residual effects of studied medications. Alternatively, time off drug could provide information about possible baseline imbalance in risks between study groups. The consistency of the findings from each of these multiple approaches and analyses yielded similar results, adding weight to the conclusions.
This study also had several limitations. Evaluation of single-therapy is limited because, while all patients were initiators of an AD, many were already on other therapies, some of which continued during the study period; even many naïve initiators were likely to add or switch AD therapies during follow-up. While TC outcomes were identified using an algorithm with a high PPV in the validation sub-study, only patients who had undergone a thyroidectomy were classified as cases. In the presence of different distributions of tumor size by exposure, this may be a source of differential misclassification, although the apparent sensitivity of the algorithm was high and the algorithm performed similarly for both microcarcinomas and larger tumors. Inadequate access to medical records reduced the number of cases with pathology data to the validation subset, restricting the ability to identify cancer type (eg, medullary) and classify cases by tumor size.
Exposure assessment was based on pharmacy claims and not actual use of AD therapies, although this approach has been validated and widely used.36,37 This potential discrepancy between the study definition of drug exposure and actual drug exposure is more likely in the ITT analysis where a single dispensing is adequate to establish an exposure category versus that of the TOD analysis where persons who repeatedly refill their medication (and therefore are more likely to be taking it) contribute more person-time to follow-up. Actual use of the drug is inferred from dispensings and may result in some misclassification of exposure, which is expected to be non-differential with respect to TC.
Median follow-up time was approximately 17 months, which may be too short to identify all potential cases since TC clinical development may require years. The broad inclusion of baseline variables in the PS directly addresses many known risk factors for TC by explicitly including them in the PS and thereby balancing them across the liraglutide and comparator cohorts. In addition, many of the risk factors for TC that were not explicitly included in the PS had proxy variables present among claims data that were included. Only a few variables that potentially represent unmeasured and therefore, unaddressed, confounding variables (at least among the known risk factors for TC) remain unaccounted for, most notably obesity. Further, the potential confounding effects of such variables are limited in the context of a PS-matched study, since such confounding would need to operate independently of the many variables that were included (and are therefore balanced between cohorts).20 Study results may be a consequence of uncontrolled confounding associated with the inability to adjust adequately for surveillance bias.
Liraglutide initiators are markedly different from initiators of other ADs, chiefly metformin. Propensity score-matched comparisons were made, for example, between liraglutide initiators and those metformin initiators who resemble liraglutide initiators. Nevertheless, for the liraglutide-metformin cohort in particular, because of the number of metformin users in the ORD, it was possible to identify sufficient PS-matched metformin initiators. Comparisons between certain drug cohorts should be made thoughtfully because remaining unmeasured differences in risk factors are more probable with some comparators.
In summary, improved study designs are warranted to ascertain any true causal associations for newly marketed drugs, like liraglutide, in the presence of surveillance bias. A number of analyses were conducted and were generally consistent with no increase in risk of TC among liraglutide initiators. Sensitivity analyses support the interpretation that the observed elevated point estimates likely resulted from surveillance bias.
Data Sharing Statement
Research data are proprietary and cannot be shared.
Acknowledgments
Findings from this study were presented at the 34th International Conference on Pharmacoepidemiology and Therapeutic Risk Management in Prague, Czech Republic as a poster presentation: Kathleen Mortimer, Donnie Funch, Li Zhou, Eva Ng, Atheline Major-Pedersen, Heidrun Bosch-Traberg, Helge Gydesen, David Dore. Propensity Score (PS) Matched Approaches to Estimate the Association Between Liraglutide Use and Thyroid Cancer (TC). Publication #1072. https://pharmacoepi.org/pub/?id=F17BF46A-D4E3-F6F2-827A-D6862969DD8B. The authors would like to acknowledge the contributions of Nicole Brooks for her project oversight and Tamar Aroyan and Danielle Cupka for their technical assistance in preparing this manuscript.
Author Contributions
All authors made a significant contribution to the work reported, whether that is in the conception, study design, execution, acquisition of data, analysis and interpretation, or in all these areas; took part in drafting, revising or critically reviewing the article; gave final approval of the version to be published; have agreed on the journal to which the article has been submitted; and agree to be accountable for all aspects of the work.
Funding
This study was funded by a research contract with Novo Nordisk A/S.
Disclosure
All Optum-affiliated researchers (Funch, Mortimer, Ziyadeh, Seeger, Zhou, Ng, Dore) received support from this contract. As part of this contract, Optum Epidemiology retains the right to publish all results. Funch, Ziyadeh, and Seeger were employed by Optum and hold stock/stock options in the parent company of Optum (UnitedHealth Group, Inc.). Seeger was also involved in a research contract with Boehringer-Ingelheim, during the conduct of the study. Dore was an employee and shareholder of UnitedHealth Group. Ross received payment from Novo Nordisk for case adjudication and for consulting services provided to Optum Epidemiology. He also reports that UBC Corp, which manages the safety monitoring for the Medullary Thyroid Cancer Consortium, pays him personal consultation fees for his time. Major-Pedersen, Bosch-Traberg, and Gydesen are employees of Novo Nordisk A/S. The authors report no other conflicts of interest in this work.
References
1. Victoza. NDA approval. US food and drug administration; 2010. Available from: http://www.accessdata.fda.gov/drugsatfda_docs/nda/2010/022341s000approv.pdf.
2. Bierre Knudsen L, Madsen LW, Andersen S, et al. Glucagon-like peptide-1 receptor agonists activate rodent thyroid C-cells causing calcitonin release and C-cell proliferation. Endocrinology. 2010;151(4):1473–1486. doi:10.1210/en.2009-1272
3. Gier B, Butler PC, Lai CK, et al. Glucagon like peptide-1 receptor expression in the human thyroid gland. J Clin Endocrinol Metab. 2012;97:121–131. doi:10.1210/jc.2011-2407
4. Cancer of the thyroid - cancer stat facts1; 2019. Available from: http://seer.cancer.gov/statfacts/html/thyro.html.
5. Wells SA, Asa SL, Dralle H, et al. American thyroid association guidelines task force on medullary thyroid carcinoma. Revised American Thyroid Association guidelines for the management of medullary thyroid carcinoma. Thyroid. 2015;25(6):567–610. doi:10.1089/thy.2014.0335
6. Gough SCL. Liraglutide from clinical trials to clinical practice. Diabetes Obes Metab. 2012;14:33–40. doi:10.1111/j.1463-1326.2012.01576.x
7. Chiu W-Y, Shih S-R, Tseng C-H. A review on the association between glucagon-like peptide-1 receptor agonists and thyroid cancer. Exp Diabetes Res. 2012;2012:1–7. doi:10.1155/2012/924168
8. Elashoff M, Matveyenko AV, Gier B, Elashoff R, Butler PC. Pancreatitis, pancreatic, and thyroid cancer with glucagon-like Peptide-1-based therapies. Gastroenterology. 2011;141(1):150–156. doi:10.1053/j.gastro.2011.02.018
9. Nauck MA, Friedrich N. Do GLP-1-based therapies increase cancer risk? Diabetes Care. 2013;36(Suppl 2):S245–S252. doi:10.2337/dcS13-2004
10. Gagel RF. Activation of G-protein-coupled receptors and thyroid malignant tumors: the jury is still out. Endocr Pract. 2011;17(6):957–959. doi:10.4158/EP.17.6.957
11. Ray WA. Evaluating medication effects outside of clinical trials: ‘new-user designs.’. Am J Epidemiol. 2003;158(9):915–920. doi:10.1093/aje/kwg231
12. Lund JL, Richardson DB, Stürmer T. The active comparator, new user study design in pharmacoepidemiology: historical foundations and contemporary application. Curr Epidemiol Rep. 2015;2(4):221–228. doi:10.1007/s40471-015-0053-5
13. Funch D, Mortimer K, Li L, et al. Is there an association between liraglutide use and female breast cancer in a real-world setting? Diabetes Metab Syndr Obes. 2018;11:791–806. doi:10.2147/DMSO.S171503
14. Gallwitz B, Bretzel RG. How do we continue treatment in patients with type 2 diabetes when therapeutic goals are not reached with oral antidiabetes agents and lifestyle? Incretin versus insulin treatment. Diabetes Care. 2013;36:S180–S189. doi:10.2337/dcS13-2012
15. Pasternak B, Wintzell V, Eliasson B, et al. Use of glucagon-like peptide 1 receptor agonists and risk of serious renal events: Scandinavian cohort study. Diabetes Care. 2020;43(6):1326–1335. doi:10.2337/dc19-2088
16. Rosenbaum PR, Rubin DB. The central role of the propensity score in observational studies for causal effects. Biometrika. 1983;70(1):41–55. doi:10.1093/biomet/70.1.41
17. Rubin DB, Thomas N. Matching using estimated propensity scores: relating theory to practice. Biometrics. 1996;52(1):249–264. doi:10.2307/2533160
18. D’Agostino RB. Propensity score methods for bias reduction in the comparison of a treatment to a non-randomized control group. Stat Med. 1998;17(19):2265–2281. doi:10.1002/(SICI)1097-0258(19981015)17:19<2265::AID-SIM918>3.0.CO;2-B
19. Gu X, Rosenbaum PR. Comparison of multivariate matching methods: structures, distances, and algorithms. J Comput Graph Stat. 1993;2:405–420.
20. Eng PM, Seeger JD, Loughlin J, et al. Supplementary data collection with case-cohort analysis to address potential confounding in a cohort study of thromboembolism in oral contraceptive initiators matched on claims-based propensity scores. Pharmacoepidemiol Drug Saf. 2008;17:297–305. doi:10.1002/pds.1554
21. Parsons LS. Reducing bias in a propensity score matched-pair sample using greedy matching techniques. Paper 214-26 in proceedings of the twenty-sixth annual SAS users group international conference. Long Beach, California: SAS Institute, Inc; 2001. Available from: http://www2.sas.com/proceedings/sugi26/p214-26.pdf.
22. Funch D, Ross D, Gardstein BG, et al. Performance of claims-based algorithms for identifying incident thyroid cancer in commercial health plan enrollees receiving antidiabetic drug therapies. BMC Health Serv Res. 2017;17(1):330. doi:10.1186/s12913-017-2259-3
23. Austin PC. Comparing paired vs non-paired statistical methods of analyses when making inferences about absolute risk reductions in propensity-score matched samples. Stat Med. 2011;30(11):1292–1301. doi:10.1002/sim.4200
24. Ho AD, Davies L, Nixon IJ, et al. Increasing diagnosis of subclinical thyroid cancers leads to spurious improvements in survival rates. Cancer. 2015;121:1793–1799. doi:10.1002/cncr.29289
25. Vaccarella S, Franceschi S, Bray F, et al. Worldwide thyroid-cancer epidemic? The increasing impact of overdiagnosis. N Engl J Med. 2016;375(7):614–617. doi:10.1056/NEJMp1604412
26. Kalifzewski K, Wojtczak B, Strutyńska-Karpińska M, Łukieńczuki T, Forkasiewicz Z, Domosławski P. Incidental and non-incidental thyroid microcarcinoma. Oncol Lett. 2016;12:734–740. doi:10.3892/ol.2016.4640
27. Vasileiadis I, Karatzas T, Vasileiadis D, et al. Clinical and pathological characteristics of incidental and nonincidental papillary thyroid microcarcinoma in 339 patients. Head Neck. 2014;36(4):564–570. doi:10.1002/hed.23333
28. Hwang Y, Lee KE, Park YJ, et al. Annual average changes in adult obesity as a risk factor for papillary thyroid cancer. Medicine. 2016;95(9):e2893. doi:10.1097/MD.0000000000002893
29. Kitahara CM, Platz EA, Beane-Freeman LE, et al. Obesity and thyroid cancer risk among U.S. men and women: a pooled analysis of five prospective studies. Cancer Epidemiol Biomarkers Prev. 2011;20(3):464–472. doi:10.1158/1055-9965.EPI-10-1220
30. Alves C, Batel-Marques F, Macedo AF. A meta-analysis of serious adverse events reported with exenatide and liraglutide: acute pancreatitis and cancer. Diabetes Res Clin Pract. 2012;98(2):271–284. doi:10.1016/j.diabres.2012.09.008
31. Marso SP, Daniels GH, Brown-Frandsen K, et al. Liraglutide and cardiovascular outcomes in type 2 diabetes. N Engl J Med. 2016;374:311–322. doi:10.1056/NEJMoa1603827
32. Andersson C, Vaag A, Selmer C, et al. Risk of cancer in patients using glucose-lowering agents: a nationwide cohort study of 3.6 million people. BMJ Open. 2012;2:e000433. doi:10.1136/bmjopen-2011-000433
33. Carstensen B, Witte DR, Friis S. Cancer occurrence in Danish diabetic patients: duration and insulin effects. Diabetologia. 2012;55(4):948–958. doi:10.1007/s00125-011-2381-4
34. Seeger JD, Kurth T, Walker AM. Use of propensity score technique to account for exposure-related covariates. Med Care. 2007;45:S143–S148. doi:10.1097/MLR.0b013e318074ce79
35. Schneeweiss S, Rassen JA, Glynn RJ, Avorn J, Mogrun H, Brookhart MA. High-dimensional propensity score adjustment in studies of treatment effects using health care claims data. Epidemiology. 2009;20(4):512–522. doi:10.1097/EDE.0b013e3181a663cc
36. West SL, Savitz DA, Koch G, Strom BL, Guess HA, Hartzema A. Recall accuracy for prescription medications: self-report compared with database information. Am J Epidemiol. 1995;142(10):1103–1112. doi:10.1093/oxfordjournals.aje.a117563
37. West SL, Strom BL, Freundlich B, Normand E, Koch G, Savitz DA. Completeness of prescription recording in outpatient medical records from a health maintenance organization. J Clin Epidemiol. 1994;47(2):165–171. doi:10.1016/0895-4356(94)90021-3
 © 2021 The Author(s). This work is published and licensed by Dove Medical Press Limited. The full terms of this license are available at https://www.dovepress.com/terms.php and incorporate the Creative Commons Attribution - Non Commercial (unported, v3.0) License.
By accessing the work you hereby accept the Terms. Non-commercial uses of the work are permitted without any further permission from Dove Medical Press Limited, provided the work is properly attributed. For permission for commercial use of this work, please see paragraphs 4.2 and 5 of our Terms.
© 2021 The Author(s). This work is published and licensed by Dove Medical Press Limited. The full terms of this license are available at https://www.dovepress.com/terms.php and incorporate the Creative Commons Attribution - Non Commercial (unported, v3.0) License.
By accessing the work you hereby accept the Terms. Non-commercial uses of the work are permitted without any further permission from Dove Medical Press Limited, provided the work is properly attributed. For permission for commercial use of this work, please see paragraphs 4.2 and 5 of our Terms.