")
Back to Journals » Diabetes, Metabolic Syndrome and Obesity » Volume 15
Risk Factors for Nonalcoholic Fatty Liver Disease in Postmenopausal Women with Type 2 Diabetes Mellitus and the Correlation with Bone Mineral Density at Different Locations
Authors Du YJ, Liu NN, Zhong X, Pan TR
Received 14 March 2022
Accepted for publication 31 May 2022
Published 21 June 2022 Volume 2022:15 Pages 1925—1934
DOI https://doi.org/10.2147/DMSO.S364804
Checked for plagiarism Yes
Review by Single anonymous peer review
Peer reviewer comments 3
Editor who approved publication: Professor Ming-Hui Zou
Yi-Jun Du, Ni-Na Liu, Xing Zhong, Tian-Rong Pan
Department of Endocrinology, The Second Hospital of Anhui Medical University, Hefei, People’s Republic of China
Correspondence: Tian-Rong Pan, Department of Endocrinology, The Second Hospital of Anhui Medical University, No. 678 of Furong Road, Jingkai District, Hefei, 230601, People’s Republic of China, Tel +86 15305609568, Email [email protected]
Objective: To explore the risk factors for nonalcoholic fatty liver disease (NAFLD) in postmenopausal women with type 2 diabetes mellitus (T2DM) and the correlation with bone mineral density (BMD) in different areas of the body.
Methods: A total of 434 postmenopausal women with T2DM were enrolled and categorized as 198 patients in the NAFLD group and 236 patients in the non-NAFLD group based on color Doppler ultrasound of the liver. The BMD of the lumbar spine, femoral neck, and total hip were measured by dual-energy X-ray absorptiometry.
Results: In postmenopausal women with T2DM, the prevalence of NAFLD was 45.6%. The body mass index (BMI), systolic blood pressure (SBP), glycosylated hemoglobin (HbA1c), alanine aminotransferase (ALT), aspartate aminotransferase (AST), gamma-glutamyl transpeptidase (GGT), triacylglycerol (TG), uric acid (UA), and homeostatic model assessment for insulin resistance (HOMA-IR) C-peptide (CP) were significantly higher in the NAFLD group than in the non-NFALD group, and the duration of diabetes, and high-density lipoprotein cholesterol (HDL-C) were lower than in the non-NAFLD group (P < 0.05). Logistic regression analysis revealed that BMI (odds ratio [OR] = 1.303, 95% confidence interval [CI]: 1.152– 1.346), HbA1c (OR = 1.263, 95% CI: 1.095– 1.392), TG (OR = 1.263, 95% CI: 1.031– 1.601), and SUA (OR = 1.005, 95% CI: 1.001– 1.007) were correlated with NAFLD (P < 0.05). The BMD of the total hip and femoral neck in the NAFLD group was higher than in the non-NAFLD group (P < 0.05).
Conclusion: Complicated NAFLD in postmenopausal women with T2DM is associated with weight gain, poor blood glucose control, abnormal lipid metabolism, and elevated UA levels. In addition, the NAFLD group had higher femoral neck and total hip BMD than the non-NAFLD group, suggesting NAFLD in postmenopausal women with T2DM may reduce the risk of osteoporosis.
Keywords: postmenopausal period, type 2 diabetes mellitus, nonalcoholic fatty liver disease, bone mineral density
Introduction
Non-alcoholic fatty liver disease (NAFLD) refers to the excessive deposition of fat in the liver caused by alcohol and other definite factors of liver damage. This metabolic liver injury is closely related to insulin resistance (IR) and genetic susceptibility, including nonalcoholic hepatic steatosis, nonalcoholic hepatitis, liver cirrhosis, and hepatocellular carcinoma.1 Non-alcoholic fatty liver disease is a global epidemic, and its incidence is increasing annually. The correlation between NAFLD and various diseases has been studied in depth. A study published recently on the epidemiology of NAFLD in Asia revealed that in the general population on the Chinese mainland, its prevalence was 29.81%, while it was as high as 52.55% in patients with diabetes.2 The latest (2017) epidemiological survey of the Chinese Center for Disease Control reported 116.4 million adult patients with diabetes in China; the prevalence was as high as 10.9%, and the prevalence rate in women was 10.2%.3 Therefore, studying the factors of NAFLD associated with T2DM to identify the related risk factors for intervention has become a focal point of medical research.
As a component of metabolic syndrome, NAFLD is closely related to diabetes mellitus, lipid metabolism disorder, and IR. Often, the abnormal metabolism of glucose and lipids is combined with systemic and metabolic bone disease. Osteoporosis is a metabolic bone disease that increases bone fragility and makes bones prone to fracture by decreasing bone mass and destroying the microstructure of bone tissue. In recent years, the correlation between NAFLD and osteoporosis has attracted increasing research attention. A network of complex interactions exists between the liver and bone. However, the correlation between NAFLD and osteoporosis remains unclear, and results from different studies are inconsistent.4–7 In the current study, the correlation between NAFLD and osteoporosis is still unclear, and results from different studies are inconsistent.4–7 Previous studies revealed that in patients with NAFLD, the bone mineral density (BMD) of the lumbar spine, hip, and other areas decreased significantly. Accordingly, it was considered that NAFLD could cause a reduction in both BMD and bone mass. This reduction is related to osteoporosis,4,5 of which postmenopausal women are at increased risk.4 Conversely, a previous study revealed that patients with NAFLD had increased BMD of the entire body, lumbar spine, and other areas.6,7
The prevalence of NAFLD is related closely to age, and its prevalence rate in postmenopausal women increases significantly with age. A previous Chinese study revealed the incidence rates of NAFLD in women aged <45 years, women aged between 45–55 years, and women aged >55 years to be 5.3%, 18.8%, and 27.8%, respectively.8 Another study in Hong Kong revealed that in the baseline NAFLD-free population, the prevalence of NAFLD during a 34–60-month observation period was 3.6% in women aged <40 years and 12.7% in women >40 years.9 The same results were reported in a large-sample cross-sectional study in South Korea.10
Being a postmenopausal woman and having type 2 diabetes mellitus (T2DM) are risk factors for osteoporosis and osteoporotic fractures.11,12 However, few studies exist on NAFLD and its correlation with BMD in postmenopausal women with T2DM. Therefore, the present study investigated the risk factors for NAFLD by analyzing the prevalence and clinical data of NAFLD and osteoporosis in 434 postmenopausal women with T2DM.
Materials and Methods
General Data
A total of 434 patients who were hospitalized at the Department of Endocrinology of the Second Hospital of Anhui Medical University from January 2016 to December 2018 were enrolled in this study. The inclusion criteria were (1) patients with T2DM, (2) postmenopausal women aged 46–87 years, and (3) a 0–36-year duration of diabetes. The exclusion criteria were (1) patients with severe diabetic acute complications, (2) those who were long-term heavy drinkers (≥70 g/W), (3) those with viral hepatitis, drug-induced liver disease, or autoimmune liver disease, (4) those with thyroid, parathyroid, or other endocrine diseases, (5) those with diseases affecting bone metabolism or the long-term use of glucocorticoids or other drugs affecting bone metabolism, and (6) patients with severe systemic diseases who were bedridden long term. All the included patients underwent abdominal color Doppler ultrasonography at our hospital and were assigned to either the NAFLD (198 cases, 45.6%) or non-NAFLD (236 cases, 54.4%) group. The baseline data and the examination results of biochemical indicators were collected simultaneously.
Diagnostic Criteria
(1) The diagnosis of T2DM was made according to the criteria recommended by the American Diabetes Association in 2010.13 (2) The diagnosis of NAFLD was made according to the Clinical Diagnostic Criteria of the 2017 Asia–Pacific Guidelines for Nonalcoholic Fatty Liver.14 (3) Osteoporosis was diagnosed according to the diagnostic criteria of the World Health Organization.15 Dual-energy X-ray absorptiometry (DEXA) was used to measure BMD. Normal bone mass is the ratio of BMD to healthy sex-matched peak bone mass greater than a standard deviation (SD) of 1, ie, a t-value > −1.0 SD, osteopenia: –2.5 SD < t-value ≤ –1.0 SD, and osteoporosis: t-value ≤ –2.5 SD. (4) Coronary heart disease (CHD) was diagnosed according to the American Heart Association (AHA)/American College of Cardiology guidelines for CHD.16 (5) Hypertension was diagnosed according to the 2018 European Guidelines for Hypertension Management criteria.17 (6) Stroke was diagnosed according to the criteria of the AHA/ASA.18 (7) Finally, hyperuricemia was diagnosed according to the diagnostic criterion of blood uric acid (UA) levels > 7 mg/dl.19
This study was reviewed and approved by the Medical Research Ethics Committee of the Second Hospital of Anhui Medical University.
Research Methods
General Data Measurement
The height, weight, systolic blood pressure (SBP), and diastolic blood pressure (DBP) of all subjects were measured, and each subject’s body mass index (BMI) was calculated as BMI = weight (kg)m/height2 (m2). The age and course of T2DM were recorded.
Determination of Biochemical Indices
All subjects fasted for 12 hours, and their fasting venous blood samples were collected during the morning of the following day. Fasting blood glucose (FPG) measurements were obtained using a Beckman AU5831 automatic biochemical analyzer (Beckman Coulter, USA). Alanine aminotransferase (ALT), aspartate aminotransferase (AST), gamma-glutamyl transpeptidase (GGT), alkaline phosphatase (ALP), triacylglycerol (TG), total cholesterol (TCH), low-density lipoprotein cholesterol (LDL-C), high-density lipoprotein cholesterol (HDL-C), creatinine (Cr), UA, blood calcium, and blood phosphorus were all measured. The patients’ 2-hour postprandial blood glucose (2hPG) levels were determined from blood drawn intravenously 2 hours after a meal. Glycosylated hemoglobin (HbA1c) was detected using an ARKRAY HA-8180 glycosylated hemoglobin analyzer (ARKRAY, Japan). The fasting C-peptide (FCP) level was detected using a Roche E601 electrochemiluminescence analyzer (Roche, Switzerland). Random urine was collected, and the urine albumin–Cr ratio (uACR) was measured using a Siemens BN-II specific protein analyzer (Siemens, Germany). The estimated glomerular filtration rate (eGFR) was assessed using the modified and simplified Modification of Diet in Renal Disease formula for China: eGFR = 175 × (SCr)–1.234 × (age)–0.179 × (0.79 female). Because most of the study subjects had received insulin treatment, FCP and C-peptide levels were used instead of the modified insulin homeostatic model assessment (HOMA) formula to evaluate and calculate the IR index: HOMA for IR (HOMA-IR) (CP) = 1.5 + FPG (mmol/L) × FCP (pmol/L)/2800.
Bone Mineral Density Measurement
The BMD of the lumbar spine 1–4 (L1–4), the femoral neck of the left hip, and the total hip were measured in all study subjects using a Lunar Prodigy DEXA (GE, USA) instrument.
Statistical Processing
This study was conducted as a cross-sectional observational study. Its sample size estimation formula is presented in Eq. (1) below:
where Z 1 − α/2 = 1.96, δ represents the allowable error (0.05), and p represents the predicted prevalence. According to the literature review, the predicted prevalence of NAFLD in postmenopausal women with diabetes is 40%. Therefore, the sample size was calculated as n = (1.96/0.05)2 * 0.4 * (1–0.4) = 368. To reduce the influence of sampling errors on the results, a total of 434 subjects were recruited.
Data were statistically analyzed using SPSS 22.0 software (IBM). Measurement data that conformed to a normal distribution were expressed as mean ± SD, and the difference between the two groups was analyzed using an independent-sample t-test. Measurement data that did not conform to a normal distribution were expressed by the medium (P25 - P75), and the comparison between the groups was analyzed using Wilcoxon’s rank - sum test. The correlation between BMD and the variables was analyzed using Pearson’s correlation test, and count data were compared using the Chi-squared test. The significant variables in the univariate analysis were included in the regression model, and a multivariate analysis was conducted using binary logistic regression. The inspection level was set at α = 0.05. A value of P < 0.05 was considered statistically significant.
Results
Comparison of General Data and Biochemical Indices Between the Two Groups
The measurements for BMI, SBP, HbA1c, ALT, AST, GGT, TG, UA, and HOMA-IR (CP) were significantly higher in the NAFLD group than in the non-NFALD group, and the duration of diabetes and HDL-C were both lower than in the non-NAFLD group (P < 0.05, Table 1).
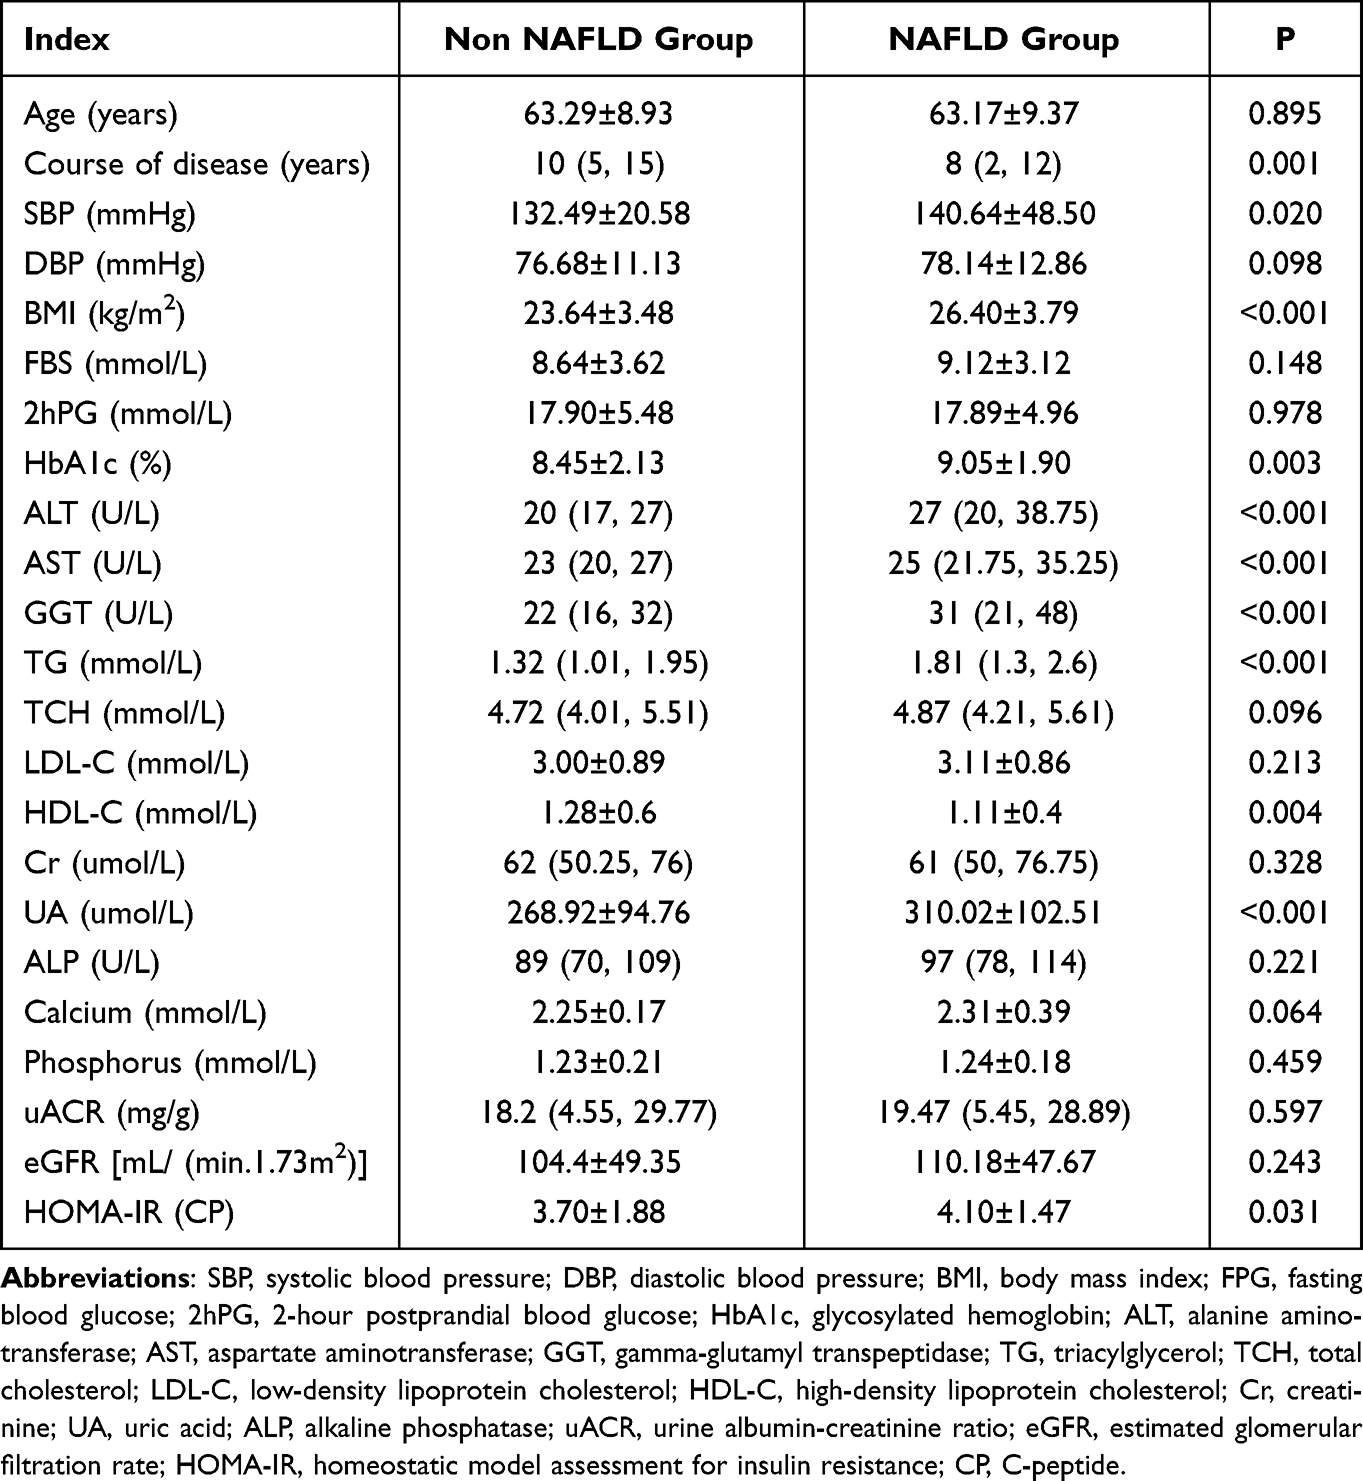 |
Table 1 Comparison of General Data and Biochemical Indexes Between the Two Groups |
Logistic Regression Analysis of Related Factors for Nonalcoholic Fatty Liver Disease in Postmenopausal Women with Type 2 Diabetes Mellitus
The regression model was established using NAFLD as the dependent variable; the independent variables were age, duration of diabetes, SBP, DBP, BMI, FPG, 2hPG, HbA1c, ALT, AST, GGT, TG, TCH, LDL-C, HDL-C, SCr, SUA, ALP, blood calcium, blood phosphorus, uACR, eGFR, and HOMA-IR (CP). The results revealed that in the postmenopausal women with T2DM, the duration of diabetes, SBP, BMI, HbA1c, ALT, GGT, TG, HDL-C, SUA, and HOMA-IR (CP) was correlated with NAFLD (P < 0.05, Table 2). The indicators with statistical significance in the univariate analysis were included in the regression as independent variables to establish the binary logistic regression model using the enter method. The logistic regression analysis revealed that in the postmenopausal women with T2DM, the measurements for BMI (odds ratio [OR] = 1.303, 95% confidence interval [CI]: 1.152–1.346), HbA1c (OR = 1.263, 95% CI: 1.095–1.392), TG (OR = 1.263, 95% CI: 1.031–1.601), and SUA (OR = 1.005, 95% CI: 1.001–1.007) were correlated with NAFLD (P < 0.05, Table 3).
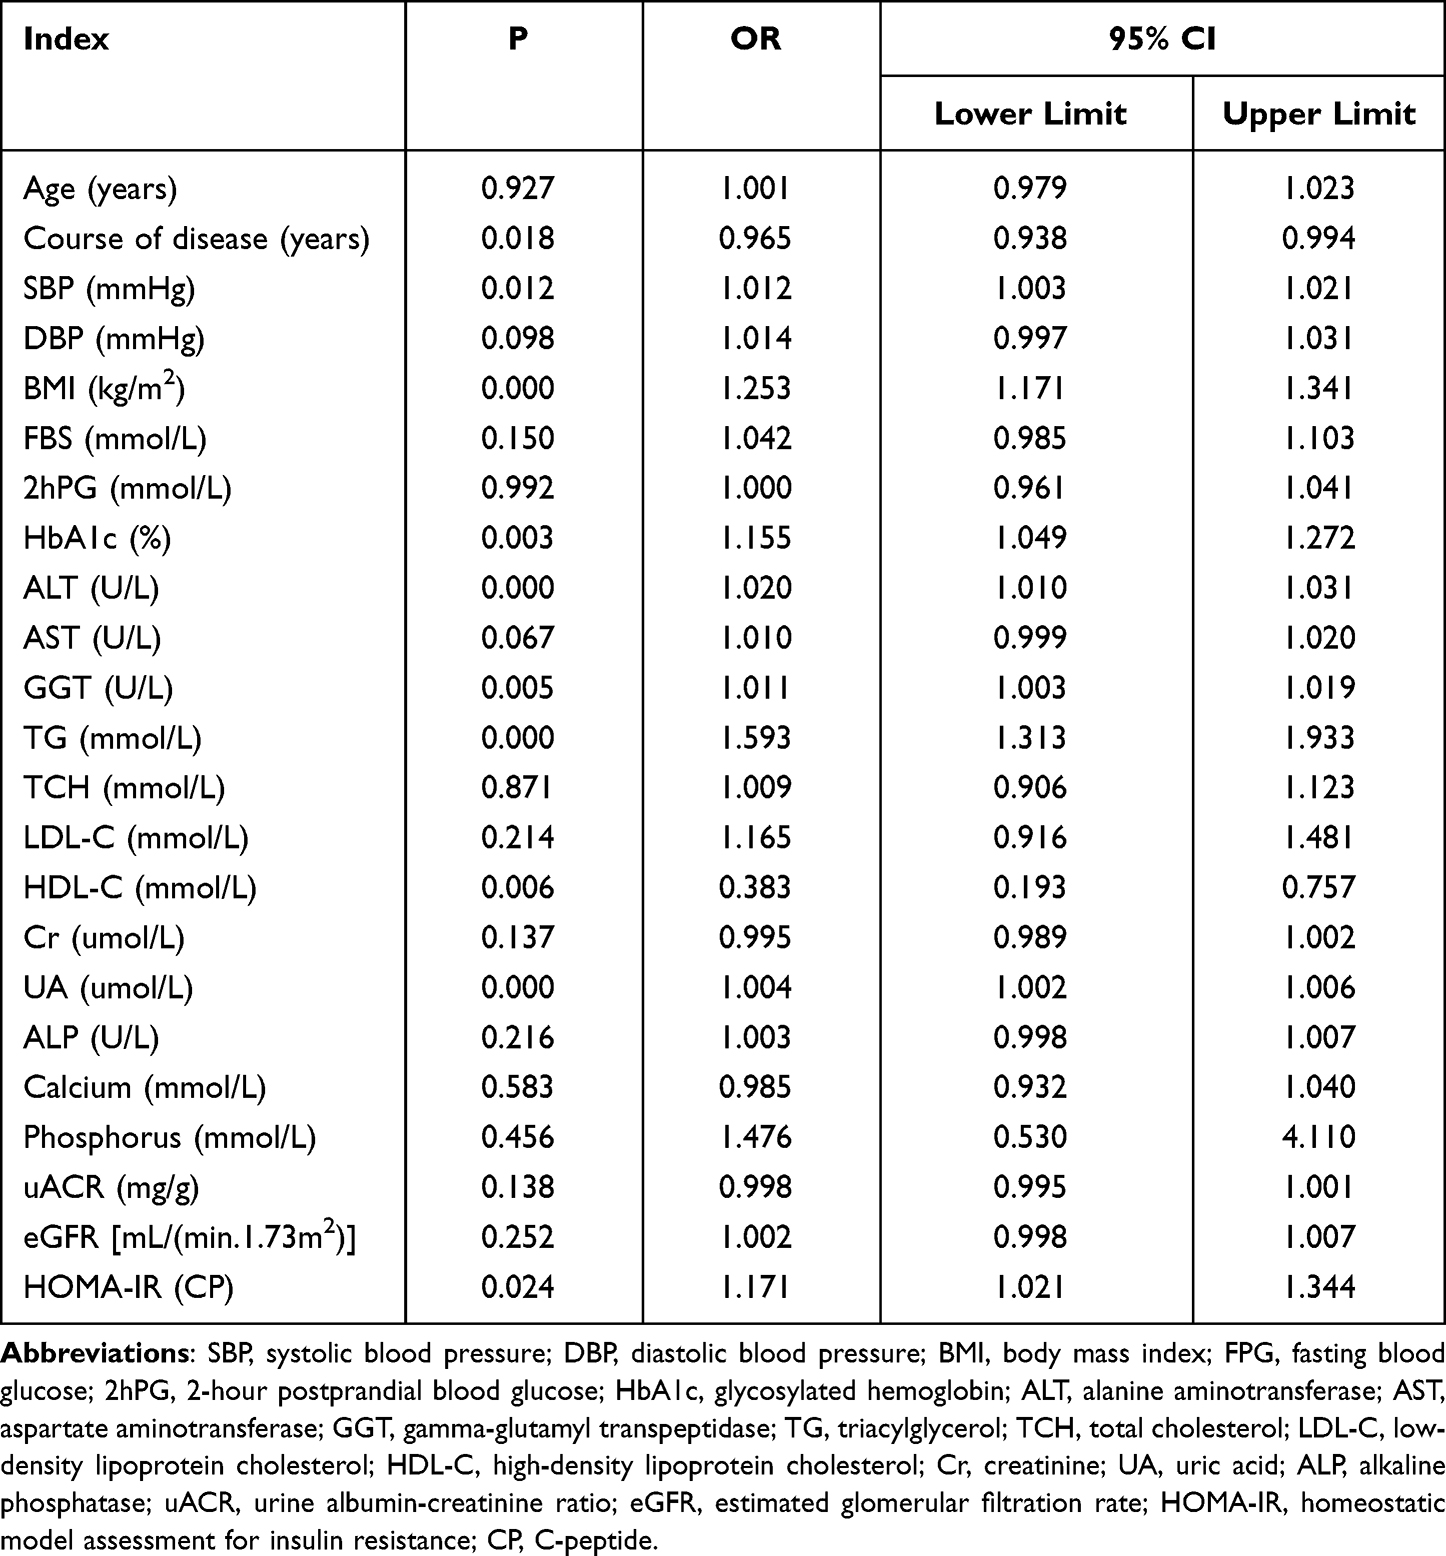 |
Table 2 Univariate Logistic Regression Analysis of Related Factors for NAFLD in Postmenopausal Women with T2DM |
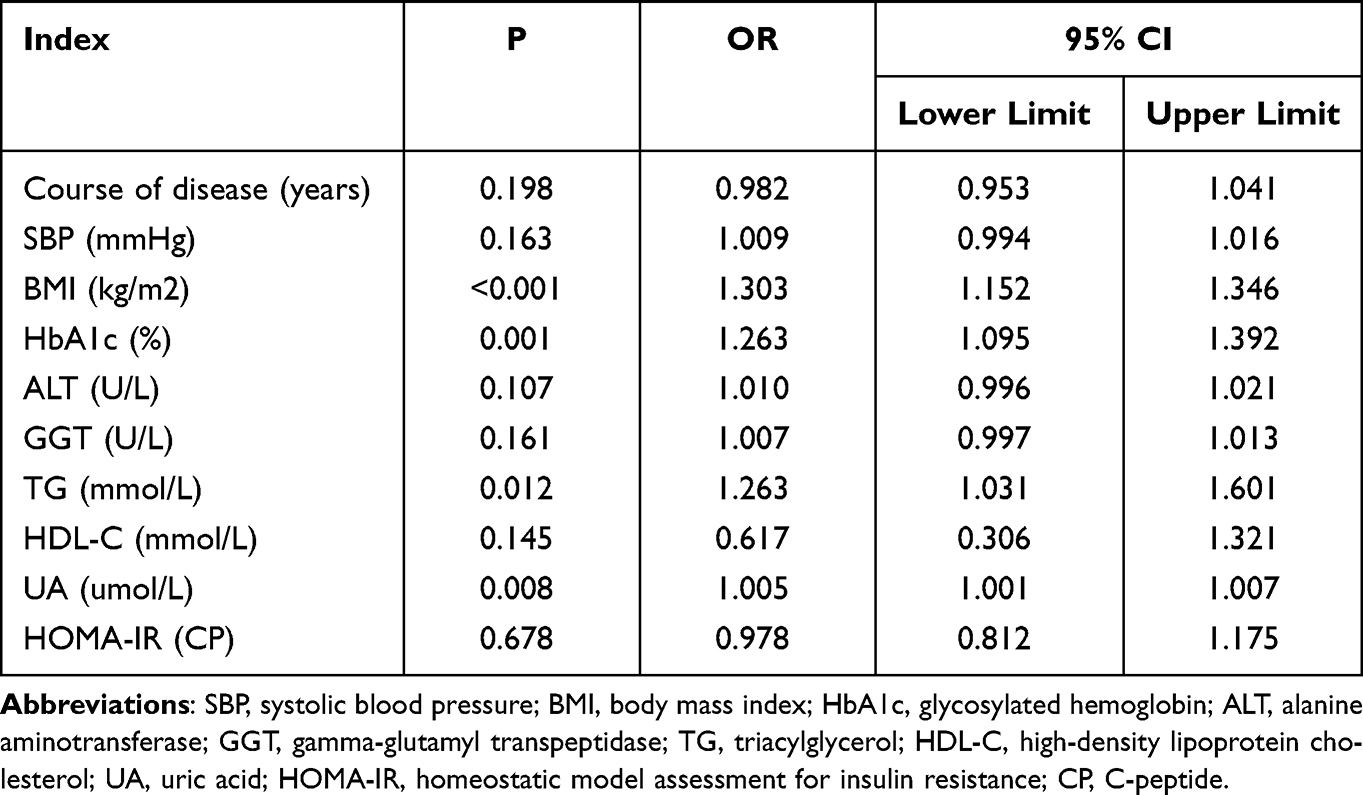 |
Table 3 Multivariate Logistic Regression Analysis of Related Factors for NAFLD in Postmenopausal Women with T2DM |
Comparison of the Prevalence of Chronic Complications of Diabetes Mellitus Between the Two Groups
The prevalence of diabetic peripheral vascular disease in the NAFLD group was higher than in the non-NAFLD group (P < 0.05). There were no significant differences in the prevalence of diabetic retinopathy, diabetic nephropathy, and diabetic neuropathy between the two groups (P > 0.05). The prevalence of hypertension and hyperuricemia in the NAFLD group was higher than in the non-NAFLD group (P < 0.05). The prevalence of CHD and stroke in the NAFLD group was higher than in the non-NAFLD group, and the differences were not statistically significant (P > 0.05, Table 4).
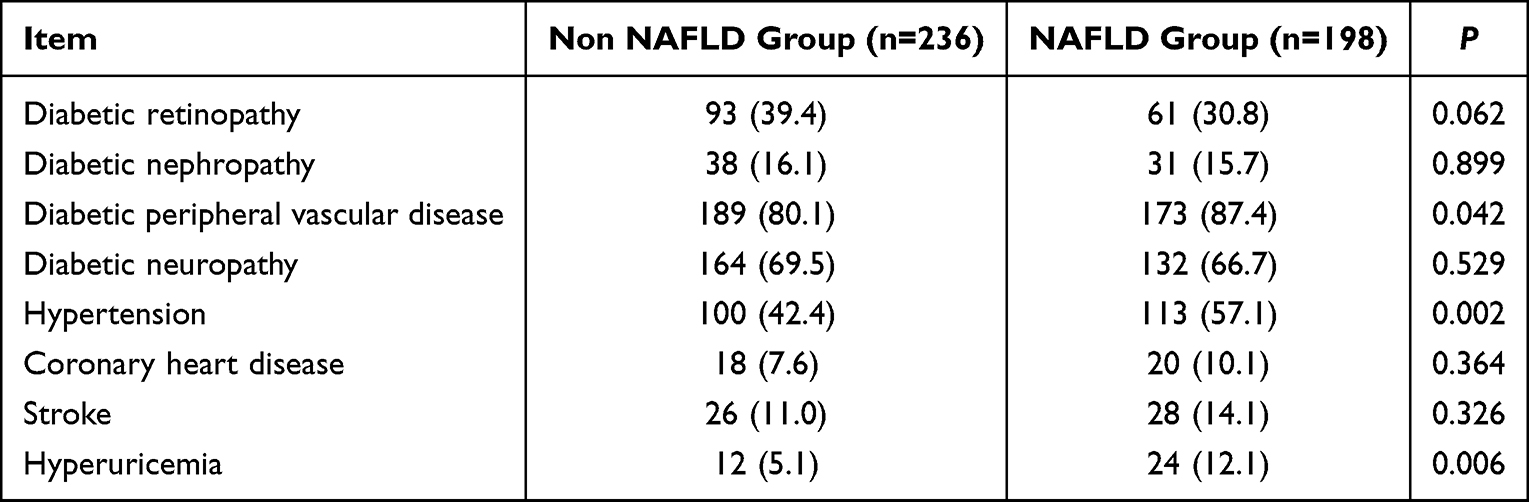 |
Table 4 Comparison of Prevalence of Chronic Complications and Comorbidities of Diabetes Mellitus Between Two Groups [n(%)] |
Comparison of the Prevalence of Osteoporosis Between the Two Groups
The prevalence of osteoporosis in the NAFLD group was lower than in the non-NAFLD group, and the difference was not statistically significant (P > 0.05, Table 5).
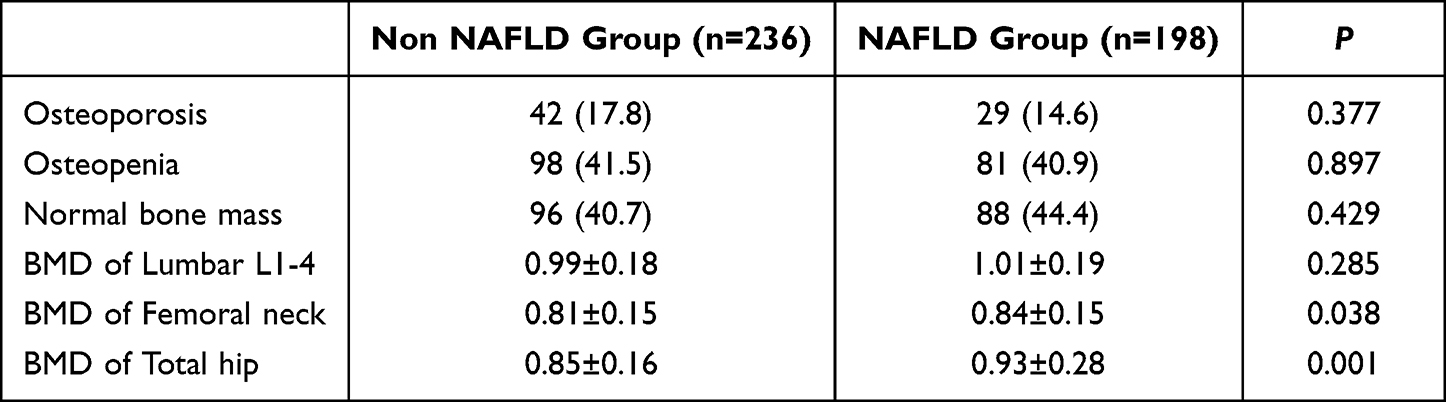 |
Table 5 Comparison of the Prevalence of Osteoporosis [n(%)] and Bone Mineral Density in Different Parts Between the Two Groups |
Comparison of Bone Mineral Density in Different Areas Between the Two Groups
The BMD of the total hip and femoral neck in the NAFLD group was higher than in the non-NAFLD group (P < 0.05). The difference in the BMD of L1–4 between the two groups was not statistically significant (Table 5).
Correlation of Bone Mineral Density in Postmenopausal Women with Type 2 Diabetes Mellitus and Nonalcoholic Fatty Liver Disease
In the postmenopausal women with T2DM complicated with NAFLD, the lumbar BMD was negatively correlated with age and positively correlated with BMI. The BMD of the femoral neck was negatively correlated with age and disease course. The BMD of the total hip was positively correlated with HDL (P < 0.05), as shown in Table 6.
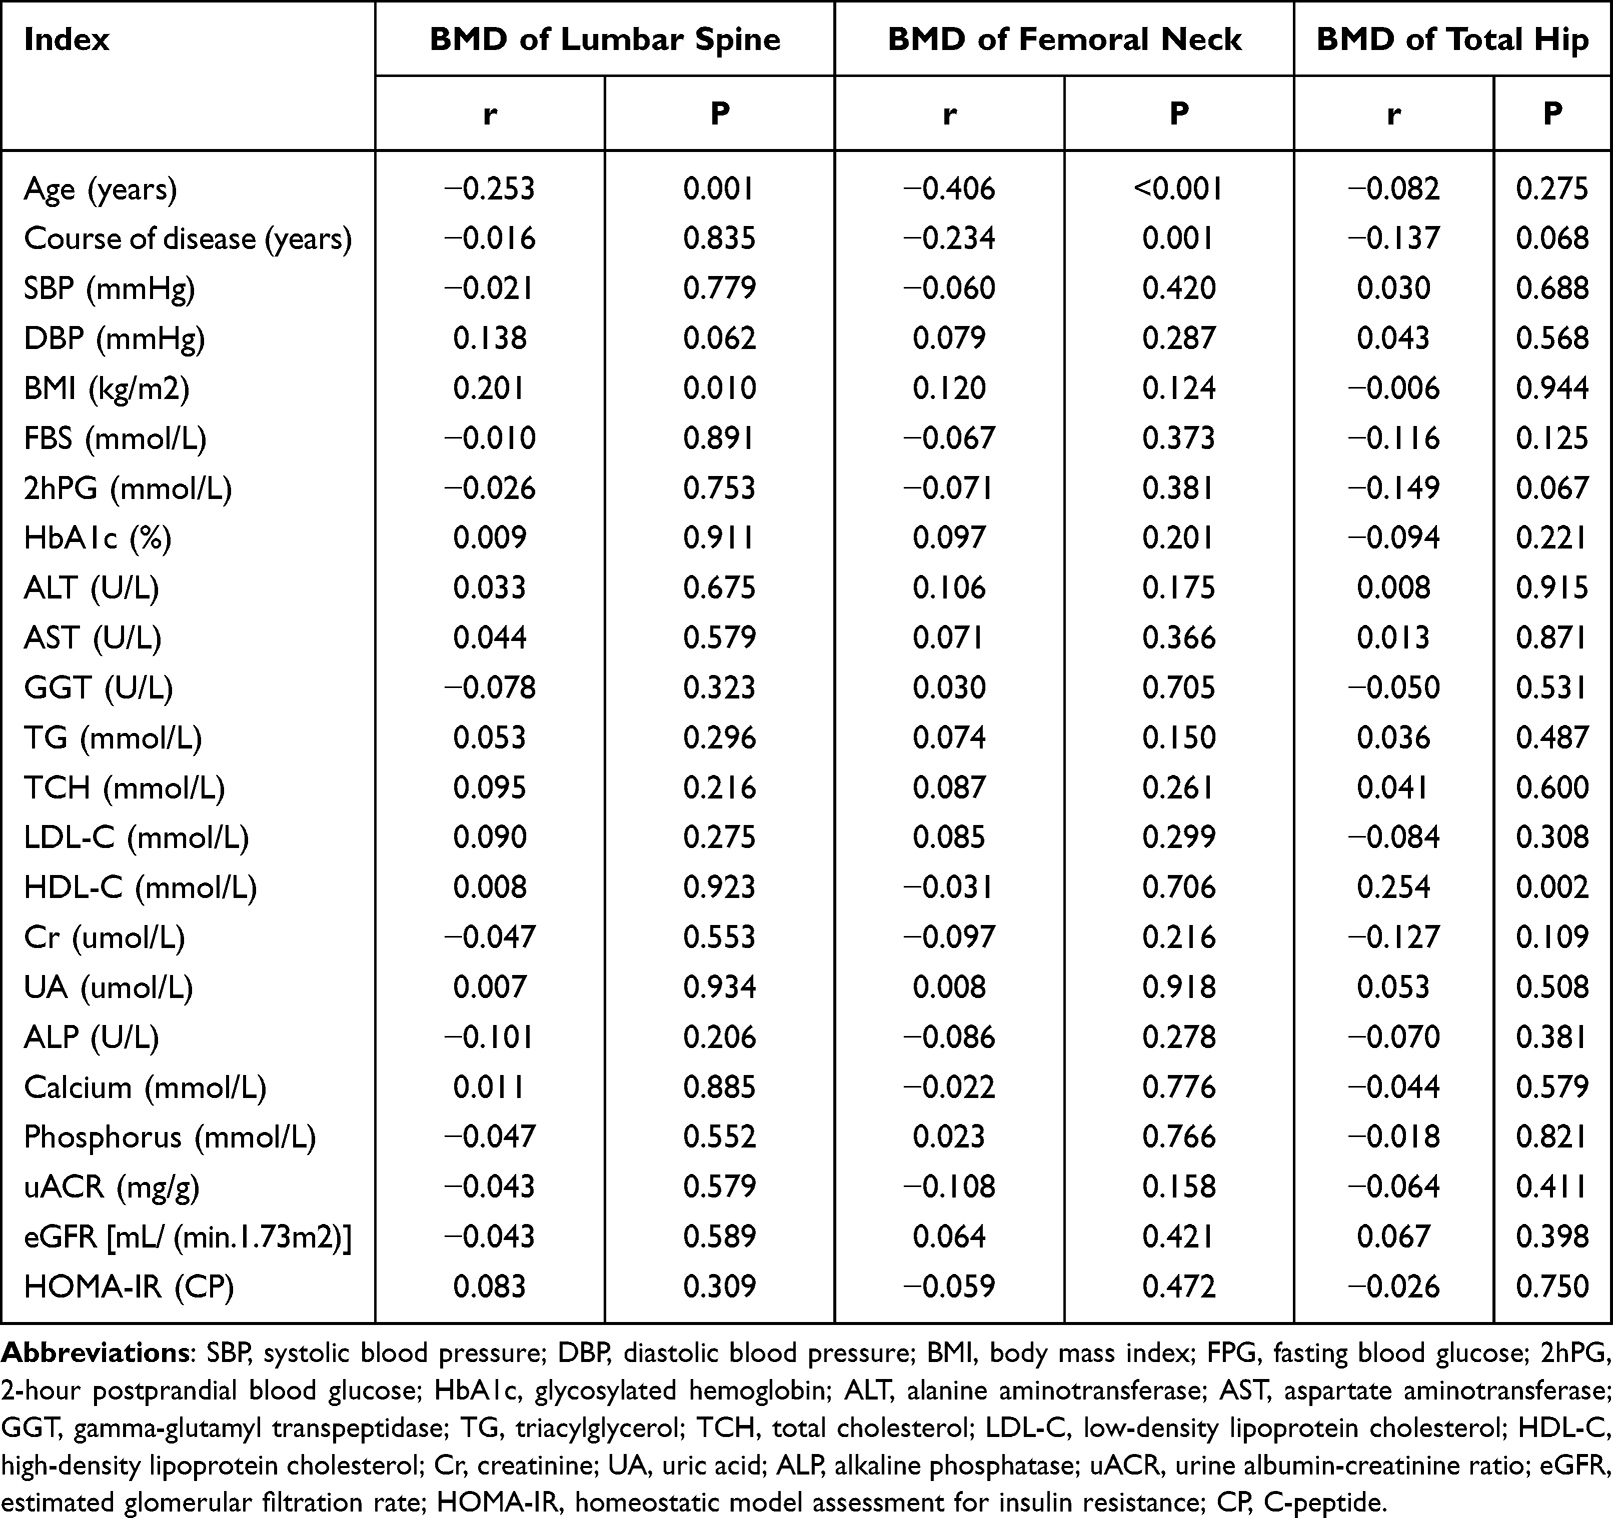 |
Table 6 Correlation of BMD in Postmenopausal T2DM Women Complicated with NAFLD |
Discussion
This study aimed to explore the risk factors for NAFLD and the association with BMD in the specific population of postmenopausal women with diabetes. The results revealed that the prevalence of NAFLD in the postmenopausal women with T2DM studied was 45.6%. In the postmenopausal patients with T2DM, NAFLD was closely related to being overweight or obese and having poor blood glucose control, lipid metabolism disorder, and hyperuricemia. Postmenopausal women with T2DM and NAFLD have a higher prevalence of diabetic peripheral vascular disease, hypertension, and hyperuricemia.
The prevalence of osteoporosis in the postmenopausal women with T2DM was 16.4% (14.6% and 17.8% in the NAFLD and non-NAFLD groups, respectively). Although there was no significant difference in the prevalence of osteoporosis between the two groups, the BMD of the total hip and femoral neck in the NAFLD group was higher than in the non-NAFLD group, indicating that NAFLD in postmenopausal women with T2DM may reduce the risk of osteoporosis.
Nonalcoholic fatty liver disease and the components of metabolic syndromes, such as obesity, T2DM, hypertension, and dyslipidemia, are both the cause and effect of each other. Metabolic syndrome in the liver is embodied by NAFLD, and IR forms the basis for the common pathogenesis of various metabolic syndromes and NAFLD.20,21 A prospective study involving 500,000 Chinese adults revealed that the prevalence of NAFLD in patients with diabetes was higher than in patients without diabetes.22 A Swedish study involving more than 1.2 million young males aged 17–19 with an average follow-up of 28.5 years revealed that being overweight or obese in youth increased the risk of severe liver disease. Males with both obesity and diabetes had higher risks for severe liver disease than those without diabetes, indicating that diabetes and obesity promote severe liver disease.23
Ma et al revealed that increased HbA1c was independently related to the occurrence of NAFLD in Chinese people aged >65 years.24 Another 3-year study revealed that elevated HbA1c levels had predictive values for the risk of NAFLD.25
Hypertriglyceridemia and low HDL-C are typical manifestations of lipid metabolism disorder during IR. The analysis of a study involving 8.5 million patients with NAFLD from 22 countries revealed that 69.16% had hyperlipidemia.26
Another study revealed that high UA levels could promote fat synthesis and deposition via multiple pathways, leading to NAFLD. A study involving 6043 women revealed the blood UA levels in patients with NAFLD to be higher than in those without NAFLD irrespective of whether the patients were premenopausal, perimenopausal, or postmenopausal.27 A previous study by the current author revealed the incidence of NAFLD to be relatively higher in postmenopausal women with T2DM and hyperuricemia.28
Nonalcoholic fatty liver disease is a common cause of liver function injury. A study involving 3739 postmenopausal women in South Korea revealed that the ALT and GGT serum levels in patients with NAFLD were higher than in those without NAFLD.29 In this study, similar results were observed in postmenopausal women with T2DM.
Other research confirmed that NAFLD could predict cardiovascular disease.30 Cardiovascular risk is further increased in patients with T2DM and NAFLD.31 Patients with NAFLD have an increased risk of noncalcified plaques, which are a predisposition to ischemic heart disease.32 In this study, it was observed in postmenopausal women with T2DM and NAFLD that the prevalence of diabetic peripheral vascular disease and hypertension was increased, and there was an increasing trend in the prevalence of CHD and stroke, although the differences were not statistically significant.
The bones and the liver are active endocrine organs with a variety of metabolic functions, and T2DM, NAFLD, and osteoporosis are metabolic diseases with a potentially common pathological mechanism. However, existing studies have not clarified the relationship between NAFLD and osteoporosis, and the underlying mechanism is complicated and unknown. The results of a study in South Korea revealed that NAFLD might be an independent risk factor for reducing BMD in postmenopausal women,29 which is different to the results of the present study. However, in the above-mentioned study subjects were younger (54.4–54.9 years vs 63.17–63.29 years) and their BMI was lower (22.4–24.1 vs 23.64–26.40) than in the present study. In another investigation of postmenopausal women in South Korea, the age (62.764–62.933 years) and BMI (22.877–25.339) of the study subjects were similar to those in the present study, and the results revealed that NAFLD was positively correlated with lumbar BMD.6 A study in India with lower ages (37.1–38.2 years), higher BMI (26.8–28.1), and male subjects accounting for 71% revealed that the systemic BMD of patients with NAFLD was higher than in those without the disease;7 these results were similar to those obtained in the present study. The differences between these studies may be related to the effects of gender, age, and BMI.
Furthermore, the degree of liver injury in NAFLD may have different effects on BDM. A recent Chinese study revealed that liver biopsy or 1H-MRS-proven NAFLD-associated hepatic fibrosis was independently associated with decreased BMD in postmenopausal women with T2DM.33 Although the underlying mechanism is unknown, it could be related to circulating molecules and chronic inflammation, IR, TNF-α, and vitamin D deficiency.
This study has the following limitations. First, it was a cross-sectional study. Therefore, the causal relationship between the related factors and NAFLD could not be clarified. Second, possibly due to the limitation of the sample size, we observed that the BMD of the femoral neck and total hip in the postmenopausal women with T2DM in the NAFLD group was higher than in the non-NAFLD group, although there was no significant difference in the prevalence of osteoporosis between the two groups. Third, the subjects in the present study were postmenopausal women with T2DM, but their estrogen levels were not measured. Finally, this study did not consider the use of anti-diabetic drugs, which might be associated with bodyweight gains or losses that could confound the results. Accordingly, further subgroup analysis is required.
Conclusion
In summary, complicated NAFLD in postmenopausal women with T2DM was associated with weight gain, poor blood glucose control, abnormal lipid metabolism, and elevated UA levels. Additionally, the BMD of the femoral neck and total hip in the NAFLD group was higher than in the non-NAFLD group, indicating that NAFLD in postmenopausal women with T2DM may reduce the risk of osteoporosis. The precise association and mechanism require further exploration in different ethnic groups.
Ethics Approval and Consent to Participate
I confirm that I have read the Editorial Policy pages. This study was conducted with approval from the Ethics Committee of The Second Hospital of Anhui Medical University (YX2020-011). This study was conducted in accordance with the declaration of Helsinki. Written informed consent was obtained from all participants.
Funding
Joint Research Fund for Prevention and Control of chronic diseases of The Second Affiliated Hospital of Anhui Medical University and Institute of Intelligent Machines, Chinese Academy of Sciences (No:MBLHJJ202005).
Disclosure
The authors report no conflicts of interest in this work.
References
1. Jian-gao F; Chinese Liver Disease Association. Guidelines for management of nonalcoholic fatty liver disease: an updated and revised edition. Zhonghua Gan Zang Bing Za Zhi. 2010;18(3):163–166.
2. Li J, Zou B, Yeo YH, et al. Prevalence, incidence, and outcome of non-alcoholic fatty liver disease in Asia, 1999–2019: a systematic review and meta-analysis. Lancet Gastroenterol Hepatol. 2019;4(5):389–398. doi:10.1016/S2468-1253(19)30039-1
3. Wang L, Gao P, Zhang M, et al. Prevalence and ethnic pattern of diabetes and prediabetes in China in 2013. JAMA. 2017;317(24):2515–2523. doi:10.1001/jama.2017.7596
4. Moon SS, Lee YS, Kim SW. Association of nonalcoholic fatty liver disease with low bone mass in postmenopausal women. Endocrine. 2012;42(2):423–429. doi:10.1007/s12020-012-9639-6
5. Cui R, Sheng H, Rui XF, et al. Low bone mineral density in Chinese adults with nonalcoholic Fatty liver disease. Int J Endocrinol. 2013;2013:396545. doi:10.1155/2013/396545
6. Lee SH, Yun JM, Kim SH, et al. Association between bone mineral density and nonalcoholic fatty liver disease in Korean adults. J Endocrinol Invest. 2016;39(11):1329–1336. doi:10.1007/s40618-016-0528-3
7. Bhatt SP, Nigam P, Misra A, Guleria R, Qadar Pasha MA. Independent associations of low 25 hydroxy vitamin D and high parathyroid hormonal levels with nonalcoholic fatty liver disease in Asian Indians residing in north India. Atherosclerosis. 2013;230(1):157–163. doi:10.1016/j.atherosclerosis.2013.07.006
8. Wang Z, Xu M, Hu Z, Shrestha UK. Prevalence of nonalcoholic fatty liver disease and its metabolic risk factors in women of different ages and body mass index. Menopause. 2015;22(6):667–673. doi:10.1097/GME.0000000000000352
9. Wong VW, Wong GL, Yeung DK, et al. Incidence of non-alcoholic fatty liver disease in Hong Kong: a population study with paired proton-magnetic resonance spectroscopy. J Hepatol. 2015;62(1):182–189. doi:10.1016/j.jhep.2014.08.041
10. Ryu S, Suh BS, Chang Y, et al. Menopausal stages and non-alcoholic fatty liver disease in middle-aged women. Eur J Obstet Gynecol Reprod Biol. 2015;190:65–70. doi:10.1016/j.ejogrb.2015.04.017
11. Goldshtein I, Nguyen AM, dePapp AE, et al. Epidemiology and correlates of osteoporotic fractures among type 2 diabetic patients. Arch Osteoporos. 2018;13(1):15. doi:10.1007/s11657-018-0432-x
12. Sözen T, Özışık L, Başaran NÇ. An overview and management of osteoporosis. Eur J Rheumatol. 2017;4(1):46–56. doi:10.5152/eurjrheum.2016.048
13. American Diabetes Association. Diagnosis and classification of diabetes mellitus. Diabetes Care. 2013;36 Suppl 1(Suppl1):S67–S74. doi:10.2337/dc13-S067
14. Wong VW, Chan WK, Chitturi S, et al. Asia-pacific working party on non-alcoholic fatty liver disease guidelines 2017-part 1: definition, risk factors and assessment. J Gastroenterol Hepatol. 2018;33(1):70–85. doi:10.1111/jgh.13857
15. WHO Sicentific Group on the assessment of osteoporosis at primary health care level. Summary meeting report, Brussels, Belgium; 2004.
16. Fihn SD, Blankenship JC, Alexander KP, et al. 2014 ACC/AHA/AATS/PCNA/SCAI/STS focused update of the guideline for the diagnosis and management of patients with stable ischemic heart disease: a report of the American College of Cardiology/American Heart Association Task Force on Practice Guidelines, and the American Association for Thoracic Surgery, Preventive Cardiovascular Nurses Association, Society for Cardiovascular Angiography and Interventions, and Society of Thoracic Surgeons. J Am Coll Cardiol. 2014;64(18):1929–1949. doi:10.1016/j.jacc.2014.07.017
17. Williams B, Mancia G, Spiering W, et al.; ESC Scientific Document Group. 2018 ESC/ESH Guidelines for the management of arterial hypertension. Eur Heart J. 2018;39(33):3021–3104. doi:10.1093/eurheartj/ehy339
18. Sacco RL, Kasner SE, Broderick JP, et al.; American Heart Association Stroke Council, Council on Cardiovascular Surgery and Anesthesia; Council on Cardiovascular Radiology and Intervention; Council on Cardiovascular and Stroke Nursing; Council on Epidemiology and Prevention; Council on Peripheral Vascular Disease; Council on Nutrition, Physical Activity and Metabolism. An updated definition of stroke for the 21st century: a statement for healthcare professionals from the American Heart Association/American Stroke Association. Stroke. 2013;44(7):2064–2089. doi:10.1161/STR.0b013e318296aeca
19. Yu KH, Chen DY, Chen JH, et al. Management of gout and hyperuricemia: multidisciplinary consensus in Taiwan. Int J Rheum Dis. 2018;21(4):772–787. doi:10.1111/1756-185X.13266
20. Psychari SN, Rekleiti N, Papaioannou N, et al. Epicardial fat in nonalcoholic fatty liver disease: properties and relationships with metabolic factors, cardiac structure, and cardiac function. Angiology. 2016;67(1):41–48. doi:10.1177/0003319715576672
21. Borai IH, Shaker Y, Kamal MM, et al. Evaluation of biomarkers in egyptian patients with different grades of nonalcoholic fatty liver disease. J Clin Transl Hepatol. 2017;5(2):109–118. doi:10.14218/JCTH.2017.00004
22. Pang Y, Kartsonaki C, Turnbull I, et al. Diabetes, plasma glucose, and incidence of fatty liver, cirrhosis, and liver cancer: a prospective study of 0.5 million people. Hepatology. 2018;68(4):1308–1318. doi:10.1002/hep.30083
23. Hagström H, Tynelius P, Rasmussen F. High BMI in late adolescence predicts future severe liver disease and hepatocellular carcinoma: a national, population-based cohort study in 1.2 million men. Gut. 2018;67(8):1536–1542. doi:10.1136/gutjnl-2016-313622
24. Ma H, Xu C, Xu L, Yu C, Miao M, Li Y. Independent association of HbA1c and nonalcoholic fatty liver disease in an elderly Chinese population. BMC Gastroenterol. 2013;13:3. doi:10.1186/1471-230X-13-3
25. Chen CX, Du J, Xu YM, et al. Predictive value of serum glycosylated hemoglobin for the onset of nonalcoholic fatty liver disease. Zhonghua Gan Zang Bing Za Zhi. 2018;20(26):765–770.
26. Younossi ZM, Koenig AB, Abdelatif D, et al. Global epidemiology of nonalcoholic fatty liver disease-meta-analytic assessment of prevalence, incidence, and outcomes. Hepatology. 2016;64(1):73–84. doi:10.1002/hep.28431
27. Chen Y, Huang Q, Ai P, et al. Association between serum uric acid and non-alcoholic fatty liver disease according to Different Menstrual Status Groups. Can J Gastroenterol Hepatol. 2019;2019:2763093. doi:10.1155/2019/2763093
28. Du Y, Pan T, Zhong X, et al. Study on the relationship between serum uric acid level and body mass index, blood lipids and renal function in postmenopausal women with type 2 diabetes mellitus. Acta Universitatis Medicinalis Anhui. 2017;52(8):1219–1223.
29. Dong-Yun L, Kyung J, Hur KY, et al. Association between nonalcoholic fatty liver disease and bone mineral density in postmenopausal women. Climacteric. 2018;21(5):498–501. doi:10.1080/13697137.2018.1481380
30. Targher G, Day CP, Bonora E. Risk of cardiovascular disease in patients with nonalcoholic fatty liver disease. N Engl J Med. 2010;363:1341–1350. doi:10.1056/NEJMra0912063
31. Wild SH, Walker JJ, Morling JR, et al. Cardiovascular disease, cancer, and mortality among people with type 2 diabetes and alcoholic or nonalcoholic fatty liver disease hospital admission. Diabetes Care. 2018;4l(2):341–347. doi:10.2337/dc17-1590
32. Lee SB, Park GM, Lee JY, et al. Association between non-alcoholic fatty liver disease and subclinical coronary atherosclerosis: an observational cohort study. J Hepatol. 2018;68(5):1018–1024. doi:10.1016/j.jhep.2017.12.012
33. Zhu X, Yan H, Chang X, et al. Association between non-alcoholic fatty liver disease-associated hepatic fibrosis and bone mineral density in postmenopausal women with type 2 diabetes or impaired glucose regulation. BMJ Open Diabetes Res Care. 2020;Aug(1):e000999. doi:10.1136/bmjdrc-2019-000999
 © 2022 The Author(s). This work is published and licensed by Dove Medical Press Limited. The full terms of this license are available at https://www.dovepress.com/terms.php and incorporate the Creative Commons Attribution - Non Commercial (unported, v3.0) License.
By accessing the work you hereby accept the Terms. Non-commercial uses of the work are permitted without any further permission from Dove Medical Press Limited, provided the work is properly attributed. For permission for commercial use of this work, please see paragraphs 4.2 and 5 of our Terms.
© 2022 The Author(s). This work is published and licensed by Dove Medical Press Limited. The full terms of this license are available at https://www.dovepress.com/terms.php and incorporate the Creative Commons Attribution - Non Commercial (unported, v3.0) License.
By accessing the work you hereby accept the Terms. Non-commercial uses of the work are permitted without any further permission from Dove Medical Press Limited, provided the work is properly attributed. For permission for commercial use of this work, please see paragraphs 4.2 and 5 of our Terms.