")
Back to Journals » Nutrition and Dietary Supplements » Volume 14
Risk Factors and Spatial Distributions of Underweight Among Children Under-Five in Urban and Rural Communities in Tigray, Northern Ethiopia: Using Ordinal Logistic Regression Analysis
Authors Abebe HT, Taffere GR , Fisseha MA , Bezabih AM
Received 21 April 2022
Accepted for publication 7 September 2022
Published 29 September 2022 Volume 2022:14 Pages 21—37
DOI https://doi.org/10.2147/NDS.S371773
Checked for plagiarism Yes
Review by Single anonymous peer review
Peer reviewer comments 5
Editor who approved publication: Dr Chandrika J Piyathilake
Haftom Temesgen Abebe,1,2 Getachew Redae Taffere,3 Meseret Abay Fisseha,4 Afework Mulugeta Bezabih5
1Department of Biostatistics, College of Health Sciences, Mekelle University, Mekelle, Ethiopia; 2Laboratory Interdisciplinary Statistical Data Analysis, College of Health Sciences, Mekelle University, Mekelle, Ethiopia; 3Department of Environmental Health, College of Health Sciences, Mekelle University, Mekelle, Ethiopia; 4Department of Reproductive Health, College of Medicine and Health Sciences, Mekelle University, Mekelle, Ethiopia; 5Department of Nutrition and Dietetics, College of Health Sciences, Mekelle University, Mekelle, Ethiopia
Correspondence: Haftom Temesgen Abebe, College of Health Sciences, Mekelle University, P.O.Box 1871, Mekelle, Ethiopia, Email [email protected]
Background: Despite the implementation of high-impact interventions, both acute and chronic childhood malnutrition has continued to be a critical public health concerns in Ethiopia. The present study was conducted to assess the spatial distributions of underweight and associated factors among 6– 59 month old children in 18 urban and 34 rural areas of Tigray, Northern Ethiopia.
Methods: A cross-sectional survey was conducted on 11,004 households from June to July 2019. Nutritional status of 11,004 children was evaluated by calculating weight-for-age anthropometric index and categorized into three groups namely severely underweight (< − 3.0 z scores), moderately underweight (− 3.0 to − 2.01 z scores) and normal (≥ − 2.0 z scores). An ordinal logistic regression model was used to determine predictors of underweight. Odds ratio with 95% confidence interval (CI) was used to assess the strength of the association between independent variables and underweight. Spatial clustering of underweight was determined using SATSCAN and GIS softwares.
Results: The overall prevalence of underweight was found to be 21.16% (95% CI = 19.54– 22.86%). Of these 25.65% (95% CI = 22.20– 29.21%) and 74.35% (95% CI = 72.34– 76.46%) were severely and moderately underweight, respectively. Children whose mothers lived in rural areas (AOR = 1.28, 95% CI = 1.11– 1.49), severe households food insecurity (AOR = 1.29, 95% CI = 1.07– 1.54), had fever (AOR = 1.29, 95% CI = 1.11– 1.48), had diarrhea (AOR = 1.27, 95% CI = 1.08– 1.49), had cough (AOR = 1.17, 95% CI = 1.02– 1.34) and male (AOR = 1.28, 95% CI = 1.17– 1.40) were more likely to be underweight. Moreover, children whose mothers had college or above education were less likely to be underweight than children whose mothers had no education (AOR = 0.48, 95% CI = 0.37– 0.62).
Conclusion: The burden of underweight among under-five children from Tigray was unacceptably high. In order to reduce the burden of underweight in the region, improving household level food insecurity, prevention of common childhood illnesses, maternal education and age appropriate feeding are recommended.
Keywords: underweight, ordinal logistic, spatial distribution, rural, urban, Tigray
Introduction
Globally the prevalence of underweight is falling.1 More than 100 million children younger than 5 years, or 16%, were underweight (weight-for-age Z score [WAZ] < –2 on the basis of the WHO Child Growth Standards), a 36% decrease from an estimated 159 million between 1990 and 2012, according to UN estimates.2 In 2015, globally about 15% of children were underweight.3 Despite improvements globally, underweight remains prevalent and most fundamental challenge in sub-Saharan Africa.4–6 The African region has reported 24.9% of underweight among children under-5 years of age.7 Moreover, a meta-analysis of the prevalence of underweight within four sub-regions of sub-Saharan Africa from demographic and health surveys (2006–2016) revealed that underweight was highest in Burundi (28.8%) and Ethiopia (25.2%) from East Africa; Niger (36.4%), Nigeria (28.7%), Burkina Faso (25.7%) and Mali (25%) from West Africa; and Chad (28.8%) from Central Africa.3 The prevalence of underweight was also alarmingly high in Tigray, Ethiopia. The national underweight prevalence rates declined from 47% in 2000 to 21% in 2019 in Ethiopia and from 48% in 2000 to 30% in 2019 in Tigray.8,9
There are multiple factors that contribute to underweight in children under-five. Among the common determinants reported by previous studies include socioeconomic inequalities, geographical differences, suboptimal feeding practices, maternal nutritional status, household food insecurity, maternal literacy, infections and childhood illnesses, access to health services and access to water, sanitation and hygiene services.10–17 Suboptimal growth, according to anthropometric measures indicative of underweight, has been shown to increase the risk of death from infectious diseases (such as diarrhea, pneumonia, malaria, and measles) in childhood18,19 and children underweight have poorer health than normal weight children.20
Underweight accounts for 17% to 19.6% of the proportion of total deaths of children younger than 5 years21,22 and nearly 15% to 18.7% of the total disability adjusted life years (DALY) losses in children under-5 years of age.21,23 Moreover, children with multiple anthropometric deficits are at a heightened risk of mortality. Compared to children with no anthropometric deficits, the mortality hazard ratios were 3.4, 4.7 and 12.3 among children who were stunted and underweight but not wasted, children who were wasted and underweight but not stunted and children who were stunted, wasted, and underweight, respectively.24
In Ethiopia, several studies have been conducted on child underweight.10,25–37 However, most of the studies considered underweight in children as a binary (normal and low weight-for-age) variable. As a result, the binary logistic regression model was applied to identify the risk factors of underweight in children.10,25,27–37 However, the weight-for-age of a child is usually classified as normal, moderate underweight and severe underweight. Ignoring the discrete ordinal nature of the response variable would make the analysis lose some useful information and might lead to misinterpretation of the main findings. Thus, it is crucial for researchers to use the most appropriate models to analyze and identify the predictors of ordinal categorical dependent variables such as underweight. Moreover, studies that describe hotspots of child underweight that take into account the spatial distribution are scarce in Ethiopia and not available in Tigray partly because it requires a large sample size that has not yet been available.
We argued that determining the spatial distribution of underweight and identifying the main risk factors of child underweight is important to guide public health program managers and implementers to plan and design appropriate intervention strategies to prevent underweight and enhance nutritional status of children. Thus, the present cross-sectional study was conducted to assess the spatial distributions and risk factors of underweight among 6–59 month old children from urban and rural communities of Tigray, Northern Ethiopia.
Materials and Methods
Study Area and Design
A cross-sectional community based survey was conducted in all the woredas of Tigray from June to July 2019. Tigray is one of nine regional states of Ethiopia located at latitudes from 12° 14ʹ50.50” to 14° 53ʹ48.03” and longitudes from 36° 26ʹ48.74” to 39° 59ʹ0.09”. The region is divided into 7 zones, 52 woredas. In terms of religion, 95.5% of the population are Orthodox Christians, 4.1% and 0.4% are Muslims and Catholics, respectively. Regarding ethnic composition, 94.98% are Tigraway, 2.6% Amhara, 0.7% Erob and 0.05% Kunama. According to the Tigray Health Bureau report, the region has 36 Hospitals, 204 Health Centers and 712 Health Posts. Tigray is home for 6.2 million people with an estimated area of 54,593 square kilometers. Most (73%) of the population live in rural, while 27% are urban dwellers.38
Study Population
The study population was children aged 6–59 months residing in selected households in all 52 woredas of Tigray.
Inclusion and Exclusion Criteria
All healthy children aged 6–59 months residing in the selected households were included. Children aged 6–59 months who were seriously ill were excluded from the study.
Sample Size Determination and Sampling Technique
The sample size was determined by using a single population proportion formula with the assumption of stunting rate 39.3% from EDHS 2016,39 99% confidence interval (CI), 2% level of precision and 2.5 design effects. The sample size was adjusted to compensate for a non-response rate of 10% and the final minimum sample size was 10,917 households with 6–59 month old children. A stratified two stage sampling technique was employed to select the 10,917 households with 6–59 month old children. The total sample size (10,917) was allocated to each woreda using proportion to the size of the population (PSP). In the first stage, representative tabias/kebeles were selected from each of 52 woredas using simple random sampling. In the second stage, households with under-five children from the selected kebelles/tabias were selected at random. In the selected households with more than one under-five children, the youngest child was selected and included in the study.
Dependent Variable
Weight-for-age (underweight) was the dependent variable. The 2006 WHO Multi Centre Growth Standards z-score system was used to calculate weight-for-age z-scores (WAZ). On the basis of WAZ-scores, the nutritional status of the children was categorized into three ordinal categories: severely underweight (< −3.0 WAZ scores), moderately underweight (−3.0 to −2.01 WAZ scores) and normal (≥ −2.0 WAZ scores).
Independent Variables
The independent variables were socio-economic and demographic factors, child feeding and caring practices, household food insecurity, common childhood illnesses, child vaccination and delivery of key essential nutrition action messages. The selection of the independent variables of underweight was guided by the famous UNICEF conceptual framework of the determinants of child under nutrition.40
Measurements
Weight measurement was taken following standard procedures of the Food and Nutrition Technical Assistance Guide.41 Weight was measured to the nearest 0.1 kg using a salter weighing scale. Each child was weighed with minimum clothing and no foot wear. Age of each child was collected from the mother and counter checked using birth certificates, vaccination cards, baptismal certificates or other forms of informal recording.
To assess the severity of underweight in the population, the following epidemiological criterion was used: low prevalence (<10%), medium prevalence (10–19.9%), high prevalence (20–29.9%) and very high prevalence (≥30%).41
The household food insecurity access scale (HFIAS) questionnaire consists of nine occurrence questions that represent a generally increasing level of severity of food insecurity (access), and nine “frequency-of-occurrence” questions that are asked as a follow-up to each occurrence question to determine how often the condition occurred. The HFIAS was used to classify households into severe, moderate, mild food insecure and food secure households.42
Latitude, longitude, and elevation coordinates were obtained for the nearby health post or outreach center using a mobile phone. Geospatial clustering of the risk of child underweight among 6–59 month old children was determined using GIS.
Data Collection Procedure and Quality Control
Two types of instruments were used to collect data: a pre-tested structured questionnaire and anthropometric measurements. The data was collected using ODK (Smartphone) by trained data collectors. The questionnaire was first prepared in English, and then translated in to Tigrigna, the local language. The completeness and consistency of data were assured through direct and daily supervision of the supervisor and principal investigators. The mobile phones were GPS installed to determine the geospatial clustering of malnutrition in Tigray.
Statistical Data Analysis
STATA software version 16 was used for the data analysis. Weight-for-age (WAZ) scores was calculated using the Emergency Nutrition Assessment (ENA) for Standardized Monitoring and Assessment of Relief and Transitions (ENA for SMART) Software. Spatial clustering of child underweight was determined using SATSCAN and GIS softwares. The association between independent variables and the dependent variable was examined by performing both bivariate and multivariable analyses. In the bivariate setup, in order to measure the strength of association between the ordinal response and independent variables, gamma measure is used when independent variables are in ordinal scale, while chi-square is used when they are measured in nominal scale. Those candidate independent variables with p value of less than 0.20 were fitted into multivariable analysis to control for potential confounders. In multivariable analysis, the ordinal logistic regression model is considered to assess the adjusted effects of independent variables on the nutritional status of children. Adjusted odds ratio (AOR) and 95% CI were used to assess the strength of the association between the independent variables and dependent variable.
Ordinal Logistic Regression Model
In the literature, there are several ordinal logistic regression models have been suggested for ordinal responses, such as proportional odds model (POM), partial proportional odds model-without restrictions (PPOM-UR) and partial proportional odds model with restrictions (PPOM-R), continuous ratio model (CRM), and stereotype model (SM). The most commonly used ordinal logistic regression model in practice is the constrained cumulative logit model called the POM.
Proportional Odds Model
The POM is the most widely used in epidemiological and biomedical applications but it leads to strong assumptions that may lead to incorrect interpretations if the assumptions are violated.43 POM is appropriate when an original continuous outcome variable is later grouped. The POM is used to estimate the odds of being at or below a particular level of the response variable. For example, if there are j levels of ordinal responses, the POM makes j-1 predictions that each estimating the cumulative probabilities at or below the jth level of the response variable. Let Yi (i=1, 2, …, n) be the response variable with ordinal categories. In this study, the Yi is the response with three ordered categories 1, 2, 3, i.e., normal, moderately underweight or severely underweight.
The cumulative probabilities are the probability that the response Y falls in category i or below for each possible i, i=1, 2, …, k where k is the number of outcome categories. To introduce the model additionally, let Xi = (Xi1, Xi2, …, Xip)’ be the vector of p independent variables related to outcome variable Yi. The functional form of the POM which simultaneously consider k-1 cumulative logits can be expressed as:


where β= (β1, β2, …, βp)’ is the vector of regression parameters related with Xi and αj represents the intercept for jth cumulative logit. The POM, the effect of each independent variable is assumed to be same for any cumulative logits. The assumption of POM can be checked by a statistical test such as test based on deviance or score test. In this paper, deviance based test was performed to check the assumption. Pearson chi-square statistic goodness-of-fit was used to test for the model fitness. When proportional odds assumption is violated, a valid solution is fitting partial proportional odds model (PPOM).44
Ethical Consideration
This study was approved by the research ethics review committee of College of Health Sciences of Mekelle University with IRB 1365/2019. The study was conducted in accordance with the Declaration of Helsinki. The parents or child legal guardian were informed about the study objectives and verbal infomed consent was obtained to conduct the interview and take their child’s anthropometric measurements. The verbal informed consent was acceptable and approved by the ethics committee. The confidentiality of data was kept as there were no personal identifiers used and neither the raw data nor the extracted data were passed to a third person.
Results
Socio-Demographic Characteristics
The study was conducted in all the 52 (34 rural and 18 urban) woredas of Tigray region of Ethiopia. A total of 11,004 mothers or care givers with their children aged 6–59 months were included in the study. The socio-demographic characteristics of mothers or caregivers of children are summarized in Table 1. The average age (SD) of the children and care givers (SD) were 26.0 ±14.0 months and 29.3 ± 7.1 years, respectively. Majority of children were female (51.2%), lived in rural areas (77.2%) and 83.2% of mothers were married. Only 37.7% of children had mothers with no formal education and 32.9% had mothers with primary education. Of the total interviewed households, 25.1% had more than five family size (Table 1).
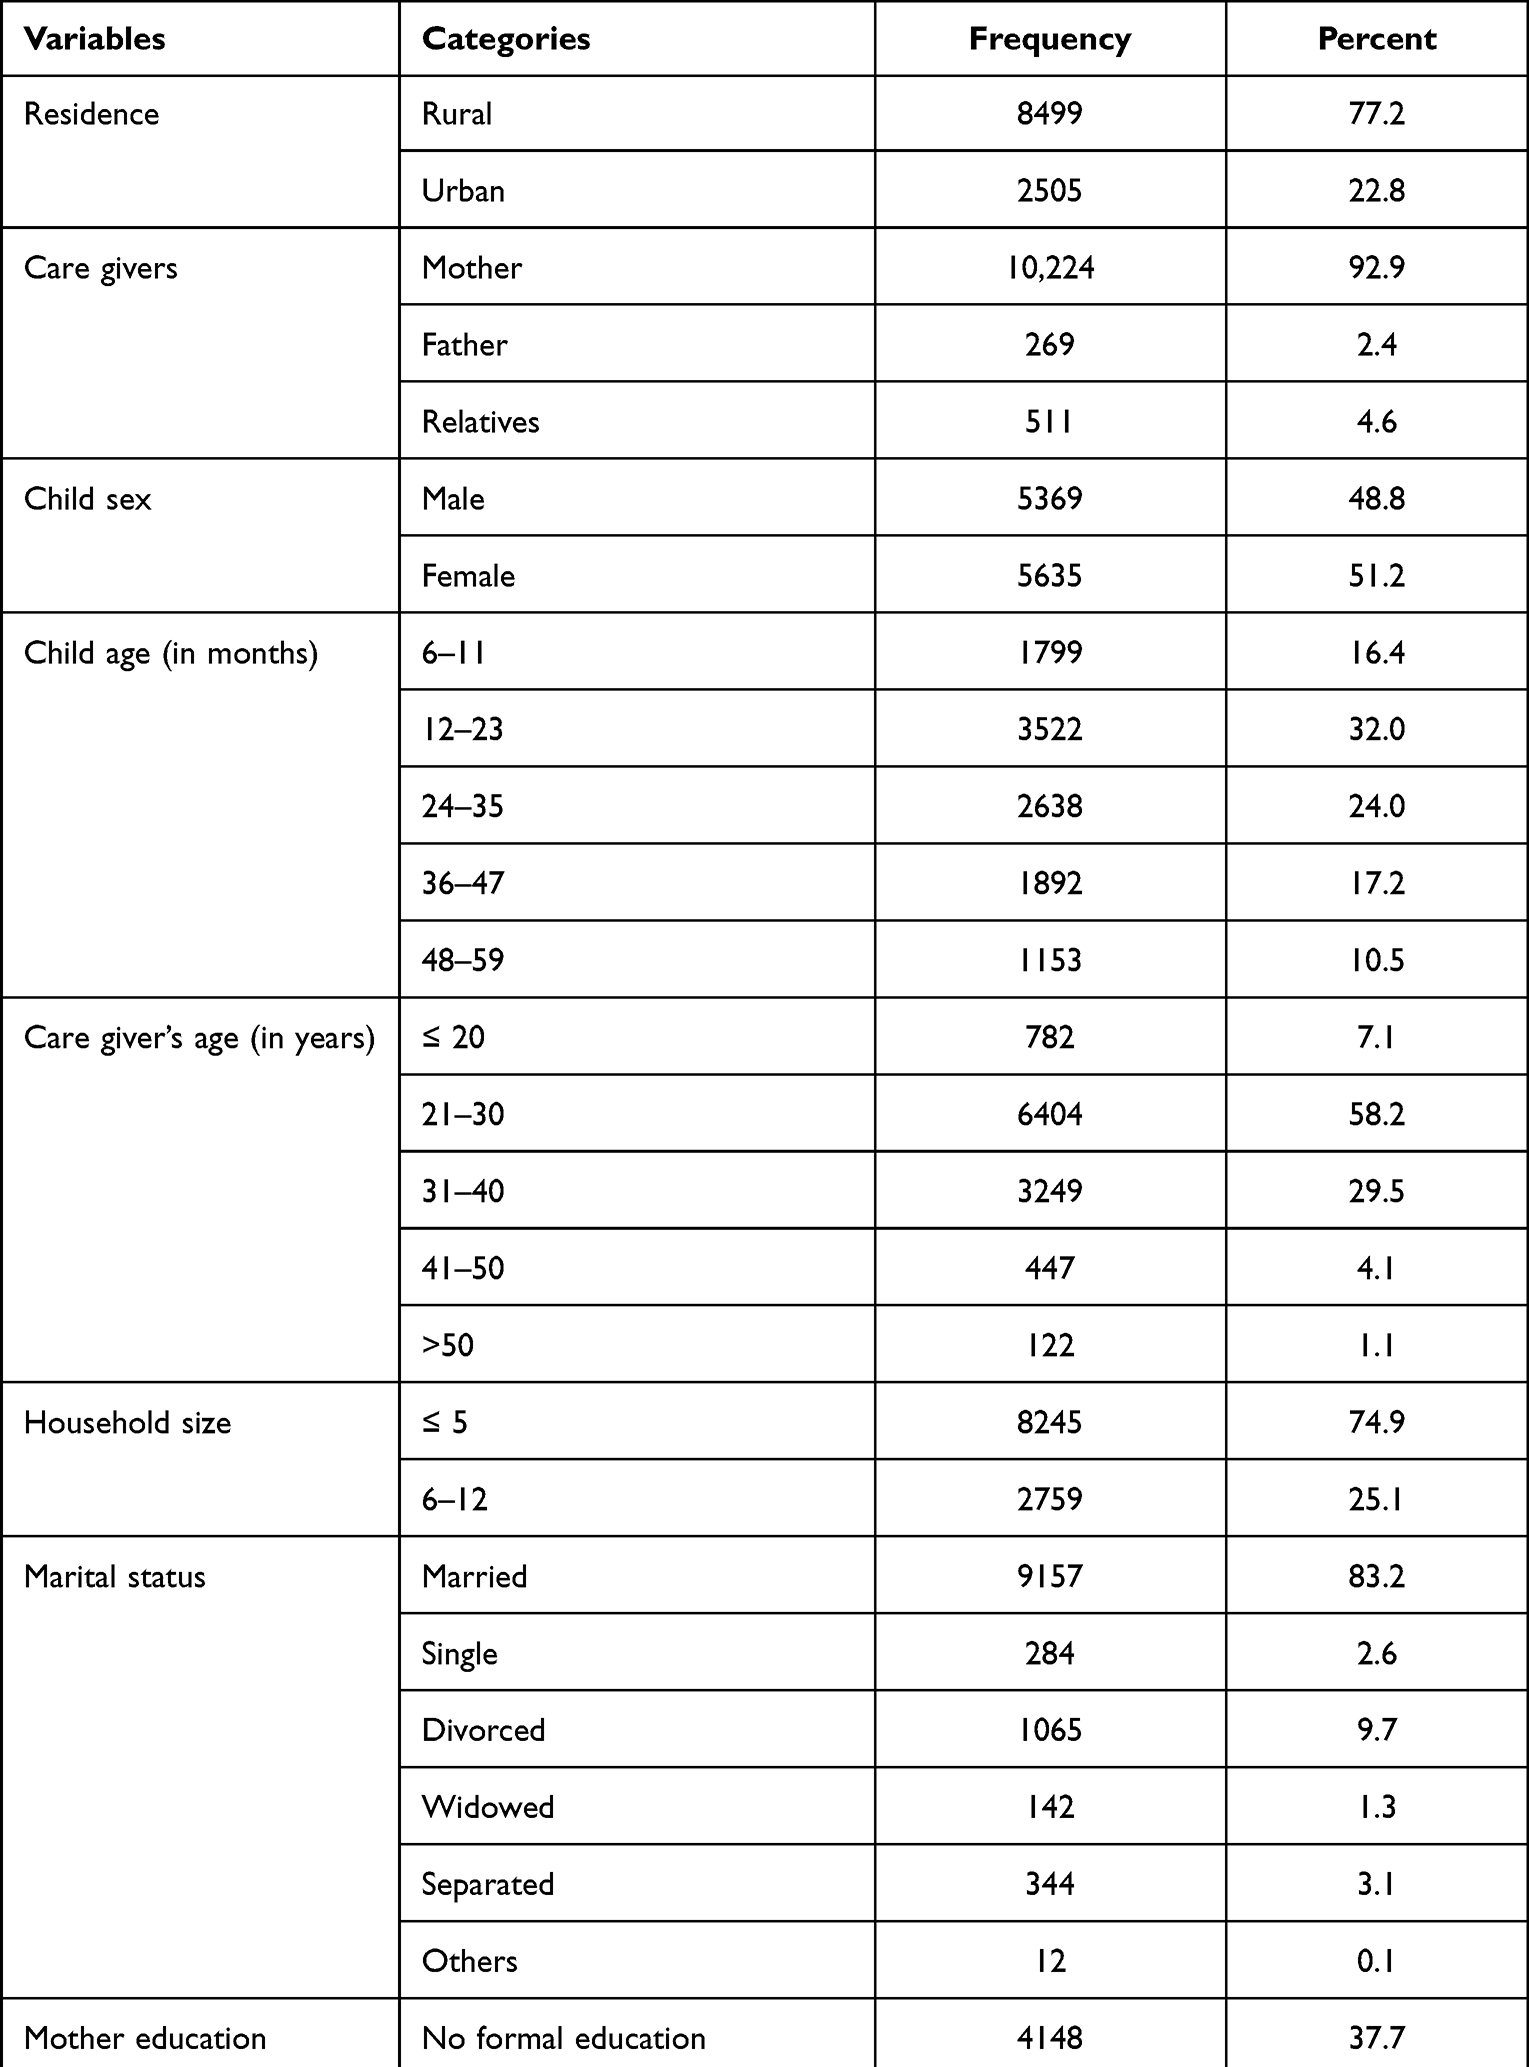 |
Table 1 Socio-Demographic Characteristics of Mothers or Caretakers of Children Under-Five in Tigray, Ethiopia, 2019 (n = 11,004) |
Maternal and Child Health and Feeding Characteristics
Ever 10,847 (98.6%) and exclusive 10,588 (96.2%) breastfeeding were almost universal in the study communities. Similarly, more than 80% of the mothers did initiate breastfeeding with the first one hour of birth. Close to 80% of the care givers initiate the provision of complementary foods at exactly 6 months of age of the child. Though higher proportion (90.5%) of children were exempted from fasting, the contamination of kitchen utensils with animal source foods was a concern during the fasting periods for significant proportion of mothers (79.6%) from the study communities. Exemption from fasting was relatively lower during pregnancy (62.4%) and lactation (63.3%). Of the total children, 77% were received vitamin A supplementation. About 11% of the children had mothers who did not visit any antenatal clinic during pregnancy, 43.9% had mothers who did not ever heard nutrition information through media, 10.2% of the children had diarrhea, 15.3% had fever and 13.9% had sign of cough/pneumonia in the last 2 weeks prior to the date of data collection (Table 2).
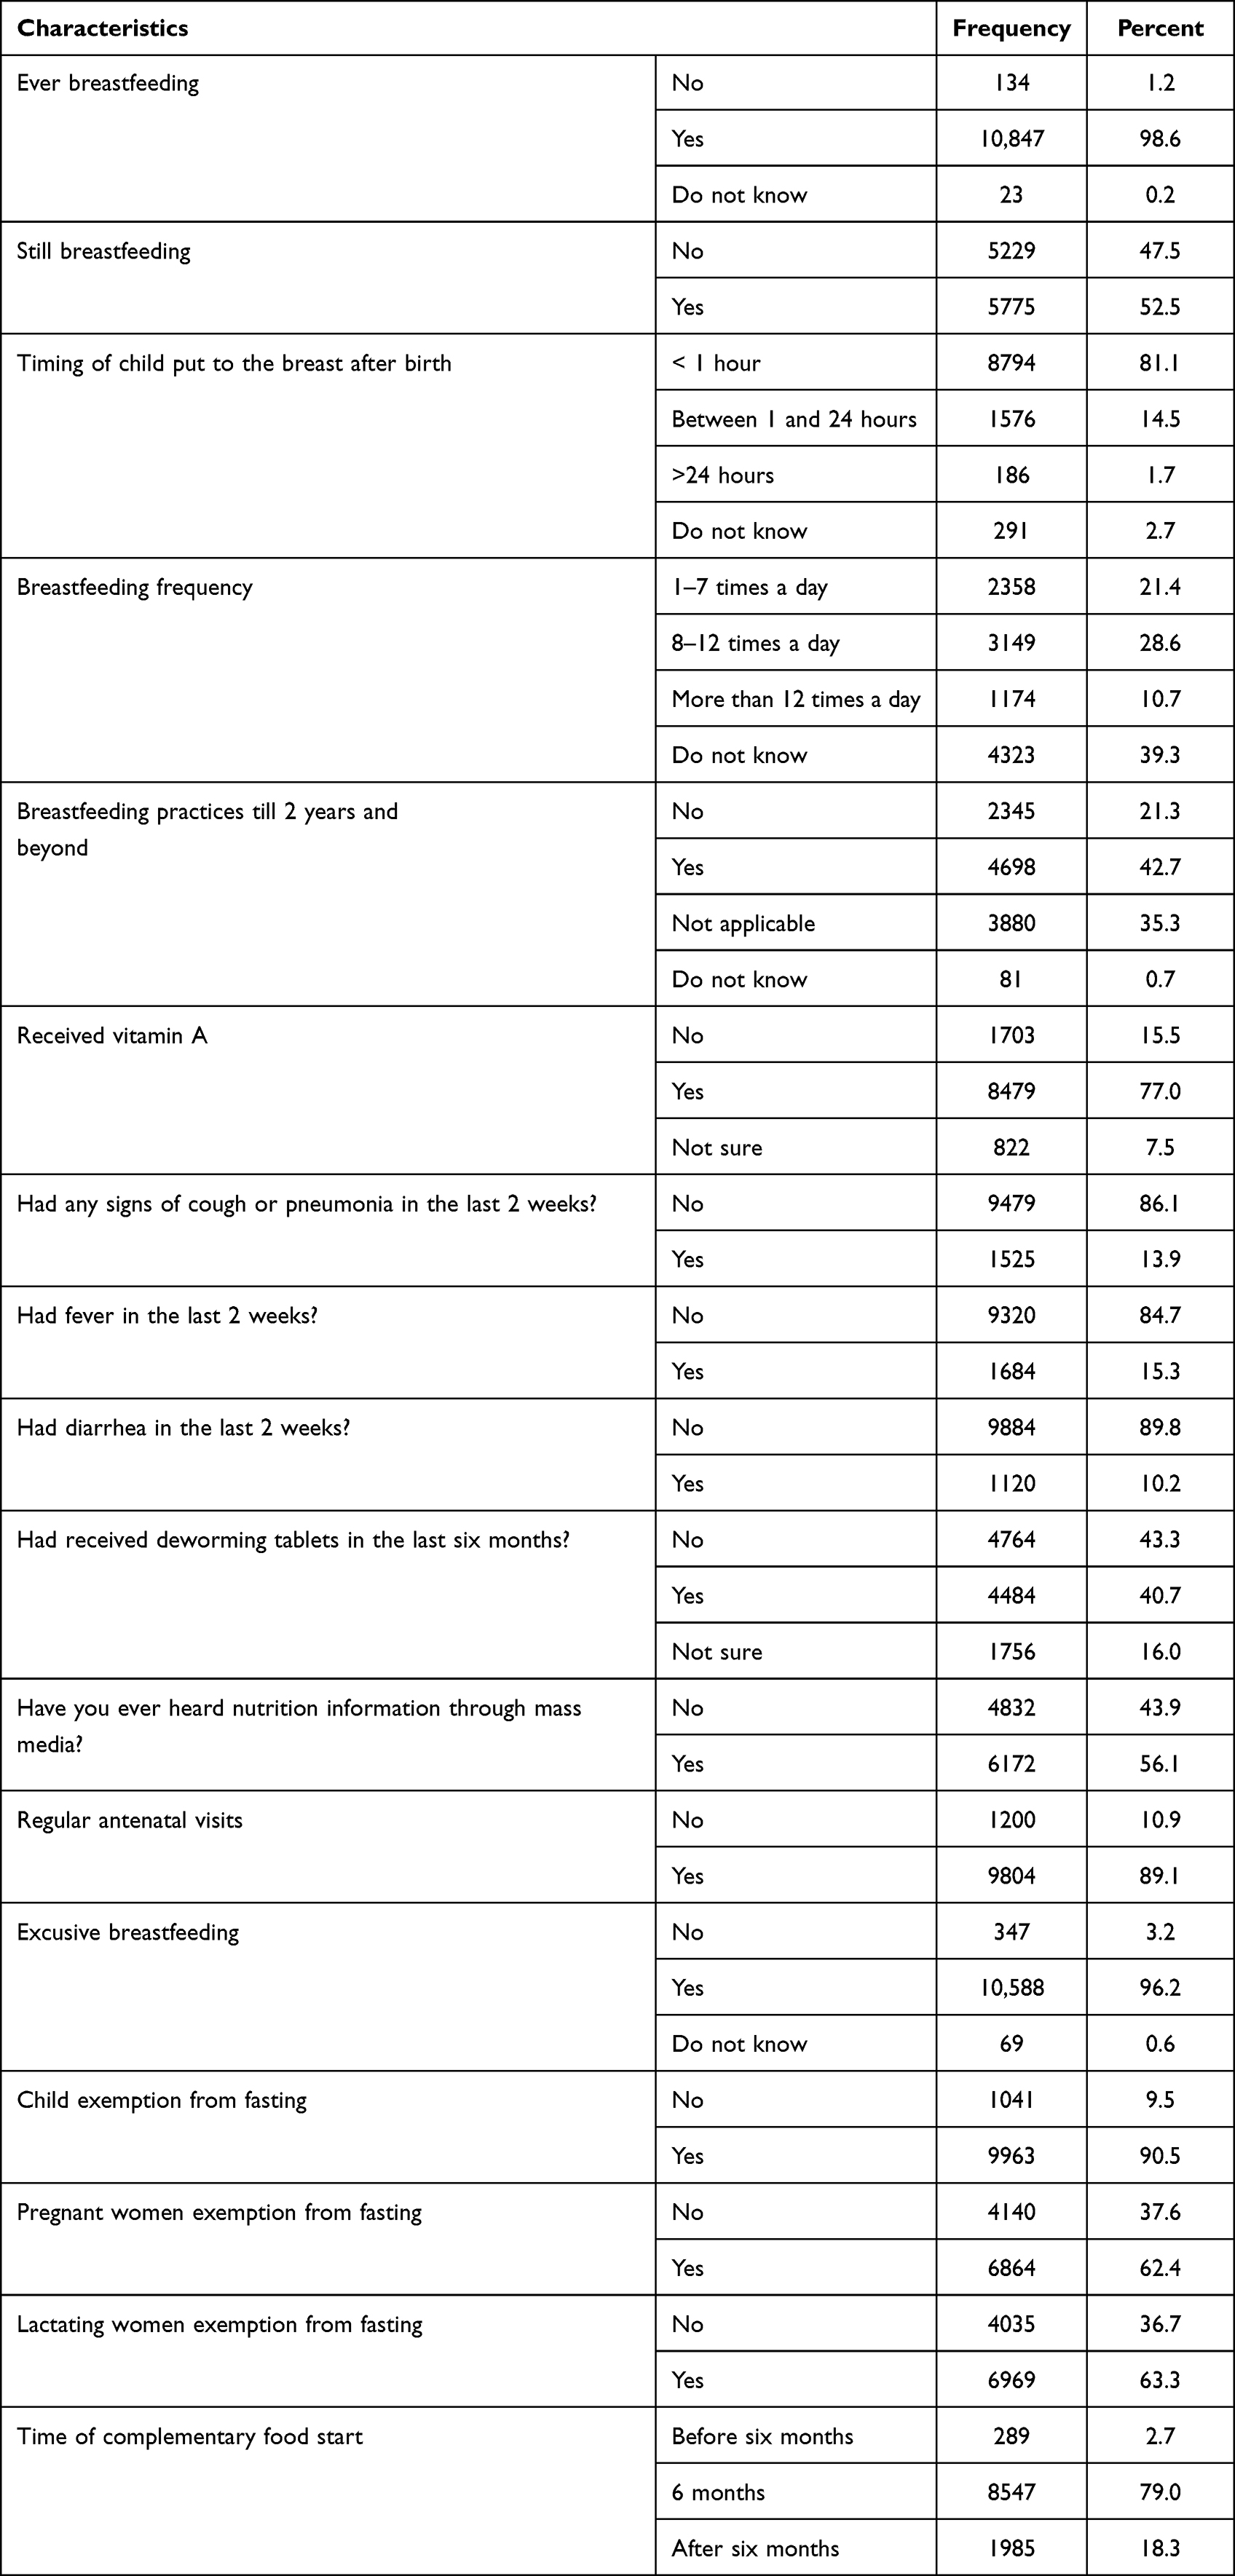 |
Table 2 Maternal and Child Health and Feeding Practices of Children Under-Five in Tigray, Ethiopia, 2019 (n = 11,004) |
Household Food Insecurity
Respondents were asked for the presence or absence of food security related events in the previous 4 weeks. Using HFIAS, 6461 (58.7%), 1273 (11.6%), 2544 (23.1%), and 726 (6.6%) of the households were found to be food secure, mildly food insecure, moderately food insecure, and severely food insecure, respectively (Figure 1). The burden of underweight was found to be almost similar in mildly food insecure and moderately food insecure. Underweight among children was high in the severely food insecure households. The prevalence of underweight was 19.2% and 27.1% in food secure and severely food insecure households, respectively (Figure 2).
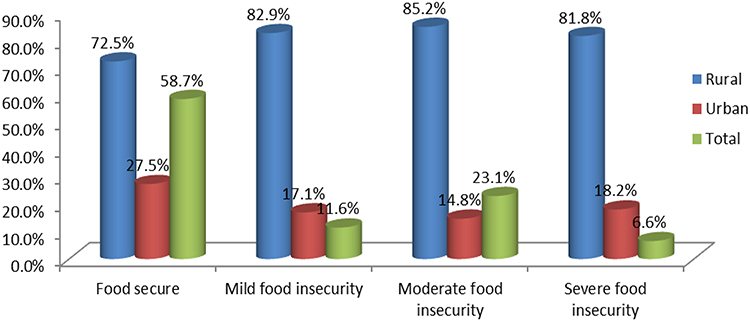 |
Figure 1 Food insecurity level of households in the study areas (n = 11,004). |
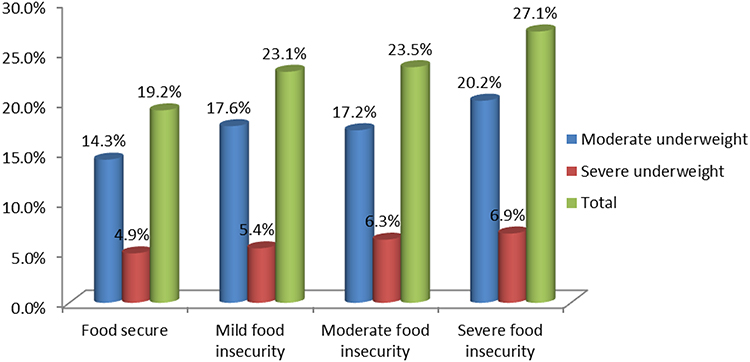 |
Figure 2 Underweight among 6–59 month old children by household food insecurity level in the study areas (n = 11,004). |
Geospatial Distribution (Clustering) of Underweight
Our anthropometric data is reported using the WHO flags based on standard population as opposed to the SMART flags based on the observed population. The range used was −6 to +5 standard deviations for weight-for-age z-scores. In this analysis, 8 z-scores of weight-for-age were not included. The overall prevalence of underweight among the children was 21.2% (95% CI: 19.54–22.86%). Of these 25.7% (95% CI: 22.20–29.21%) and 74.4% (95% CI: 72.34–76.46%) were severely and moderately underweight, respectively. Underweight among 6–59 month old children was high or above the average in South (24.9%), North West (23.5%), South East (22.1%) and Central (21.9%) zones of Tigray (Figure 3). The burden of underweight in the rural areas of Tigray was found to be 22.6% (95% CI: 20.74–24.48%). The lowest and highest burden of prevalence of underweight was found in Raya Azebo (11.6%) and Enda Mekhoni (36.2%), respectively (Supplementary Table 1). The prevalence of underweight in the urban towns of Tigray was found to be 16.3% (95% CI: 12.67–19.83%). Underweight ranged from 6.9% in Quiha to 30.6% in Korem (Supplementary Table 2).
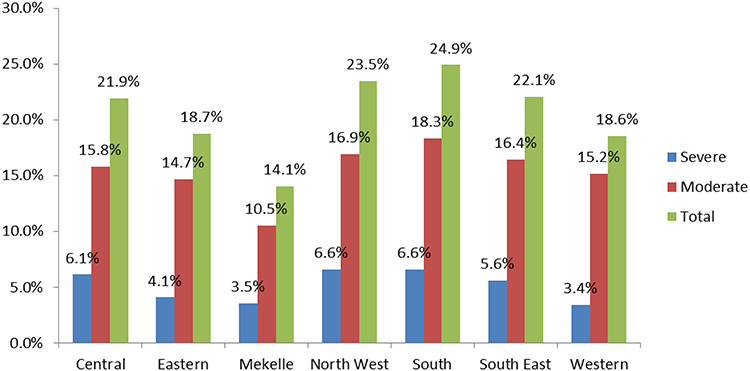 |
Figure 3 Distribution of underweight among 6–59 month old children by zone. |
Using the epidemiological criterion, we have assessed the severity of underweight. High prevalence of underweight is concentrated in the Eastern, South Eastern, Western and Southern zones of Tigray with the lowest levels in the Central and Northwestern zones of Tigray (Figure 4).
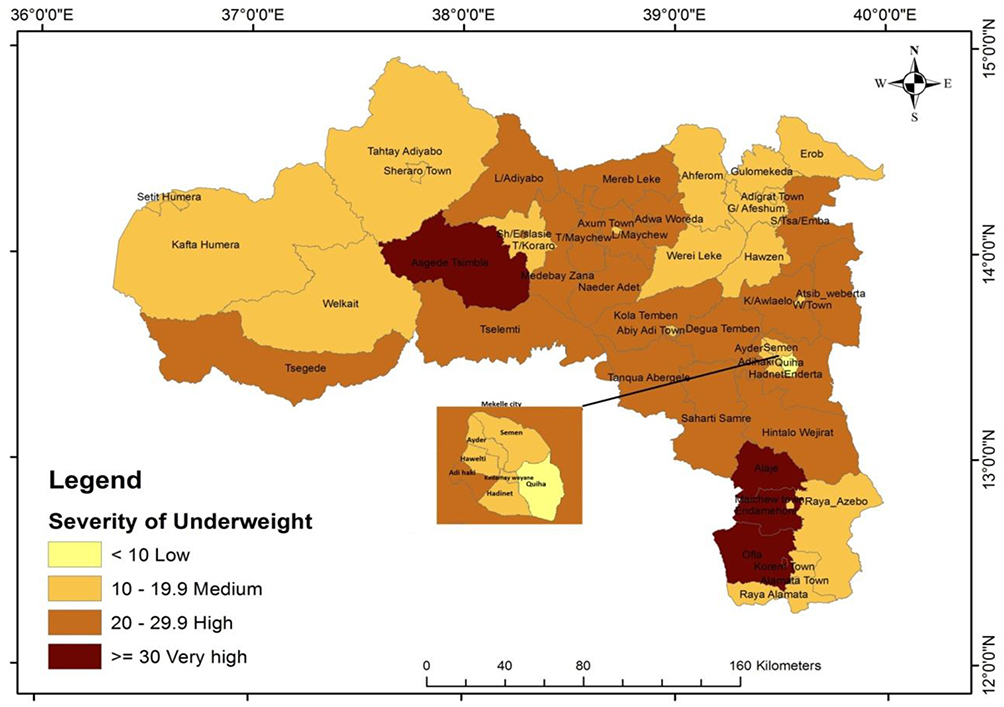 |
Figure 4 Woreda level severity of underweight among 6–59 month old children. |
Bivariate Analysis
The results obtained from bivariate analyses are shown in Table 3 below. The results showed that residence, child sex, child age, mother age, mother’s educational level, father’s education level, current breastfed, timing of child put to the breast after birth, had fever in the last 2 weeks, diarrhea in the last 2 weeks, food insecurity level of households, zone division, any signs of cough/pneumonia in the last 2 weeks, received deworming tablets in the last 6 months and ever heard nutrition information through mass media were found to be significant predictors of child underweight in the bivariate analyses. The proportion of severely malnourished and moderate malnourished children were found higher for rural residence (5.9% and 16.7% respectively), male (6.1% and 17.2%, respectively), had cough/pneumonia in the last 2 weeks (6.8% and 18.7%, respectively), and had diarrhea in the last 2 weeks (7.5% and 18.1%, respectively).
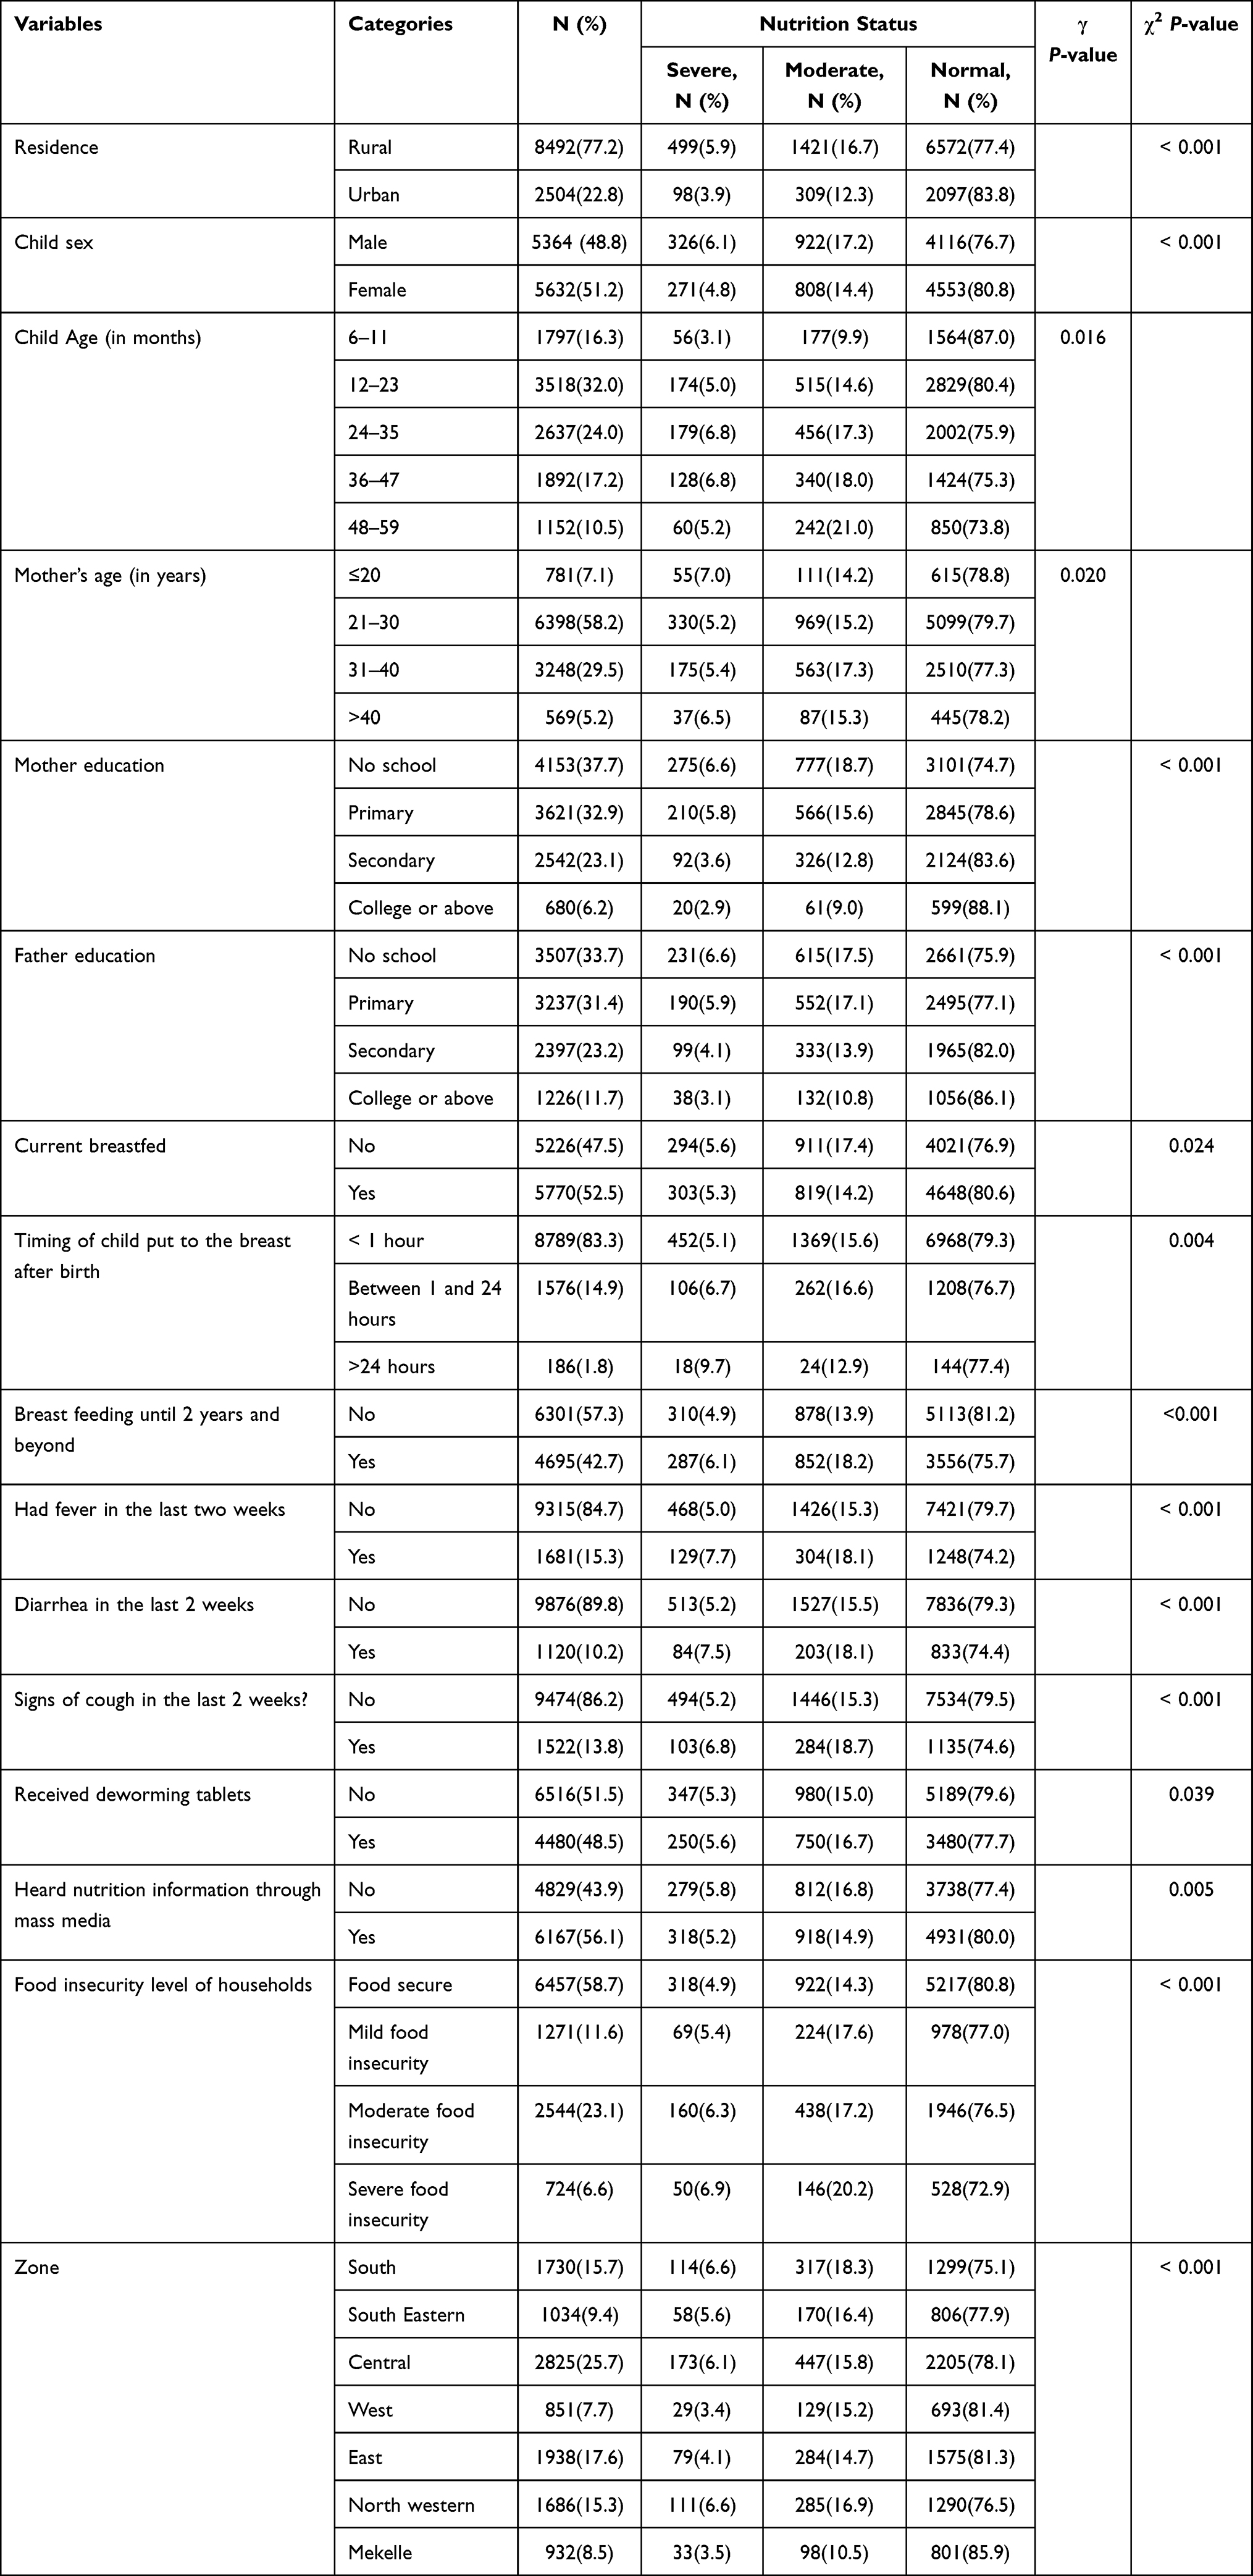 |
Table 3 Assessing the Association Between Selected Covariates (Independent Variables) and Underweight Status of Under-Five Children in Tigray, Ethiopia, 2019 (n = 10,996) |
Multivariable Ordinal Logistic Regression Analysis
The effects of the selected independent variables were estimated by fitting the POM. One of the assumptions underlying ordinal logistic regression is that the relationship between each pair of outcome groups is the same. This can be checked using the test of parallel lines in which the null hypothesis states that the slope coefficients in the model are the same across outcome categories. The deviance-based chi-square test (χ2= 23.03, P-value = 0.343) provided evidence that the data satisfied the parallel line of assumption. Thus, the POM is appropriate model for analyzing the considered data. Moreover, evaluating goodness of fit is an important step in the assessment of the adequacy of the model. The goodness of fit Pearson chi-square statistic (χ2 = 21.63, p-value = 0.199) indicated that the model fits the data well. The estimated effects of multivariable analysis are displayed in Table 4. The results showed that residence, child sex, child age, mother’s education, diarrhea in the last 2 weeks, signs of fever in the last 2 weeks, food insecurity level of households, cough or pneumonia and zone division were found to be significant predictors of child underweight status. The odds of being underweight were 28% higher for the male children compared to female children holding all other variables constant. The odds ratio could be as low as 1.17 and as high as 1.40 with 95% confidence. Children born to mothers that lived in rural areas were 1.28 times more likely to be severely underweight than children born to mothers that lived in urban areas.
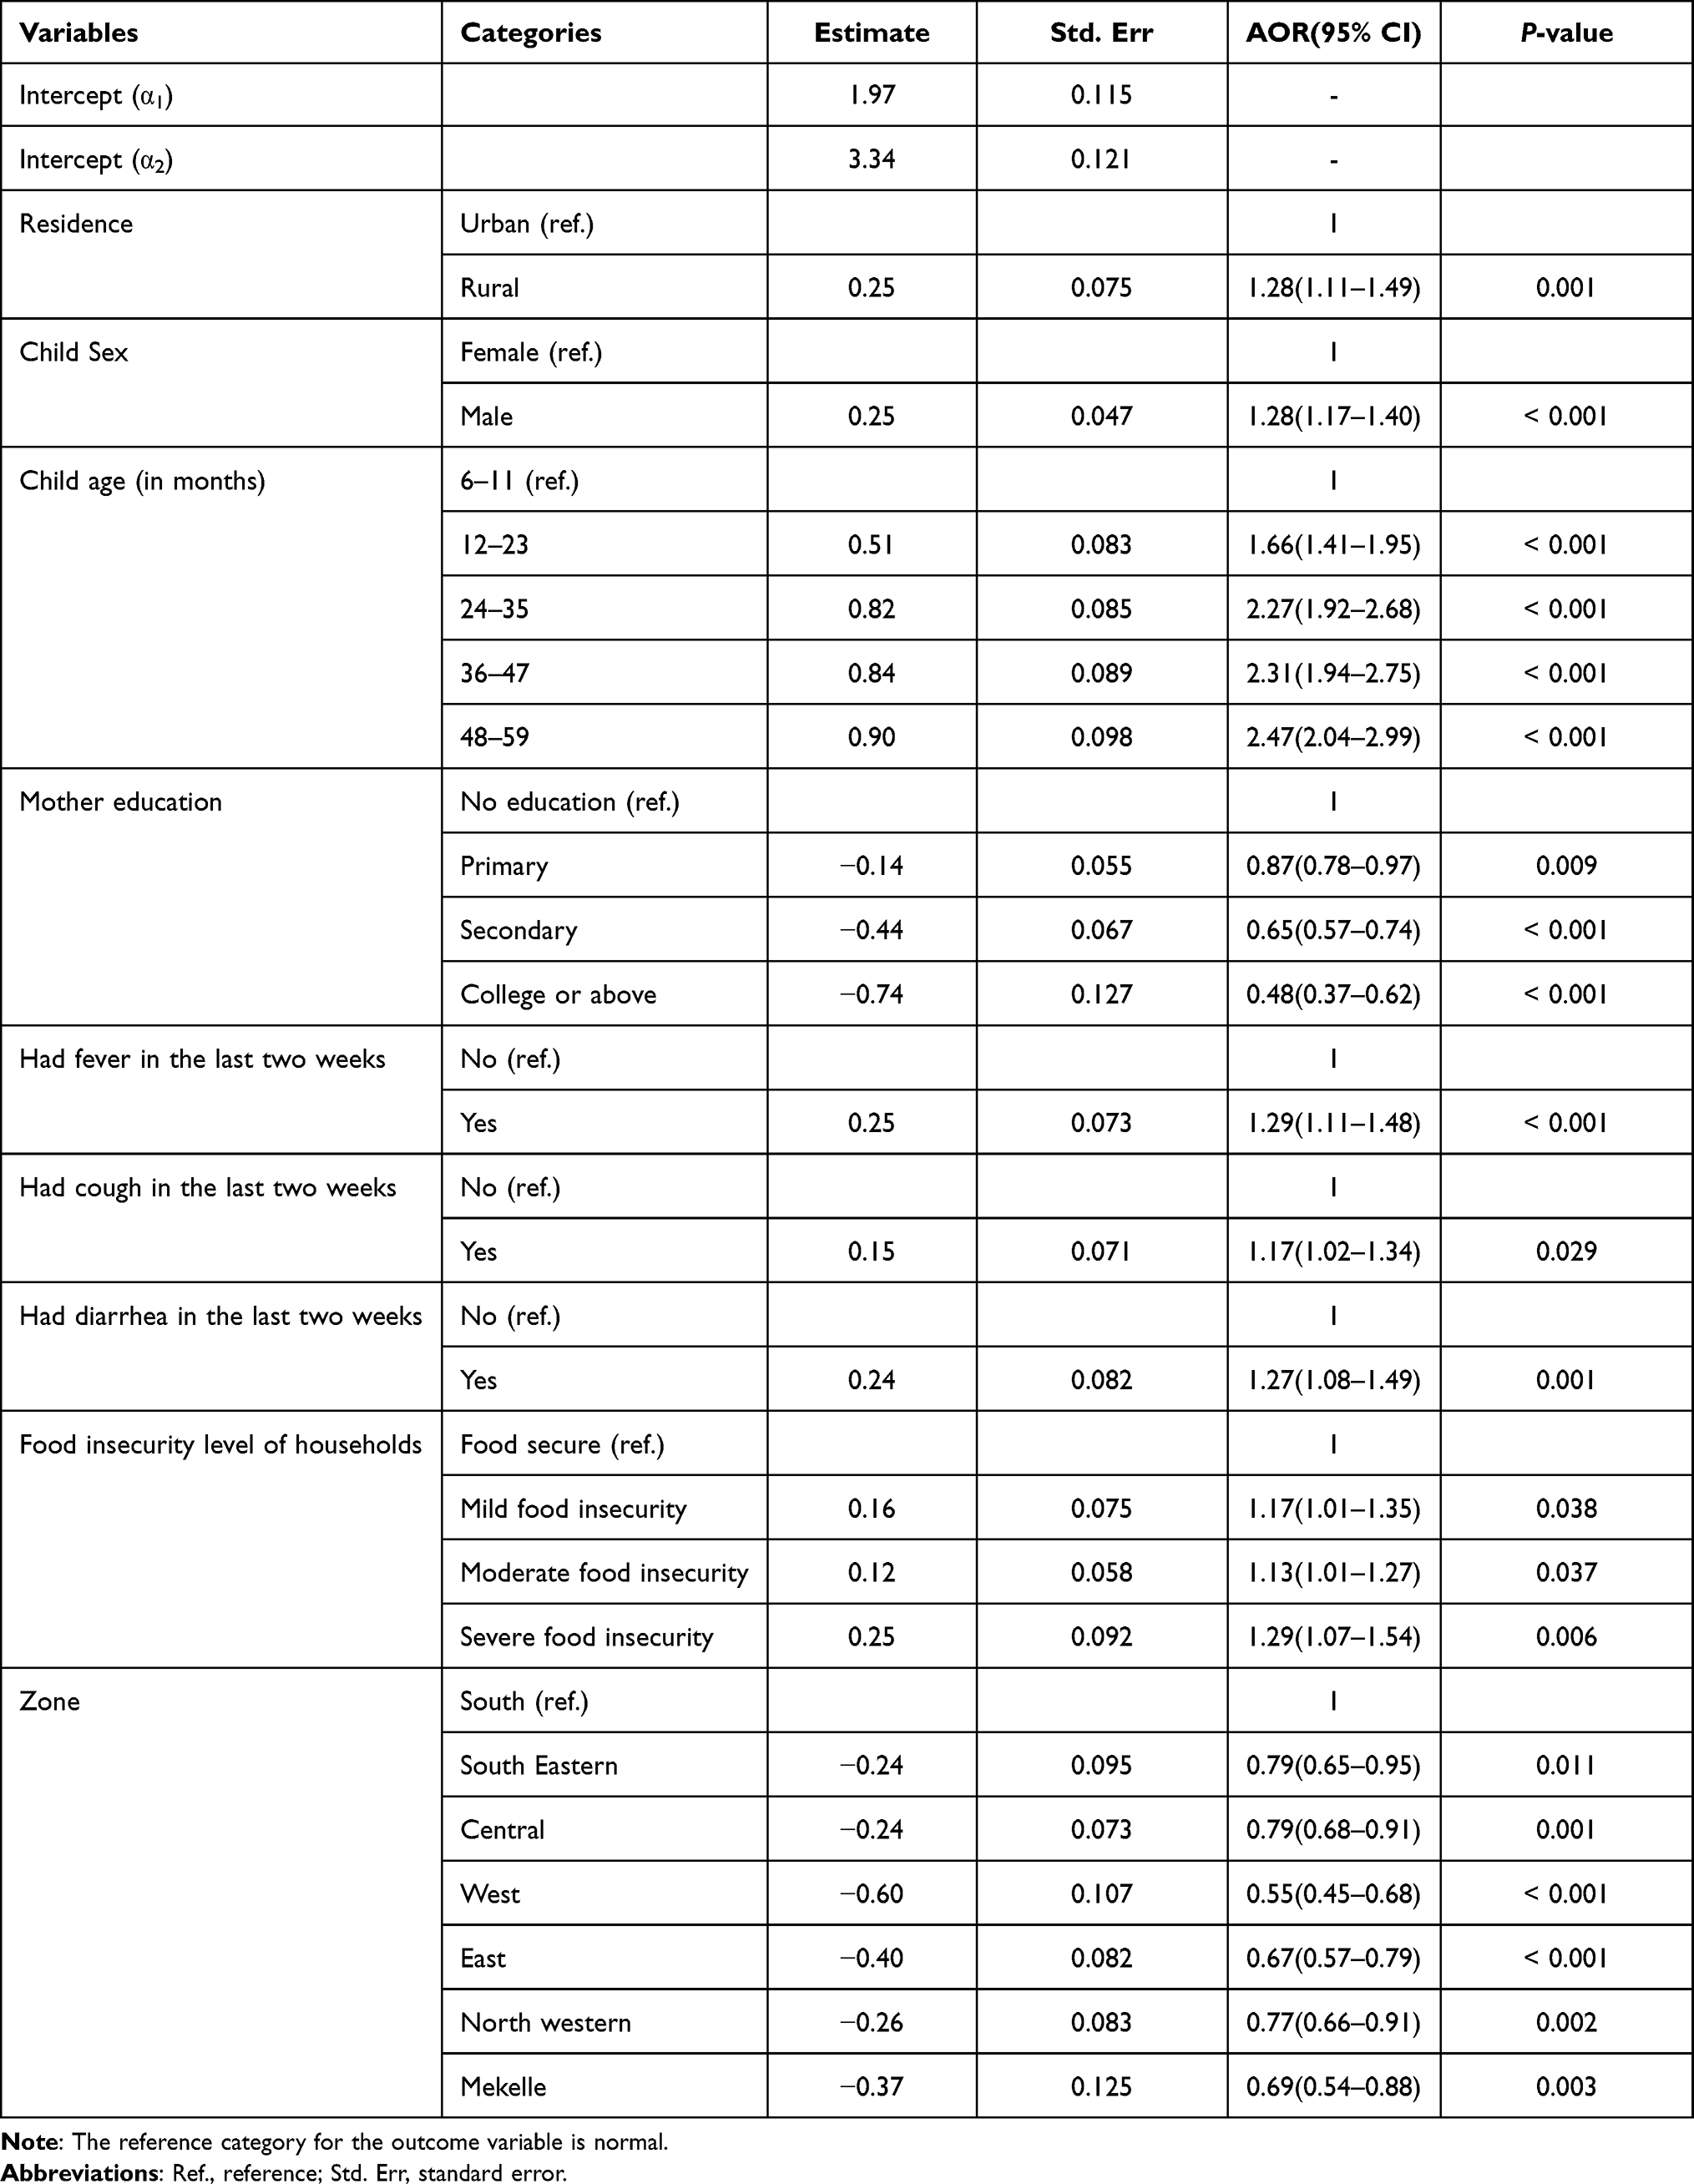 |
Table 4 Multivariable POM of Factors Associated with Underweight in Children Under-Five in Tigray, Ethiopia, 2019 (n = 10,996) |
The study revealed that child age is significantly related with underweight in children. Children with age from 6 to 11 months were less likely to be underweight compared to children from 12 to 59 months of age. The results revealed that the risk of severe underweight were 1.66, 2.27, 2.31 and 2.48 times higher among the children belonging to the age group 12–23, 24–35, 36–47 and 48–59 months respectively, when compared to children aged 6–11 months.
The study also showed that mother education level is significantly related with underweight. The low education level of the mother was significantly associated with underweight. Children whose mothers no education are more likely to be severely underweight than children whose mothers educated. Children whose mothers college or above education were 0.52 times less likely to be severely underweight than children whose mothers no education. Moreover, children experienced with diarrhea, cough/pneumonia and fever within last 2 weeks of the survey had 1.27, 1.17 and 1.29 times higher risk of being undernourished (severely underweight and moderately underweight) respectively when comparison is made with the children having no such problems. Regarding food insecurity level, children from severe food insecurity households were more likely to be underweight. Among the zone division, the risk of having underweight children was relatively lowest in western zone followed by east and Mekelle zone compared to southern zone.
Discussion
The finding of this study showed that 21.2% of the sampled children were underweight (severe 5.4% and moderate 15.7%). This was lower than the studies conducted in Gimbi (23.5%), Sheka south west Ethiopia (29%), Gojam (49.2%), Bule Hora district south Ethiopia (29.2%), Afar (24.8%), Pakistan (27.9%) and Bangladesh (28.8%).25,26,45–49 Similarly, the prevalence of underweight in the urban and rural areas were found to be 16.3% and 22.6%, respectively, which is higher than the study conducted in Pakistan.50 However, it is lower than the study conducted in Bangladesh.49 The discrepancy in findings could be due to the differences in the composition of study participants, sample size and settings. Moreover, the current prevalence of underweight among 6–59 month old children from Tigray was lower than the results reported in the recent mini EDHS (30.4%).51
The results of the POM showed that residence, child sex, child age, mother education, diarrhea in the past 2 weeks, fever in the past 2 weeks, food security level of households, cough in the past 2 weeks and place (zone) division were found to be significant predictors of child underweight status.
The odds of being underweight were higher for male children compared to female children, which is consistent with previous research studies.51,52 Male children are more vulnerable to develop malnutrition because they require more calories for growth and development.
In the current study, children born to mothers that lived in rural area were more likely to be severely underweight than children born to mothers that lived in urban areas, which is consistent with the previous studies conducted in developing countries.53–55 This might be due to the fact that urban residents have more access to information regarding child health and nutrition, health services, WASH and feeding practices. Similarly, significant clustering of underweight was found among 6–59 month old children mainly in the four zones of Tigray namely Southern, Central, South Eastern and North western. The risk of having underweight children was relatively lower in western zone, Mekelle zone and east zones compared to southern zone of Tigray.
Our study also showed that children of educated mothers were less likely to be underweight compared to the children of mothers with no education. This finding is also in agreement with several previous studies.17,27,50,56–59 This is partly because the higher-educated mother has better knowledge of child health and nutrition as well as have significant contribution to family income. Educated parents are well informed about the nutritional and health needs of their children. Moreover, they make comparative choices of available health services over traditional practices for improved healthcare of their children.48 Older children had a higher risk of underweight. Children within the age group 12–59 months old were more likely to be severely underweight compared to younger children (6–11 months old). The increase in child underweight with age indicates that the need of proper and timely initiation of complementary/supplementary feeding to meet the growing nutritional requirements of the children. Moreover, the POM indicated that children experienced with diarrhea, cough or fever within the last 2 weeks of the survey were more likely to be underweight than children who had not diarrhea, cough or fever. These findings were in line with previous studies, which showed that children with fever, cough/pneumonia or diarrhea were significantly associated with underweight.26,60,61 This could be due to the fact that infection adversely affects nutritional status and malnutrition adversely affects the ability of the host to resist infection. For instance, fever increases the metabolic and/or the energy needs of the child and cough causes rapid breathing, and congested nasal passages, interfering with a child’s ability to nurse or eat and hence reduce food intake. Diarrheal diseases interfere with absorption of nutrients because of rapid transit time and may contribute to mal-absorption of essential nutrients. In a vicious downward cycle, infection worsens malnutrition, thereby making the host more vulnerable to infections and further deteriorating nutritional status.
This study also showed that children from severe food insecurity households were more likely to be underweight compared to children from food secure households in line with various studies elsewhere.62–65 The quantity and quality (diversity) of foods from food insecure households are seriously compromised and hence insufficient intake of adequate and nutritious foods which might lead to poor nutritional status of children.
Limitations
As the study was based on a cross-sectional design, causal inference might not be strong between the outcome and independent variables. Moreover, there might be the possibility of recall and reporting bias in some child feeding indicators such as timing of child put to the breast after birth and breastfeeding patterns.
Conclusions
The findings of this study revealed higher prevalence of underweight among the 6–59 month old children in Tigray. Residence, child sex, child age, mother education, diarrhea, cough/pneumonia, fever, food security level of households and zone division were significantly associated with underweight. The findings of this study could help to update knowledge about possible causes of underweight among 6–59 month old children. Children who experience any kind of health problem especially fever, cough and diarrhea should immediately go to health centers. In order to decrease the burden of child underweight in the region, policy planners should develop strategies, which focused on improvement of parents’ educational level, prevention of common childhood illnesses, improvement of household food insecurity and improved access to basic health, nutrition and WASH services.
Accessibility of Data and Materials
The findings of this research were extracted from the data gathered and analyzed based on the stated methods and materials. The dataset supporting this finding can be obtained from the corresponding author upon request.
Funding
No funding was obtained for this study.
Disclosure
The authors declare no conflicts of interest in relation to this work and that there is no conflict concerning the publication of this manuscript.
References
1. Ahmed T, Hossain M, Sanin KI. Global burden of maternal and child undernutrition and micronutrient deficiencies. Ann Nutr Metab. 2012;61(1): 8–17. doi: 10.1159/000345165.
2. UNICEF, WHO, World Bank. Levels and trends in child malnutrition. Joint child malnutrition estimates. New York, NY, Geneva, Washington, DC: United Nations International Children’s Fund, World Health Organization, World Bank; 2012. Available from: https://www.who.int/publications/i/item/9789240025257.
3. Akombi BJ, Agho KE, Merom D, Renzaho AM, Hall JJ. Child malnutrition in sub-Saharan Africa: a meta-analysis of demographic and health surveys (2006–2016). PLoS One. 2017;12(5):e0177338. doi:10.1371/journal.pone.0177338
4. Shahid SM, Bishop KS. Comprehensive approaches to improving nutrition: future prospects. Nutrients. 2019;11(8):1760. doi:10.3390/nu11081760
5. de Onis M, Frongillo EA, Blossner M. Is malnutrition declining? An analysis of changes in levels of child malnutrition since 1980. Bull Pan Am Health Organ. 2000;78:1222–1233. doi:10.1590/S0042-96862000001000008
6. ACC/SCN: Nutrition throughout the life cycle. Fourth report on the world nutrition situation ACC/SCN in collaboration with IFPRI, Geneva, Switzerland; 2000. Available from: https://www.ifpri.org/publication/4th-report-world-nutrition-situation.
7. World Health Organization. World health statistics report; 2010. Available from: https://www.who.int/publications-detail-redirect/9789241564021.
8. Central Statistical Agency of Ethiopia and ICF International. Ethiopia Demographic and Health Survey 2000; 2000. Addis Ababa, Ethiopia and Calverton, Maryland, USA: Central Statistical Agency and ICF International. Available from: https://dhsprogram.com/pubs/pdf/FR118/FR118.pdf.
9. Central Statistical Agency of Ethiopia and ICF International. Ethiopia mini demographic and health survey 2019; 2019. Addis Ababa, Ethiopia and Calverton, Maryland, USA: Central Statistical Agency and ICF International. Available from: https://www.unicef.org/ethiopia/media/1721/file/The%202019%20Ethiopia%20Mini%20Demographic%20and%20Health%20Survey%20.pdf.
10. Behailu T, Afework M, Mache T, Girma A. Prevalence and risk factors of child malnutrition in community based nutrition program implementing and non-implementing districts from South East Amhara, Ethiopia. Open Access Libr J. 2014;1(03):1–17. doi:10.4236/oalib.1100425
11. Mihretie Y. Assessment of complementary feeding practice of infants and young children aged 6–23 months in Gode Town, Somali Regional State of Ethiopia. Arch Food Nutr Sci. 2017;1:045–057. doi:10.29328/journal.afns.1001008
12. Worku N, Erko B, Torben W, et al. Malnutrition and intestinal parasitic infections in school children of Gondar, North West Ethiopia. Ethiop Med J. 2009;47(1):9–16.
13. Das S, Gulshan J. Different forms of malnutrition among under-five children in Bangladesh: a cross sectional study on prevalence and determinants. BMC Nutr. 2017;3(1):1. doi:10.1186/s40795-016-0122-2
14. Tiwari R, Ausman LM, Agho KE. Determinants of stunting and severe stunting among under-fives: evidence from the 2011 Nepal demographic and health survey. BMC Pediatr. 2014;14:239. doi:10.1186/1471-2431-14-239
15. Akombi BJ, Agho KE, Merom D, Hall JJ, Renzaho AM. Multilevel analysis of factors associated with wasting and underweight among children under five years in Nigeria. Nutrients. 2017;9(1):44. doi:10.3390/nu9010044
16. Ersino G, Henry CJ, Zello GA. Suboptimal feeding practices and high levels of undernutrition among infants and young children in the rural communities of Halaba and Zeway, Ethiopia. Food Nutr Bull. 2016;37(3):409–424. doi:10.1177/0379572116658371
17. Chowdhury MR, Rahman MS, Khan MM, Mondal MN, Rahman MM, Billah B. Risk factors for child malnutrition in Bangladesh: a multilevel analysis of a nationwide population-based survey. J Pediatr. 2016;172:194–201. doi:10.1016/j.jpeds.2016.01.023
18. Pelletier DL, Frongillo EA, Schroeder DG, Habichit JP. The effects of malnutrition on child mortality in developing countries. Bull World Health Organ. 1995;73:443–448.
19. Caulfield LE, de Onis M, Blossner M, et al. Undernutrition as an underlying cause of child deaths associated with diarrhea, pneumonia, malaria, and measles. Am J Clin Nutr. 2004;80:193–198. doi:10.1093/ajcn/80.1.193
20. Wake M, Clifford SA, Patton GC, et al. Morbidity patterns among the underweight, overweight and obese between 2 and 18 years: population-based cross-sectional analyses. Int J Obes. 2013;37:86–93. doi:10.1038/ijo.2012.86
21. Black RE, Allen LH, Bhutta ZA, et al. Maternal and child undernutrition: global and regional exposures and health consequences. Lancet. 2008;371:243–260. doi:10.1016/S0140-6736(07)61690-0
22. Robert EB, Cesar GV, Susan PW, et al. Maternal and child under nutrition and overweight in low-income and middle-income countries. Lancet. 2013;382:427–451. doi:10.1016/S0140-6736(13)60937-X
23. Ezzati M, Lopez AD, Rodgers A, Vander Hoorn S, Murray CJ. Comparative risk assessment collaborating group; Selected major risk factors and global and regional burden of disease. Lancet. 2002;360:1347–1360. doi:10.1016/S0140-6736(02)11403-6
24. Christine MM, Ibironke O, Seth F, et al. The effect of multiple anthropometric deficits on child mortality: meta-analysis of individual data in 10 prospective studies from developing countries. Am J Clin Nutr. 2013;97:896–901. doi:10.3945/ajcn.112.047639
25. Kebede E. Prevalence and determinants of child malnutrition in Gimbi district, Oromia region, Ethiopia Comparative cross-sectional study. Available from: https://www.amazon.com/Prevalence-Determinants-Child-Malnutrition-Ethiopia/dp/3639172647.
26. Yilkal M, Kassahun T. Determining risk factors of malnutrition among under – five children in Sheka Zone, South West Ethiopia using ordinal logistic regression analysis. Public Health Res. 2016;6(6):161–167. doi:10.5923/j.phr.20160606.03
27. Ayana AB, Hailemariam TW, Melke AS. Determinants of acute malnutrition among children aged 6–59 months in Public Hospitals, Oromia region, West Ethiopia: a case-control study. BMC Nutr. 2015;1:34. doi:10.1186/s40795-015-0031-9
28. Demissie S, Worku A. Magnitude and factors associated with malnutrition in children 6–59 months of age in pastoral community of Dollo ado district, Somali region, Ethiopia. Sci J Public Health. 2013;1(4):175–183. doi:10.11648/j.sjph.20130104.12
29. Yiska H, Gobena T, Mesfin F. Prevalence and risk factors for under nutrition among children under five at Haramaya district, Eastern Ethiopia. BMC Pediatr. 2015;15:212. doi:10.1186/s12887-015-0535-0
30. Abdilahi MA, Nur AM, Jibril AD. Prevalence of acute malnutrition and associated factors among under-five children in Gursum District, Somali Region, Ethiopia. Sci J Public Health. 2020;8(4):123–129. doi:10.11648/j.sjph.20200804.15
31. Ma’alin A, Birhanu D, Melaku S, Tolossa D, Mohammed Y, Gebremicheal K. Magnitude and factors associated with malnutrition in children 6–59 months of age in Shinille Woreda, Ethiopian Somali regional state: a cross-sectional study. BMC Nutr. 2016;2:44. doi:10.1186/s40795-016-0079-1
32. Bekele S, Fekadu G, Achamyeleh A. Prevalence and factors associated with acute malnutrition among children in Kamashi District, Benishangul Gumuz Region, Western Ethiopia; 2019. doi: 10.21203/rs.3.rs-134719/v1.
33. Amaha K, Afework M, Omer S. Nutritional status of children (6–59 months) from food secure and food insecure households in rural communities of Saesie Tsaeda-Emba District, Tigray, North Ethiopia: comparative study. Clin Med Res. 2015;4(1):51–65. doi:10.11648/j.ijnfs.20150401.18
34. Anteneh T, Dejene H, Tafese B. Nutritional status and associated factors among pastoralist children aged 6–23 months in Benna Tsemay Woreda, South Omo Zone, Southern Ethiopia. Int J Nutr Food Sci. 2018;7(1):11–23. doi:10.11648/j.ijnfs.20180701.13
35. Melkie E. Assessment of nutritional status of preschool children ofGumbrit, North West Ethiopia. Ethiop J Health Dev. 2007;21(2):125–129.
36. Yirgu F, Addisalem M, Demewoz H, Barbara JS. Factors associated with nutritional status of infants and young children in Somali Region, Ethiopia: a cross- sectional study. BMC Public Health. 2015;15:846. doi:10.1186/s12889-015-2190-7
37. Melese ST, Bedatu G, Kalkidan H. Prevalence of undernutrition and associated factors among preschool children in Jimma Town, South West Ethiopia. Afr J Food Agric Nutr Dev. 2020;20(3):15954–15977. doi:10.18697/ajfand.91.18255
38. Central Statistical Agency. Population Projections for Ethiopia 2007–2037, Addis Ababa, Ethiopia, July 2013. Central Statistical Agency; July, 2013. Available from: https://www.worldcat.org/title/population-projections-for-ethiopia-2007-2037/oclc/906131187.
39. Central Statistical Agency (CSA) [Ethiopia] and ICF. Ethiopia Demographic and 380 Health Survey 2016: key Indicators Report. Addis Ababa, Ethiopia, and Rockville, 381 Maryland, USA: CSA and ICF; 2016. Available from: https://www.usaid.gov/sites/default/files/documents/1860/Ethiopia%20DHS%202016%20KIR%20-%20Final%2010-17-2016.pdf.
40. United Nations Children’s Fund. Strategy for improved nutrition of children and women in developing countries. Indian J Pediatr. 1991;58:13–24. doi:10.1007/BF02810402
41. World Health Organization. Bulletin OMS; 1994: 685–691.
42. Coates J, Anne S, Paula B. Household Food Insecurity Access Scale (HFIAS) for measurement of household food access: indicator guide (v. 3). Washington, D.C.: Food and Nutrition Technical Assistance Project, Academy for Educational Development; August, 2007. https://pdf.usaid.gov/pdf_docs/Pnadk896.pdf.
43. Ananth CV, Kleinbaum DG. Regression models for ordinal responses: a review of methods and applications. Int J Epidemiol. 1997;26:1323–1333. doi:10.1093/ije/26.6.1323
44. Peterson B, Harrell FE
45. Teshome B, Kogi- Makau W, Getahun Z, Taye G. Magnitude and determinants of stunting in children under-five years of age in food surplus region of west Gojam zone. Ethiop J Health Dev. 2009;23(2). doi:10.4314/ejhd.v23i2.53223
46. Mandefro A, Mekitie W, Mohammed T, Lemessa D. Prevalence of undernutrition and associated factors among children between six to fifty-nine months in Bule Hora, South Ethiopia. BMC Public Health. 2015;15:41. doi:10.1186/s12889-015-1370-9
47. Abel G, Surender R, Afework M, Yayo S, Molla K. Prevalence of malnutrition and associated factors among under-five children in pastoral communities of Afar Regional State, Northeast Ethiopia: a community-based cross-sectional study. J Nutr Metab. 2019:13. Article ID 9187609. doi:10.1155/2019/9187609
48. Jawad T, Amal S, Rubeena Z, Muhammad ZZ, Florian F. Factors associated with undernutrition in children under the age of two years: secondary data analysis based on the Pakistan demographic and health survey 2012–2013. Nutrients. 2018;10(6):676. doi:10.3390/nu10060676
49. Ashis T. Factors associated with malnutrition among under-five children: illustration using Bangladesh demographic and health survey, 2014 data. Children. 2017;4(10):88. doi:10.3390/children4100088
50. Sadaf K, Sidra Z, Nilofer FS. Determinants of stunting, underweight and wasting among children < 5 years of age: evidence from 2012–2013 Pakistan demographic and health survey. BMC Public Health. 2019;19:358. doi:10.1186/s12889-019-6688-2
51. Ethiopian Public Health Institute (EPHI) [Ethiopia] and ICF. Ethiopia mini demographic and health survey 2019: key indicators. Rockville, Maryland, USA: EPHI and ICF; 2019. Available from: https://www.unicef.org/ethiopia/media/1721/file/The%202019%20Ethiopia%20Mini%20Demographic%20and%20Health%20Survey%20.pdf.
52. Kavosi E, Rostami ZH, Kavosi Z, Nasihatkon A, Moghadami M, Heidari M. Prevalence and determinants of under-nutrition among children under six: a cross-sectional survey in Fars province, Iran. Int J Health Policy Manag. 2014;3(2):71–76. doi:10.15171/ijhpm.2014.63
53. Md MR. Is unwanted birth associated with child malnutrition in Bangladesh? Int Perspect Sex Reprod Health. 2015:41(2):80–88. doi:10.1363/4108015
54. Van de Poel E, O’Donnell O, Van Doorslaer E. Are urban children really healthier? Evidence from 47 developing countries. Soc Sci Med. 2007;65(10):1986–2003. doi:10.1016/j.socscimed.2007.06.032
55. Srinivasan CS, Zanello G, Shankar B. Rural-urban disparities in child nutrition in Bangladesh and Nepal. BMC Public Health. 2013;13(1):581.
56. Nahar B, Ahmed T, Brown K, Hossain MI. Risk factors associated with severe underweight among young children reporting to a diarrhoea treatment facility in Bangladesh. J Health Popul Nutr. 2010;28:476–483. doi:10.3329/jhpn.v28i5.6156
57. Urke HB, Bull T, Mittelmark MB. Socioeconomic status and chronic child malnutrition: wealth and maternal education matter more in the Peruvian Andes than nationally. Nutr Res. 2011;31:741–747. doi:10.1016/j.nutres.2011.09.007
58. Jesmin A, Yamamoto SS, Malik AA, Haque A. Prevalence and determinants of chronic malnutrition among preschool children: a cross-sectional study in Dhaka City, Bangladesh. J Health Popul Nutr. 2001;29:494–509. doi:10.3329/jhpn.v29i5.8903
59. Janevic T, Petrovic O, Bjelic I, Kubera A. Risk factors for childhood malnutrition in Roma settlements in Serbia. BMC Public Health. 2010;10:509.
60. Das S, Rahman RM. Application of ordinal logistic regression analysis in determining risk factors of child malnutrition in Bangladesh. Nutr J. 2011;10:124. doi:10.1186/1475-2891-10-124
61. Masibo PK. Trends and determinants of malnutrition among children age 0–59 months in Kenya (KDHS 1993, 1998, 2003, and 2008–09). ICF International; 2013. DHS Working Papers No. 89 Available from: https://dhsprogram.com/pubs/pdf/WP89/WP89.pdf.
62. Psaki S, Bhutta ZA, Ahmed T, et al. Household food access and child malnutrition: results from the eight-country MALED study. Popul Health Metr. 2012;10(1):24. doi:10.1186/1478-7954-10-24
63. Matheson DM, Varady J, Varady A, Killen JD. Household food security and nutritional status of Hispanic children in the fifth grade. Am J Clin Nutr. 2002;76(1):210–217. doi:10.1093/ajcn/76.1.210
64. Saha KK, Frongillo EA, Alam DS, Arifeen SE, Persson LA, Rasmussen KM. Household food security is associated with growth of infants and young children in rural Bangladesh. Public Health Nutr. 2009;12(9):1556–1562. doi:10.1017/S1368980009004765
65. Hackett M, Melgar-Quinonez H, Alvarez MC. Household food insecurity associated with stunting and underweight among preschool children in Antioquia, Colombia. Rev Panam Salud Publica. 2009;25(6):506–510. doi:10.1590/s1020-49892009000600006
 © 2022 The Author(s). This work is published and licensed by Dove Medical Press Limited. The full terms of this license are available at https://www.dovepress.com/terms.php and incorporate the Creative Commons Attribution - Non Commercial (unported, v3.0) License.
By accessing the work you hereby accept the Terms. Non-commercial uses of the work are permitted without any further permission from Dove Medical Press Limited, provided the work is properly attributed. For permission for commercial use of this work, please see paragraphs 4.2 and 5 of our Terms.
© 2022 The Author(s). This work is published and licensed by Dove Medical Press Limited. The full terms of this license are available at https://www.dovepress.com/terms.php and incorporate the Creative Commons Attribution - Non Commercial (unported, v3.0) License.
By accessing the work you hereby accept the Terms. Non-commercial uses of the work are permitted without any further permission from Dove Medical Press Limited, provided the work is properly attributed. For permission for commercial use of this work, please see paragraphs 4.2 and 5 of our Terms.