")
Back to Journals » Journal of Pain Research » Volume 10
Risk and protective factors in the clinical rehabilitation of chronic back pain
Authors Wippert PM , Fliesser M, Krause M
Received 17 February 2017
Accepted for publication 31 May 2017
Published 6 July 2017 Volume 2017:10 Pages 1569—1579
DOI https://doi.org/10.2147/JPR.S134976
Checked for plagiarism Yes
Review by Single anonymous peer review
Peer reviewer comments 2
Editor who approved publication: Dr Katherine Hanlon
Pia-Maria Wippert,1,2 Michael Fliesser,1 Matthias Krause,3
1Department of Health Sciences, Institute for Sociology of Health and Physical Activity, University of Potsdam, Potsdam, Germany; 2Department of Health Sciences and Technology, ETH Zürich, Zürich, Switzerland; 3Median-Rehabilitation Clinic, Hoppegarten, Germany
Objectives: Chronic back pain (CBP) can lead to disability and burden. In addition to its medical causes, its development is influenced by psychosocial risk factors, the so-called flag factors, which are categorized and integrated into many treatment guidelines. Currently, most studies investigate single flag factors, which limit the estimation of individual factor significance in the development of chronic pain. Furthermore, factors concerning patients’ lifestyle, biography and treatment history are often neglected. Therefore, the objectives of the present study are to identify commonly neglected factors of CBP and integrate them into an analysis model comparing their significance with established flag factors.
Methods: A total of 24 patients and therapists were cross-sectionally interviewed to identify commonly neglected factors of CBP. Subsequently, the impact of these factors was surveyed in a longitudinal study. In two rehabilitation clinics, CBP patients (n = 145) were examined before and 6 months after a 3-week inpatient rehabilitation. Outcome variables, chronification factor pain experience (CF-PE) and chronification factor disability (CF-D), were ascertained with confirmatory factor analysis (CFA) of standardized questionnaires. Predictors were evaluated using stepwise calculations of simple and multiple regression models.
Results: Through interviews, medical history, iatrogenic factors, poor compliance, critical life events (LEs), social support (SS) type and effort–reward were identified as commonly neglected factors. However, only the final three held significance in comparison to established factors such as depression and pain-related cognitions. Longitudinally, lifestyle factors found to influence future pain were initial pain, physically demanding work, nicotine consumption, gender and rehabilitation clinic. LEs were unexpectedly found to be a strong predictor of future pain, as were the protective factors, reward at work and perceived SS.
Discussion: These findings shed insight regarding often overlooked factors in the development of CBP, suggesting that more detailed operationalization and superordinate frameworks would be beneficial to further research.
Conclusion: In particular, LEs should be taken into account in future research. Protective factors should be integrated in therapeutic settings.
Keywords: yellow flags, life events, clinical pain research
Introduction
Low back pain is the most predominant form of back pain with the lifetime prevalence being between 51% and 84%.1,2 The 1-year incidence of a first episode ranges from 13.5% to 26.2%, but the rate of recurrence is even greater, 24.0%–80.0% in a 1-year follow-up.3,4 Approximately 8.5% of these affected persons then go on to develop chronic back pain (CBP). With an international prevalence of 23%, CBP is the most common form of chronic pain and is a frequent cause of short-term disability, absenteeism at work and the enormous economic consequences they entail.1,5
CBP affects all ages and social classes, whereby the majority of affected persons show no specific somatic pathology. Attributing the biopsychosocial model, different social and psychological factors seem to exert considerable influence on the chronification of back pain.6 These factors support the development of prolonged disability, chronicity and failure to return to work. These are described with the term flag factors.7 The flag system represents a conceptual framework, which includes both actuarial data and individually assessed risk factors, while offering a systems perspective through clinical and occupational elements.8 This helps practitioners to distinguish between individual perception and objective features to then create specific interventions targeted at modifiable risks. In the past, the following factors have been proposed in different flag domains:9
- sociodemographic factors such as age, gender, socioeconomic status and cultural conditions,4,10
- behavioral factors such as fear avoidance, endurance, catastrophizing, anxiety and depression,10–15 and
- occupational factors such as employment status/dissatisfaction/expectations/body posture and social support (SS) at the workplace.14,16–18
Flag domains are often further divided into subcategories of yellow, red, black and blue flags, depending on their estimated impact,7 whereby the yellow flags are most established. A further subcategory, orange, encompasses factors whose influence remain unclear.9 However, this division into different colors is generally based on reviews and/or studies testing single flag factors. Here, one must use caution, as how these flag factors interact is still unknown. Furthermore, orange factors (e.g., life events [LEs]), confounding lifestyle factors (e.g., substance abuse, obesity, physical activity, sleep, etc.) or medical care factors (e.g., medication, medical care provider, treatment history, etc.) are rarely integrated into these studies, nor are their interactions tested together with the aforementioned established flag factors. Especially, protective factors, such as SS, are not incorporated in the flag approach to risk identification.
In addition to these neglected factors, the methods of flag factor operationalization remain vague. For example, work-related stress is often defined as low job satisfaction, demanding physical work, interpersonal stress at work or as “heavy work with little opportunity to modify duties”.7,14,17,19,20 The situation is similar to distress, often operationalized as general stress without considering the type, frequency or impact of a stressor.19 Most operationalizations also lack key stressors (such as lack of gratification, LEs or social isolation), which stimulate activity on pathophysiological pathways and lead to an accumulation of physiological load over time – as is also described in the neuromatrix theory of pain.21–26 Furthermore, many studies suffer from a weak operationalization of the outcome pain. It is often measured only using single parameters (e.g., visual analog scale), which extremely limits the impact of the results.9
For this reason, the objective of the present study was twofold: 1) to qualitatively identify commonly neglected factors of CBP, not yet extensively researched or part of the flag catalog and 2) to investigate their significance in comparison to established flag factors in the treatment of CBP in which clear operationalization of flag factors and the outcome pain were applied.
Methods
Design
Preliminary study
Identification of commonly neglected factors of CBP related to lifestyle, medical, social, as well as biographical contexts, through structured interviews was conducted in two orthopedic rehabilitation clinics in Berlin-Brandenburg. Afterward, interviews were analytically evaluated for content.27
Treatment study
Based on preliminary study results, a longitudinal study was designed and participants were recruited in one of two orthopedic rehabilitation clinics. Psychometric assessments took place before (t1) and 6 months after inpatient orthopedic rehabilitation (t2). A medical examination was conducted at baseline.
Predictor variables were derived from theoretical (potential factors) and empirical (factors identified in the preliminary study) sources and then operationalized to the greatest extent using standardized psychometric tests. To measure the back pain criterion, a variety of pain questionnaires were used, yielding the assessment of two important dimensions of chronic pain, chronification factor pain experience (CF-PE) and chronification factor disability (CF-D).
Participants
Preliminary study
Ten health care providers (four doctors, four physiotherapists and two psychologists; age: 50.7 ± 0.6 years; six males) and 14 CBP patients (age 47.8 ± 4.0 years, five males) were recruited at two orthopedic rehabilitation clinics. Inclusion criterion enforced for health care providers was professional experience >5 years. Health care providers from all health care areas were included. Patients were eligible to participate if they had suffered from CBP (ICD-10, M50–M54) upon admission to their 3-week inpatient rehabilitation in an orthopedic clinic. Other inclusion criteria included, 1) age: 35–60 years; 2) conservatively treated or operated slipped disks and spinal canal stenosis of the entire spinal column (chronification prior to operation <1 year); 3) a duration of illness >3 months, and 4) acute discomfort. Patients with relapse operations were excluded. Inclusion criteria were based on social laws in Germany, which protect the legal right for inpatient rehabilitation in certified rehabilitation clinics, offering the same treatment framework (§21, SGB IX).28
Treatment study
A total of 220 patients matched all inclusion criteria and were asked to participate in the treatment study. In all, 60 patients refused to take part and 14 more patients had to be excluded because they did not complete necessary parts of the questionnaires (e.g., pain questions), leading to a final sample at t1 of 145 participants (participation rate: 67%; age: 48.5 ± 6.4 years; female = 73%, 96% Germans). A total of 111 participants (age: 48.80 ± 6.4 years; dropout: 26.21%) took part at the follow-up (on average 6.6 months later) (Figure 1). Both clinics offered multimodal treatments (manual, exercise and psychological) conforming to the standardized treatment protocol of the German pension foundation clinics.
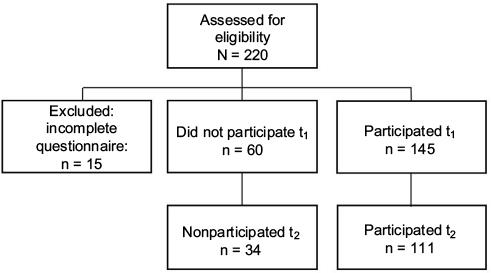 | Figure 1 Enrollment of CBP patients (t1 = beginning of back pain rehabilitation, t2 = 6 months after back pain rehabilitation). Abbreviations: CBP, chronic back pain; n, number of participants |
Survey procedure
Preliminary study instruments
To reveal influencing factors of CBP from the perspective of health care providers and individuals concerned, two interview guidelines were created, one for health care providers and one for patients. The interview guidelines for health care providers focused on their experience concerning causes for CBP, typical treatment courses and individually preferred treatments. Patient guidelines focused on pain history (starting from first occurrence to development, medical treatment and rehabilitation). Patients further described their biography in as much detail as possible (childhood, relationships, job career, leisure time activities, prior illnesses and critical LEs). Both interview guidelines were constructed in a way to allow open answering, spontaneous expression and a dialogue as natural as possible.29,30
Treatment study instruments: baseline prediction variables
Stress was assessed using the Perceived Stress Scale (PSS), which examines the frequency of stress experiences in the last 12 months (Cronbach’s alpha = 0.83).31 Critical LEs were obtained through the short version of the inventory of life-changing events, which inquires about the total number of events, temporal sequences, 1) maximum 1 year ago, 2) 1–5 years ago, 3) 5–10 years ago, and 4) over 10 years ago, as well as the developmental stage in which the event occurred (childhood: ≤11 years, adolescence: 12–25 years, adulthood: >25 years).32 Stress at the workplace was evaluated using the Effort–Reward Imbalance (ERI) questionnaire (Cronbach’s alpha = 0.82), which assesses the perceived balance between individual effort and reward in the context of work.33 For better comprehensibility, the degree of balance between effort and reward was log-transformed.34
Anxiety and depression were quantified by the Hospital Anxiety and Depression Scale (HADS-D; Cronbach’s alpha = 0.87). Pain-related cognitions were assessed using the Fear-Avoidance Beliefs Questionnaire (FABQ-D; Cronbach’s alpha = 0.86).35,36
Sociodemographic and social status were characterized with the Winkler-Scheuch-Index (WSI), which represents social classes and ranges from 3 (lowest score) to 21.37 Furthermore, lifestyle factors (cigarette and alcohol consumption, medication intake, physical activity) and medical care factors (insurance, doctor’s visits, plans for disability pension) were obtained by standardized single questions.38
Subjective pain was acquired through the Chronic Pain Grade (CPG) questionnaire, an instrument for classifying pain patients in terms of subjective pain intensity (PI; 0 = “no pain” to 100 = “the worst pain imaginable”) and disability (DS; 0 = “no disability” to 100 = “I was incapable of doing anything”) in the past 3 months (Cronbach’s alpha = 0.83).39
Treatment study instruments: criterion variables
Follow-ups comprised extensive, standardized CBP questionnaires yielding an assessment of pain experience and disability; two important dimensions of chronic pain.
Subjective pain
In addition to the CPG questionnaire described earlier (t2) Cronbach’s alpha = 0.95), participants completed the pain description list (Schmerzbeschreibungsliste, SBL), which describes sensory and affective pain components.40
Psychosomatic symptoms were assessed with the Brief Symptom Inventory (BSI; SCL-60; Cronbach’s alpha = 0.96).41
Health-related quality of life was evaluated using the Short-Form Health Survey (SF-36), which includes both physical (PCS) and mental health (MCS) components that are scored between 0 and 100 (Cronbach’s alpha = 0.96).42 Each of these components can be further divided into four scales: physical functioning, role-physical, bodily pain and general health and vitality, social functioning, role-emotional and mental health.
Work ability was evaluated using the Work Ability Index (WAI; Cronbach’s alpha = 0.85), which determines work ability through seven dimensions.43 For all dimensions, a greater score indicates greater estimated work ability. Summing up dimensions yields a WAI that ranges from 7 (“minimal work ability”) to 49 (“maximum work ability”).
Evaluation and data analysis
Preliminary study
After transcribing interviews and anonymizing all necessary information pertaining to the interview partner, data were evaluated using qualitative content analyses as suggested by Mayring and Fenzl44 using a categorization system with the software MAXQDA.
Treatment study
Data were analyzed descriptively using the IBM SPSS Statistics program and the statistics software R. Before regression calculations, confirmatory factor analysis (CFA) was used to operationalize different chronicity dimensions (pain/disability). Thereby, a two-factor structure with factors “experience of pain” and “disability due to pain” was assumed (Figure 2). Analysis confirmed the two-factor structure (c2[13, 105] = 16.080, p = 0.245, root mean square error of approximation [RMSEA] = 0.048, comparative fit index [CFI] = 0.994) with a good model fit. This led to the usage of the two CF-factor scores “experience of pain” (CF-PE) and “disability due to pain” (CF-D) in the analysis of overall chronification. The CF-D bundled CPG subscale “subjective disability”, SF-36 sub-scales “physical function” and “physical role function” and WAI. Indicators for pain experience factor (CF-PE) were CPG subscale “subjective PI,” SBL subscale “affective pain experience” and SF-36 subscale “physical pain.” While CF-D represents a clear dimension of functional disability and work inability, CF-PE summarizes different dimensions (affective, psychosomatic and intensity of pain). Greater values for CF factors suggest greater disability or more intense pain experiences (factor scores for CF-D [0.05 ± 2.07; Min = -4.02; Max = 4.17) and CF-PE [-0.13 ± 3.08; Min = -5.04; Max = 6.96]).
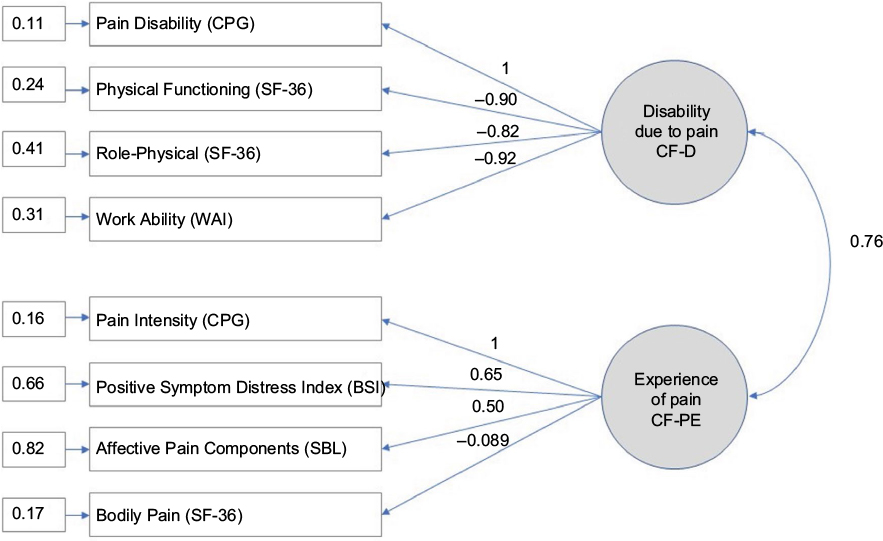 | Figure 2 CFA using a two-factor model “disability due to pain” (CF-D) and “experience of pain” (CF-PE). Abbreviations: CFA, confirmatory factor analysis; CPG, Chronic Pain Grade Questionnaire; SF-36, Short-Form Health Survey; WAI, Work Ability Index; BSI, Brief Symptom Inventory; SBL, Schmerzbeschreibungsliste (pain description list); CF-PE, chronification factor pain experience; CF-D, chronification factor disability. |
Afterward, the influences of commonly neglected lifestyle and medical care factors (identified in the preliminary study and literature) were calculated in separate regression models for both dimensions (CF-PE and CF-D). In a second step, all significant lifestyle and medical care factors were entered into one multiple regression model to assess their influence on pain and disability (CF-PE and CF-D). Finally, all remaining lifestyle and medical care factors were used as control variables within multiple regression models where the influence on pain and disability (CF-PE and CF-D) of established flag factors (e.g., pain-related cognitions, anxiety, depression and stress), commonly neglected factors (e.g., LEs, job gratification) and protective factors (e.g., SS) was assessed. All calculations controlled for age and initial pain at baseline.
To observe development over time, the time interval between baseline and follow-up was centered on the total average value of 6.6 months and fed into all multiple regression models as a control variable. Group differences were tested using dependent t-tests and Cohen’s standardized effect size.45
Ethics approval
All participants, including therapists, provided written informed consent prior to study participation. This research is in accordance with the latest revision of the Declaration of Helsinki and was approved by the ethics review board of the University of Potsdam (01/2012).
Results
Preliminary study
Patients’ interviews named recent LEs (e.g., divorce), stress or an ERI at the workplace (e.g., lack of gratification, high pressure) as well as medical care factors (iatrogenic factors, case history, duration, therapy implements) most often as reasons for their onsets of pain episodes and their individual pain history. In contrast, medical experts designated attitudes (e.g., endurance), ERI in the workplace, unfavorable imbalances in family context (SS/family demands), gender (female), poor treatment compliance and medical care factors (iatrogenic factors) as reasons for the pain histories of their patients.
Treatment study
Descriptions
Lifestyle and medical care
Almost all participants were primarily covered by statutory health insurances (Table 1). Their distance to medical care providers was low (distance: general physician: M = 4.6 ± 6.1 km; specialist: M = 9.7 ± 9.4 km; hospital: M = 8.8 ± 8.1 km), with high utilization grades and medication access. On average, participants had been to their general physician three times (3.0 ± 3.1) and their specialist four times (4.4 ± 3.8) in the past 3 months. All participants had completed at least secondary education and were receiving a net household income ranging from <€2,250 (66%) up to €3,000 (19%). In all, 37% of participants performed their work while seated and 36% regularly lifted heavy loads (>20 kg). Approximately 40% of participants smoked tobacco regularly, 20% drank alcohol regularly, and 40% were physically active.
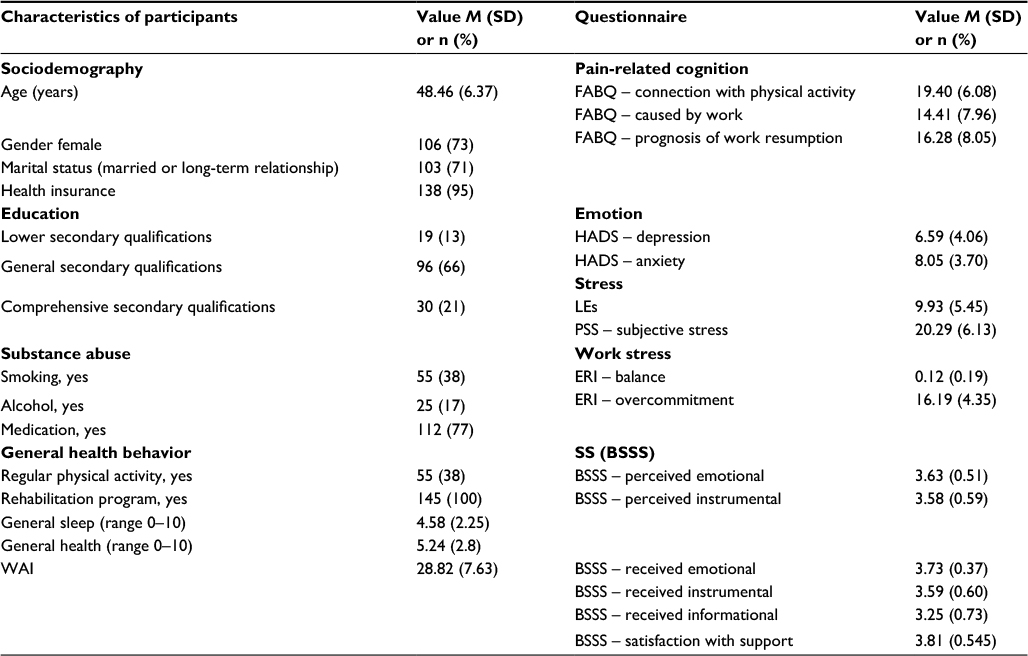 | Table 1 Descriptives of participants at baseline (n = 145) Abbreviations: ERI, Effort–Reward Imbalance questionnaire; FABQ, Fear-Avoidance Beliefs Questionnaire; HADS, Hospital Anxiety and Depression Scale; LE, life event; PSS, Perceived Stress Scale; SS, social support; WAI, Work Ability Index; BSSS, Berlin Social Support Scales. |
Health and social context
Participants reported moderate satisfaction with their general health (4.6 ± 2.3), sleep conditions (5.2 ± 2.8) and SS. In terms of workplace stress, 76% of participants expressed feelings of exerting great effort for minimal reward, which led them to experience unfavorable imbalances at work. Regarding the participants’ stress biographies, an average score of 9.9 ± 5.5 for critical LEs was observed, of which, 16% had occurred during the past year, 41% in the past 5 years, 18% in the past 10 years and 16% over 10 years ago. Nearly all events (91%) were experienced in adulthood (>25 years of age) and classified as moderately stressful (2.2 ± 0.7). Subjective stress, anxiety and depression were compared with German reference data for depressive episodes.46 Between 12% and 19% of participants fell into the clinically relevant range at either t0 or t1 (depression: t0 = 16%, t1 = 12%; anxiety: t0 = 15%, t1 = 19%).
Pain (intensity, disability and handicap)
Rehabilitation led to a significant reduction in pain intensity (CPG PI t1: 57.7 ± 18.2 and t2: 44.4 ± 23.6, t[101] = 5.74, p < 0.05, d = –0.57) and pain disability (CPG DS t1: 60.4 ± 26.0 and t2: 35.0 ± 27.0, t[100] = 8.75, p < 0.05, d = –0.87). Handicap, operationalized as days of disability, was also significantly reduced (t1: 50.1 ± 23.9 and t2: 13.2 ± 24.9, t[78] = 8.97, p < 0.05, d = –1.01). Descriptive values for the two impairment components, CF-D and CF-PE, were 0.1 ± 2.1 and –0.1 ± 3.1, respectively.
Commonly neglected lifestyle and medical care factors
Addressing the study’s first aim, separate regression models revealed a significant influence from the lifestyle and medical care factors, gender, clinic, income, demanding physical work, smoking, and general sleep quality in the prediction of both pain experience and disability (CF-PE and CF-D) 6 months after rehabilitation (Table 2). Initial pain intensity and disability were also significant predictors of pain experience and disability (CF-PE and CF-D) 6 months after rehabilitation.
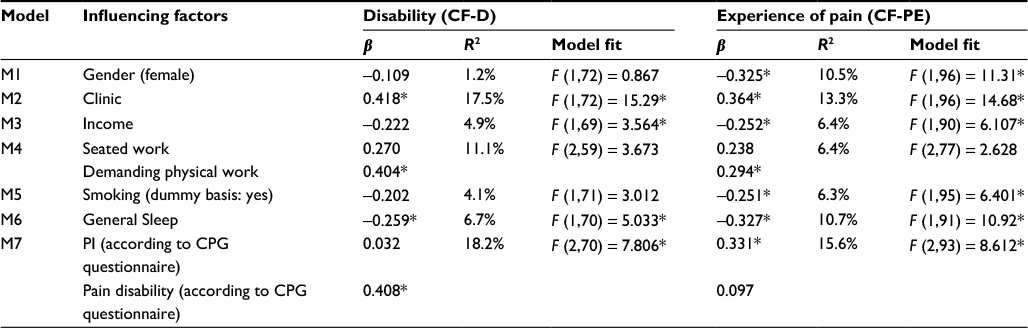 | Table 2 Prediction of CF-PE and CF-D at t1 (beginning of back pain rehabilitation) using lifestyle/demography, medical care situation and profession Notes: Results from simple and multiple regression analyses, controlled for age. *p < 0.05. Standardized regression coefficient (b), explained variance (R2) and the model fit for each tested model. M1–M7 indicate separate models. Influencing factors: gender, clinic, education, profession, income, type of health insurance, availability of medical care structure, duration of medical case history, therapies implemented up to now, seated work, demanding physical work, shift work, physical activity, alcohol intake, smoking, sports participation, general sleep and health, initial pain intensity and disability (operationalized by CPG questionnaire). Abbreviations: PI, pain intensity; CPG, Chronic Pain Grade; CF-PE, chronification factor pain experience; CF-D, chronification factor disability. |
When including all significant lifestyle and medical care factors mentioned earlier into one multiple regression model together, it was determined that gender, initial pain intensity, clinic, demanding physical work and smoking remained significant in their prediction of future experience of pain (CF-PE). Within the prediction of future disability due to pain (CF-D), only initial pain disability, demanding physical work, and clinic persisted in their significance (Table 3).
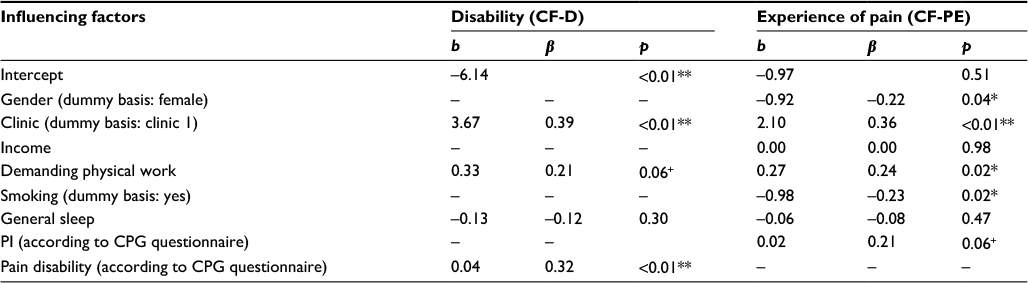 | Table 3 Prediction of CF-D and CF-PE at t1 (beginning of back pain rehabilitation) using lifestyle/demography and profession Notes: Multiple regression models: pain experience (CF-PE): R2 = 0.365, F (7,66) = 6.99; disability (CF-D): R2 = 0.323, F (4,55) = 8.04**; controlled for initial PI and age (CF-PE) respectively initial DS and age (CF-D). +p < 0.10, *p < 0.05, **p < 0.01. Abbreviations: PI, pain intensity; CPG, Chronic Pain Grade; CF-PE, chronification factor pain experience; CF-D, chronification factor disability. |
These remaining significant factors (Table 3) were identified as robust and were used as control variables in the subsequent multiple regression models for the prediction of pain. This comprehensive model included established flag factors (pain related cognitions, anxiety, depression and stress), commonly neglected factors (LEs and job gratification) and protective factors (SS; Table 4).
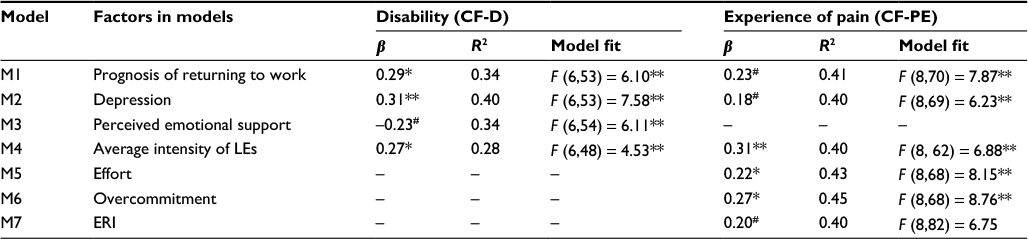 | Table 4 Results from separate multiple regression analyses predicting CF-PE and CF-D from established and often neglected risk factors of CBP Notes: Standardized regression coefficient (b), explained variance (R2) and the model fit for each tested model; M1–M7 indicate separate models. All analyses for CF-PE were controlled for the factors that had a significant influence on CF-PE in the second set of regression analyses for the time period between t1 (beginning of back pain rehabilitation) and t1 (6 months after back pain rehabilitation) (participants’ age, gender, clinic, PI at t1, physical workload and smoking). All analyses for CF-D controlled for the factors that had a significant influence on CF-SE in the second set of regression analyses for the time period between t1 and t2 (participants’ age, clinic, demanding physical work and disability at t1). #p < 0.1, *p < 0.05 and **p < 0.01. Abbreviations: CBP, chronic back pain; LE, life event; ERI, Effort–Reward Imbalance questionnaire; PI, pain intensity; CF-PE, chronification factor pain experience; CF-D, chronification factor disability. |
Influence of established, commonly neglected and protective factors under control of robust lifestyle and medical care factors
Pain-related cognitions
Patients showed a stronger pain experience (CF-PE) and disability (CF-D) 6 months after rehabilitation, when reporting a bad prognosis regarding their own ability to return to work. Neither participants’ perceived assumption that back pain was caused by physical activity nor that it was caused by work had a significant effect (physical activity: CF-PE: β = 0.06, p = 0.56; CF-D: β = –0.04, p = 0.75; work: CF-PE: β = 0.14, p = 0.23; CF-D: β = 0.05, p = 0.74).
Anxiety and depression
More depressive symptoms at baseline resulted in a greater experience of pain (CF-PE) and disability (CF-D) 6 months after rehabilitation, though marginal for pain experience. Anxiety had no influences (CF-PE: β = 0.00, p = 0.99; CF-D: β = 15, p = 0.21).
Social support
Of all the SS dimensions, only perceived emotional support was significant for future disability due to pain. People with stronger perceived emotional support experienced fewer disabilities due to their pain, but their experience of pain was unaffected (CF-PE: β = –0.10, p = 0.29). All other subscales (received emotional support, CF-PE: β = –0.04, p = 0.72; CF-D: β = –0.02, p = 0.98; perceived instrumental support, CF-PE: β = –0.04, p = 0.72; CF-D: β = –0.10, p = 0.38; received instrumental support, CF-PE: β = –0.10, p = 0.30; CF-D: β = –0.18, p = 0.16; received informational support, CF-PE: β = –0.06, p = 0.54; CF-D: β = –0.12, p = 0.34; satisfaction with received SS, CF-PE: β = –0.06, p = 0.52; CF-D: β = −0.08, p = 0.50) had no influence.
Stress
Subjective perception of stress did not have any significant association with either pain disability (β = –0.06, p = 0.60) or pain experience (β = 0.09, p = 0.41).
LEs
The number of experienced LEs revealed no significant influence on back pain disability (β = 0.02, p = 0.88) or pain experience (β = 0.04, p = 0.68). However, analysis of stress caused by life-changing events indicated a significant positive association with disability and pain experience 6 months after rehabilitation.
Effort–reward at work
Finally, neither effort (β = 0.06, p = 0.62), reward (β = –0.07, p = 0.59), overcommitment (β = 0.06, p = 0.61) nor an ERI (β = 0.06, p = 0.60) at work was associated with pain disability. Pain experience, one the other hand, was associated with effort, overcommitment and an ERI at work. People reporting higher degrees of effort at their jobs, who were highly committed to their jobs and who sensed a stronger imbalance between effort and reward, experienced on average stronger pain.
Discussion
Our preliminary results provide an interesting insight into the perspectives of CBP patients and health care providers that indeed extends previous knowledge. It is now obvious that LE, a factor described as a possible orange flag factor with weak influence, plays an important role in the genesis of back pain chronicity.9,47 Also impressive is how health care providers and patients alike reported similar causes of chronicity and emphasize the influence of iatrogenic factors that are rarely discussed in the scientific community. Furthermore, the patients emphasized the balance between effort and reward at the workplace, and to a lesser extent, distress at the workplace, as it is described in other flag catalogs.9,47 Health care providers additionally underlined the importance of a good social environment and support.
Interestingly, the causes reported in our preliminary study interviews were clearly substantiated in our quantitative treatment study, where approximately three-quarters of participants reported high levels of effort with minimal reward, thus an unfavorable imbalance at their workplace. Approximately half of them experienced around 10 critical LEs, with 60% of these reported to have occurred in the last 5 years. Neither effort-reward imbalances nor critical life events are cited as important risk factors within the flag catalog.9,47 The high frequency of critical LEs preceding the onset of back pain in our main study confirms theoretical links between a high allostatic load and pain syndromes and an accumulation related to biography.24 This suggests that health care providers should ask their acute pain syndrome patients about these relevant parameters. Furthermore, results from the treatment study reinforce the iatrogenic factors identified in the preliminary study: our participants had high doctor visit rates and long histories of pain and pain medication before rehabilitation. However, predictive quantitative analysis of future pain illustrated that lifestyle factors, for example, demanding physical work, gender and smoking outweighed medical care factors, such as case history, therapy form, iatrogenic factors and type of insurance. Although the frequent use of prescribed pain medications in combination can become undetected medication abuse, a topic that should receive more attention, it is important to note that sociodemographic and lifestyle factors have a huge influence on the medical history of patients.14 Research is beginning to uncover that declared orange flag factors (e.g., substance abuse, gender) are of greater importance than suggested in the current flag catalog and should be respected by health care providers.9,48 Interestingly though, physical activity and alcohol abuse held weaker influence than previously hypothesized.
Finally established flag factors (e.g., pain-related cognitions, anxiety, depression and stress), commonly neglected factors (e.g., LEs and job gratification) and protective factors (e.g., SS) were assessed while controlling for extracted lifestyle factors.
With regard to pain-related cognitions, patients’ own prognoses of returning to work was an important predictor of future pain experience and disability. An expected limitation due to pain affects the actual perceived amount of pain. This nevertheless does not account for the believed cause of pain: physical activity or work. Fear-avoidance beliefs are a recognized construct in the development of chronic pain; therefore, these results are in line with other flag catalogs.9,48,49
With regard to symptoms of anxiety and depression, depression expectedly was an important factor in future disability and pain intensity. This well-known association between pain and depression is credited to neuronal pathways of the processing and modulation of pain in different brain areas.50 Anxiety, an orange factor more related to movement and physical awareness, was not found to be relevant in our study. Both depression and anxiety results were in line with other flag catalogs.9,48,51
Perceived stress had no significant effect on pain after general assessment (e.g., asking about upsetting, difficult and uncontrollable situations in the last month). Yet by evaluating specific stress forms, such as critical LEs, influences on future pain experience and disability could be depicted. LEs were in fact the single best predictor of pain experience in this study, although associations between age at the time of the event (childhood vs adolescence vs adulthood) were not observed. These results agree with life course research emphasizing the significance of cumulative LE burden for health outcomes if they are detrimental (e.g., high impact or non-normative, refer Filipp and Aymanns52). Regarding SS, only perceived emotional support was predictive of future disability caused by pain. People claiming stronger emotional support reported less disability 6 months after rehabilitation. Received emotional support and perceived/received instrumental support had no influences. The perception of positive feelings seemed to be an important protective factor and more relevant than received support. This association, proven also in SS research, raises the question as to whether protective factors, such as SS, should be integrated into flag catalogs as important resources. Finally, people exerting more effort at their work, who were more committed and reported an imbalance between effort and reward, also reported stronger pain experiences, but not disability. Obviously, overcommitment and greater effort at work led to a stronger perception of pain. Reward, though, appeared as a protective factor. This provides a significantly more differentiated insight into work-related factors than previous studies. The few studies focusing on the concept of ERI are predominantly related to different musculoskeletal problems in professional but not clinical contexts.53,54
Conclusion
Study strength is the clear operationalization of predictors and outcome as well as the integration of different flag factors in a one analysis procedure resulting in a direct comparison. In summary, established risk (e.g., depression) and protective factors (e.g., age) of CBP were confirmed, while commonly neglected factors (e.g., LE, SS) were proven influential. The impact of LEs in the development of chronic pain should be further investigated and added to risk flag catalogs. Protective factors, such as perceived support and subjective feelings of a positive future work ability prognosis, could be implemented in therapeutic settings with the integration of family members or friends in the medical care process. This could complement existing multimodal treatment components, which already aim to treat depression and fear-avoidance behavior. Implications concerning iatrogenic factors, e.g., of pain medication abuse, still remain unclear. In this study, this problem was not shown to be statistically relevant, although it is often reported by affected persons.
Limitations
Using a CFA, we focused on the most robust outcome variables and avoided measuring with single dimensions (CPG, WAI, etc.), which is customary in many studies due to different operationalizations of pain experience, pain perception and PI. The calculation procedure based on actuarial methods can be criticized. However, we view this as a study strength due to regression models with multiple covariables (and a stepwise approach up to the final model) suffering from prediction precision upon variable quantities. Further analysis through regression trees or shrinkage methods would be most appropriate to filter the strongest predictors of future CBP development. Furthermore, this study evokes a discussion in the matter of how flag factors are handled and differentiated into colors/categories. Owing to the amount of declared yellow and blue flags, which have influence on predicting future pain, we were forced to limit our test battery. Therefore, further important parameters such as coping, catastrophizing and mood are unfortunately missing in this study. The transfer to practical application is not addressed here, but warrants further future discussion.
Acknowledgments
Thanks goes to Kathrin Klipker, Jacqueline Güttler, Martin Horack, Ulrich Eggens, Nora Woithe and all other involved researchers for their invaluable support throughout the study. We thank both the technical and medical staff at study sites for their assistance throughout the study. We further thank Heather Williams and Michael Rector for linguistic innovations and suggestions along the way. The present study was funded by the pension fund Berlin-Brandenburg as the major funder (grant-number 10-40.07.05.03.016). The funder did not influence data collection, analysis, interpretation or writing of the manuscript. We acknowledge the support of the Deutsche Forschungsgemeinschaft and Open Access Publishing Fund of University of Potsdam. No financial or personal relationships with other people or organizations have inappropriately influenced the work.
Author contributions
All authors substantially contributed to the conception and realization of the study. P-MW and MF wrote the manuscript’s first draft before all authors critically revised the manuscript for important intellectual content. P-MW was responsible for the study design and analysis plan and conceived the study as the principal investigator. P-MW, MF and MK provided all scientific and practical information for the study conduction. MF performed statistical analysis. All authors read and approved the final manuscript.
Disclosure
The authors report no conflicts of interest in this work.
References
Henschke N, Kamper SJ, Maher CG. The epidemiology and economic consequences of pain. Mayo Clinic Proceedings. Amsterdam: Elsevier; 2015:139–147. | ||
Manchikanti L, Singh V, Datta S, Cohen SP, Hirsch JA; American Society of Interventional Pain Physicians. Comprehensive review of epidemiology, scope, and impact of spinal pain. Pain Physician. 2009;12(4):E35–E70. | ||
Taylor JB, Goode AP, George SZ, Cook CE. Incidence and risk factors for first-time incident low back pain: a systematic review and meta-analysis. Spine J. 2014;14(10):2299–2319. | ||
Hoy D, Brooks P, Blyth F, Buchbinder R. The epidemiology of low back pain. Best Pract Res Clin Rheumatol. 2010;24(6):769–781. | ||
Reid KJ, Harker J, Bala MM, et al. Epidemiology of chronic non-cancer pain in Europe: narrative review of prevalence, pain treatments and pain impact. Curr Med Res Opin. 2011;27(2):449–462. | ||
Gatchel RJ, Peng YB, Peters ML, Fuchs PN, Turk DC. The biopsychosocial approach to chronic pain: scientific advances and future directions. Psychol Bull. 2007;133(4):581–624. | ||
Nicholas MK, Linton SJ, Watson PJ, Main CJ. Early identification and management of psychological risk factors (“yellow flags”) in patients with low back pain: a reappraisal. Phys Ther. 2011;96(5):1–17. | ||
Kendall NAS, Burton AK, Main CJ, Watson PJ. Musculoskeletal Problems, A Guide For The Clinic and Workplace: Identifying Obstacles Using the Psychosocial Flags Framework. London: The Stationery Office; 2009. | ||
Main CJ, Kendall NA, Hasenbring M. Screening of psychosocial risk factors (yellow flags) for chronic back pain and disability. In: Hasenbring M, Rusu AC, Turk DC, editors. From Acute to Chronic Back Pain: Risk Factors, Mechanisms and Clinical Implications. Oxford: University Press; 2012:203–229. | ||
Ladeira CE. Evidence based practice guidelines for management of low back pain: physical therapy implications. Rev Bras Fisioter. 2011;15:190–199. | ||
Balague F, Mannion AF, Pellise F, Cedraschi C. Non-specific low back pain. Lancet. 2012;379(9814):482–491. | ||
Märker-Hermann E, Kiltz U, Braun J. Therapie des chronischen Kreuzschmerzes. Aktuelle Standards. [Therapy of chronic low back pain. Current standards.] Internist. 2014;55(12):1410–1418. German. | ||
Sullivan MJL, Rodgers WM, Kirsch I. Catastrophizing, depression and expectancies for pain and emotional distress. Pain. 2001;91(1–2):147–154. | ||
Ramond-Roquin A, Bouton C, Bègue C, Petit A, Roquelaure Y, Huez JF. Psychosocial risk factors, interventions, and comorbidity in patients with non-specific low back pain in primary care: need for comprehensive and patient-centered care. Front Med (Lausanne). 2015;2:73. | ||
Rudwaleit M, Märker-Hermann E. Management des nichtspezifischen Kreuzschmerzes. [Management of the non-specific low back pain]. Zeitschrift für Rheumatologie. 2012;71(6):485–500. German. | ||
Aghilinejad M, Tavakolifard N, Mortazavi SA, Mokamelkhah EK, Sotudehmanesh A, Mortazavi SA. The effect of physical and psychosocial occupational factors on the chronicity of low back pain in the workers of Iranian metal industry: a cohort study. Med J Islam Repub Iran. 2015;29:242. | ||
Matsudaira K, Konishi H, Miyoshi K, Isomura T, Inuzuka K. Potential risk factors of persistent low back pain developing from mild low back pain in urban Japanese workers. PLoS One. 2014;9(4):e93924. | ||
Sterud T, Tynes T. Work-related psychosocial and mechanical risk factors for low back pain: a 3-year follow-up study of the general working population in Norway. Occup Environ Med. 2013;70(5):296–302. | ||
Werber DI, Schiltenwolf M. Chronische Rückenschmerzen. [Chronic back pain]. Nervenarzt. 2012;83(2):243–258. German. | ||
von Heymann W. Differenzialdiagnostik und Therapie des akuten Kreuzschmerzes. [Differential diagnosis and therapy of acute low back pain]. Manuelle Medizin. 2013;51(1):77–88. German. | ||
Siegrist J, Wahrendorf M. Work Stress and Health in a Globalized Economy: The Model of Effort-Reward Imbalance. New York: Springer; 2016. | ||
Siegrist J. Effort-Reward Imbalance at Work: Theory, Measurement and Evidence. Düsseldorf: University of Düsseldorf; 2012. | ||
Gallo LC, Fortmann AL, Mattei J. Allostatic load and the assessment of cumulative biological risk in biobehavioral medicine: challenges and opportunities. Psychosom Med. 2014;76(7):478–480. | ||
McEwen B, Nasveld P, Palmer M, Anderson R. Allostatic Load: A review of the literature. Canberra: Department of Veterans’ Affairs; 2012. | ||
Lupien SJ, Ouellet-Morin I, Herba CM, Juster R, McEwen BS. From vulnerability to neurotoxicity: a developmental approach to the effects of stress on the brain and behavior. In: Spengler D, Binder E, editors. Epigenetics and Neuroendocrinology. Berlin: Springer; 2016:3–48. | ||
Melzack R. Pain and stress: a new perspective. In: Gatchel RJ, Turk DC, editors. Psychosocial Factors in Pain: Critical Perspectives. New York: The Guilford Press; 1999:89–106. | ||
Mayring P. Kombination und Integration qualitativer und quantitativer Analyse [31 Absätze]. [Combination and integration of qualitative and quantitative Analysis [31 paragraphs]]. Forum Qual Soc Res. 2001;2(1):Art.6. German. | ||
DRV. Basisvertrag der Deutschen Rentenversicherung Bund zur Ausführung von Leistungen zur medizinischen Rehabilitation. [Basic contract of the German Rentenversicherungsbund for the execution of medical rehabilitation services] Berlin: DRV; 2010. German. | ||
Gläser J, Laudel G. Experteninterviews und qualitative Inhaltsanalyse. Berlin: Springer; 2010. | ||
Wippert P-M, Fließer M, Klipker K, Güttler J, Klaus K, Krause M. Kritische Verlaufspunkte und die Akkumulation von Risiken in der Entwicklung und im Langzeitverlauf orthopädischer Erkrankungen. [Critical pathways and the accumulation of risks in the development and long-term orthopedic diseases]. Potsdam: University of Potsdam; 2014. German. | ||
Cohen S, Kamarck T, Mermelstein R. A global measure of perceived stress. J Health Soc Behav. 1983;24(4):385–396. | ||
Siegrist J, Geyer S. Inventar lebensverändernder Ereignisse. [Inventory of life-changing events]. Mannheim: ZUMA; 1990. German. | ||
Rödel A, Siegrist J, Hessel A, Brähler E. Fragebogen zur Messung beruflicher Gratifikationskrisen. [Questionnaire for measurement of professional gratification crises]. Zeitschrift für Differentielle und Diagnostische Psychologie. 2004;25(4):227–238. German. | ||
Pikhart H, Bobak M, Pajak A, et al. Psychosocial factors at work and depression in three countries of Central and Eastern Europe. Soc Sci Med. 2004;58(8):1475–1482. | ||
Herrmann C, Buss U, Snaith RP. Hospital Anxiety and Depression Scale – Deutsche Version (HADS-D). Bern: Hans Huber; 1995. | ||
Pfingsten M, Leibing E, Franz C, Bansemer D, Busch O, Hildebrandt J. Erfassung der „fear-avoidance-beliefs” bei Patienten mit Rückenschmerzen. [Fear-avoidance-beliefs in patients with backpain]. Schmerz. 1997;11(6):387–395. German. | ||
Lampert T, Kroll LE, Muters S, Stolzenberg H. Messung des sozioökonomischen Status in der Studie „Gesundheit in Deutschland aktuell“ (GEDA). [Measurement of the socioeconomic status within the German Health Update 2009 (GEDA)]. Bundesgesundheitsblatt Gesundheitsforschung Gesundheitsschutz. 2013;56(1):131–143. German. | ||
DESTATIS. Gesundheitsrelevantes Verhalten: Rauchgewohnheiten nach Altersgruppen (Ergebnisse des Mikrozensus 2009). [Health - related behavior: smoking habits after age groups (results of the microrozensus 2009)]. Wiesbaden: DESTATIS; 2009. German. | ||
Von Korff M, Ormel J, Keefe FJ, Dworkin SF. Grading the severity of chronic pain. Pain. 1992;50(2):133–149. | ||
Nagel B, Gerbershagen HU, Lindena G, Pfingsten M. Entwicklung und empirische Überprüfung des Deutschen Schmerzfragebogens der DGSS. [Development and empirical review of the German pain questionnaire DGSS]. Schmerz. 2002;16(4):263–270. German. | ||
Franke GH. SCL-90-R. Die Symptom-Checkliste von Derogatis – Deutsche Version. [SCL-90-R. The symptom checklist of Derogatis - German version]. Weinheim: Beltz; 1995. German. | ||
Bullinger M, Kirchberger I. SF-36 Fragebogen zum Gesundheitszustand. [SF-36 Questionnaire on health status]. Göttingen: Hogrefe; 1998. German. | ||
Hasselhorn HM, Freude G. Der Work Ability Index – ein Leitfaden. [The Workability Index - a guide]. Dortmund: Wirtschaftsverlag NW; 2007. German. | ||
Mayring P, Fenzl T. Qualitative inhaltsanalyse. [Qualitative content analysis]. In: Baur N, Blasius J, editors. Handbuch Methoden der empirischen Sozialforschung. [Manual Methods of Empirical Social Research]. Wiesbaden: Springer; 2014:543–556. German. | ||
Cohen J, Cohen P, West SG, Aiken LS. Applied Multiple Regression/Correlation Analysis for the Behavioral Sciences. London: L. Erlbaum Associates; 2003. | ||
RKI. Depressive Erkrankungen. [Depressive diseases]. RKI: Berlin: 2010. German. | ||
Waddell G, Burton AK, Bartys S, Main CJ. Screening of DWP Clients for Risk of Long-term Incapacity: A Conceptual and Scientific Review. London: Royal Society of Medicine Press; 2003. | ||
Main CJ, Nicholas ASK, Hasenbring MI. Screening of psychosocial risk factors (Yellow Flags) for chronic back pain and disability. In: Hasenbring MI, Rusu AC, Turk DC, editors. From Acute to Chronic Back Pain. Risk Factors, Mechanisms, and Clinical Implications. Oxford: University Press; 2012: 203–229. | ||
Crombez G, Eccleston C, Van Damme S, Vlaeyen JW, Karoly P. Fear-avoidance model of chronic pain: the next generation. Clin J Pain. 2012;28(6):475–483. | ||
Grieve SM, Korgaonkar MS, Koslow SH, Gordon E, Williams LM. Widespread reductions in gray matter volume in depression. Neuroimage Clin. 2013;3:332–339. | ||
Eckhardt A. Kreuzschmerzen – Epidemiologie, Klassifizierung und ein Überblick über die aktuellen Leitlinienempfehlungen. [Cross pain - epidemiology, classification and an overview of the current guidelines]. Orthopädische und Unfallchirurgische Praxis. 2012;1(12):480–483. German. | ||
Filipp SH, Aymanns P. Kritische Lebensereignisse und Lebenskrisen. [Critical life events and life crises]. Eldorado: Technische Universität Dortmund; 2011. German. | ||
Lee SJ, Lee JH, Gillen M, Krause N. Job stress and work-related musculoskeletal symptoms among intensive care unit nurses: a comparison between job demand-control and effort-reward imbalance models. Am J Ind Med. 2014;57(2):214–221. | ||
Koch P, Schablon A, Latza U, Nienhaus A. Musculoskeletal pain and effort-reward imbalance-a systematic review. BMC Public Health. 2014;14(1):1–10. |
 © 2017 The Author(s). This work is published and licensed by Dove Medical Press Limited. The full terms of this license are available at https://www.dovepress.com/terms.php and incorporate the Creative Commons Attribution - Non Commercial (unported, v3.0) License.
By accessing the work you hereby accept the Terms. Non-commercial uses of the work are permitted without any further permission from Dove Medical Press Limited, provided the work is properly attributed. For permission for commercial use of this work, please see paragraphs 4.2 and 5 of our Terms.
© 2017 The Author(s). This work is published and licensed by Dove Medical Press Limited. The full terms of this license are available at https://www.dovepress.com/terms.php and incorporate the Creative Commons Attribution - Non Commercial (unported, v3.0) License.
By accessing the work you hereby accept the Terms. Non-commercial uses of the work are permitted without any further permission from Dove Medical Press Limited, provided the work is properly attributed. For permission for commercial use of this work, please see paragraphs 4.2 and 5 of our Terms.