")
Back to Journals » Clinical Epidemiology » Volume 10
Rising trends in pancreatic cancer incidence and mortality in 2000–2014
Authors Wu W, He XK , Yang L , Wang Q, Bian X, Ye J , Li Y, Li L
Received 21 December 2017
Accepted for publication 5 April 2018
Published 9 July 2018 Volume 2018:10 Pages 789—797
DOI https://doi.org/10.2147/CLEP.S160018
Checked for plagiarism Yes
Review by Single anonymous peer review
Peer reviewer comments 3
Editor who approved publication: Professor Vera Ehrenstein
Wenrui Wu,1,2,* Xingkang He,3,4,* Liya Yang,1,2 Qing Wang,1,2 Xiaoyuan Bian,1,2 Jianzhong Ye,1,2 Yating Li,1,2 Lanjuan Li1,2
1State Key Laboratory for Diagnosis and Treatment of Infectious Diseases, The First Affiliated Hospital, School of Medicine, Zhejiang University, Hangzhou, China; 2Collaborative Innovation Center for Diagnosis and Treatment of Infectious Diseases, Hangzhou, China; 3Department of Gastroenterology, Sir Run Run Shaw Hospital, Zhejiang University Medical School, Hangzhou, China; 4Department of Microbiology, Tumor and Cell Biology, Karolinska Institute, Stockholm, Sweden
*These authors contributed equally to this work
Background: The morbidity and mortality of pancreatic cancer vary considerably around the world. The aim of this study was to characterize and evaluate recent changes in incidence and incidence-based mortality in the USA.
Methods: Incidence and incidence-based mortality data were based on the 18 Surveillance, Epidemiology, and End Results (SEER) registries through SEER*Stat software. We adopted joinpoint regression to analyze the temporal trends stratified by age, gender, ethnicity, stage, tumor site, and size.
Results: Based on 18 SEER data sets, the age-adjusted incidence of pancreatic cancer increased from 11.85/100,000 in 2000 to 14.70/100,000 in 2014, increasing by an average annual percentage change (AAPC) of 1.6 (95% CI 1.5–1.8, p<0.05). The incidence-based mortality also increased, from 9.96/100,000 in 2001 to 12.96/100,000 in 2014, increasing by an AAPC of 1.9 (95% CI 1.3–2.5, p<0.05). However, we observed a deceleration in mortality since 2005, with the annual percentage change decreasing from 4.1 (2001–2005) to 1.0 (2005–2014). These increasing trends in pancreatic cancer were observed in most subgroups (stratified by age, gender, ethnicity, stage, tumor site, and size).
Conclusion: The incidence and mortality rates of pancreatic cancer in the USA have increased significantly since 2000, highlighting the need for increased preventive, screening, and surveillance efforts.
Keywords: epidemiology, pancreatic cancer, incidence, mortality, trend, SEER
Introduction
Pancreatic cancer is considered one of the most lethal malignancies, with dismal prognosis. According to Cancer Statistics, 2017,1 an estimated 53,670 new patients will be diagnosed with pancreatic cancer and 43,090 deaths will be caused by this disease per year in the USA. The 5 year survival rate of pancreatic cancer remains as low as 8.2% in the USA.2 The close parallel between the incidence of and mortality from pancreatic cancer reflects the fatal nature of this disease. To date, several risk factors, including smoking, alcohol, obesity, and type 2 diabetes, have been identified for pancreatic cancer.3–5
Because of the low rates of early detection and poor prognosis, pancreatic cancer remains a tremendous public health burden around the world, especially in developed countries. It has been reported that North America and Western Europe have the highest incidence rates.6 Therefore, there is an urgent need for a comprehensive understanding of recent trends regarding pancreatic cancer in the USA. To our knowledge, recent changes in pancreatic cancer remain largely unknown. Most previous studies evaluated the trends in pancreatic cancer from 1970 to 2002 and indicated a declining trend since 1980. These results may not be representative of the trends for pancreatic cancer in the past decade. To bridge this gap, therefore, we conducted this study based on the Surveillance, Epidemiology, and End Results (SEER) data set, which represents epidemiological trends only in the USA. We aimed to investigate and characterize the recent temporal trends in the USA during 2000–2014.
Method
Data source
Incidence data for pancreatic cancer were obtained by SEER*Stat version 8.3.4 from the database of incidence–SEER 18 registries research data.7 Mortality data were obtained from incidence-based mortality–SEER 18 registries research data.8 In incidence-based mortality analysis, we excluded the first year (2000) to ensure that most of the deaths occurred in patients who were diagnosed with pancreatic cancer after 2000. Cases of pancreatic cancer were included in the present study based on the International Classification of Diseases for Oncology, Third Edition (ICD-O-3). Only microscopically confirmed pancreatic cancer and the first matching record were selected. Microscopically confirmed criteria included positive histology, positive cytology, and positive microscopic confirmation, with method unspecified.9 The age of the population was limited to between 20 and ≥85 years. Primary sites coded as head of pancreas (C25.0), body of pancreas (C25.1), tail of pancreas (C25.2), pancreatic duct (C25.3), other specified parts of pancreas (C25.7), overlapping lesion of pancreas (C25.8), and pancreas, not otherwise specified (C25.9) were included. Cases identified only from autopsy records or death certificates were excluded. As the SEER database holds deidentified data and is publicly available, no approval was required by an institutional review board, and approval from the ethics board was not required.
Statistics
The incidence and incidence-based mortality rates were calculated by SEER*Stat version 8.3.4 and age-adjusted rates were calculated by adjustment to the 2000 US standard population. The National Cancer Institute’s Joinpoint regression analysis program, version 4.5.0.1,10,11 was used to calculate the annual percentage change (APC) and average annual percentage change (AAPC) to quantify changes in incidence and mortality, and by demographic and tumor characteristics. The program also selected the best-fitting log-linear regression model to identify calendar years (i.e. the joinpoints) when APCs changed significantly. All statistical analysis was two sided and significance was taken as p<0.05.
Results
In total, 119,412 patients with pancreatic cancer were identified in 18 SEER registries during 2000–2014, and 94,856 cases died between 2001 and 2014. Detailed characteristics are summarized in Table 1. The age-adjusted incidence and incidence-based mortality rates were 13.4 (95% CI 13.3–13.5) and 12.0 (95% CI 11.9–12.1), respectively. Notably, we observed that the mortality rate of cancer was comparable to its incidence, suggesting the highly lethal property of this malignancy. Compared with females, males had higher incidence and mortality rates. For young patients (aged <50 years), both incidence and mortality rates were relatively low. Most pancreatic cancer cases and deaths occurred in elderly patients (>60 years). Black patients had higher morbidity and mortality rates than other ethnic groups. In addition, advanced stage, tumors in the head of the pancreas, and median tumor size (2–4 cm) carried greater morbidity and mortality rates of pancreatic cancer.
 | Table 1 Pancreatic cancer incidence (2000–2014) and incidence-based mortality (2001–2014)a Note: aRate is per 100,000 person-years and age-adjusted to the 2000 US standard population. bOther sites include: C25.9, pancreas, not otherwise specified; C25.8, overlapping lesion of pancreas; C25.7, other specified parts of pancreas; C25.3, pancreatic duct; C25.4, islets of Langerhans. Abbreviation: SEER, Surveillance, Epidemiology, and End Results. |
During the study period, the age-adjusted incidence gradually increased from 11.85/100,000 person-years in 2000 to 14.70/100,000 person-years in 2014, at an AAPC of 1.6 (95% CI 1.5–1.8) (Figure 1 and Table 2). No significant cut-point was identified by joinpoint regression, indicating that the increasing trend in incidence remained steady. For incidence-based mortality, it increased from 9.96/100,000 person-years in 2001 to 12.96/100,000 person-years in 2014, at an AAPC of 1.9 (95% CI 1.3–2.5). A significant cut-point was noted in the mid-2000s (2005) and there were two distinct trends, from 2001 to 2005 and from 2005 to 2014 (Figure 2 and Table 3). The mortality rate initially increased at an APC of 4.1 (95% CI 2.1–6.0) from 2001 to 2005 and then slowed at an APC of 1.0 (95% CI 0.5–1.5) (Figure 2 and Table 3), indicating that the survival rate rose after 2005.
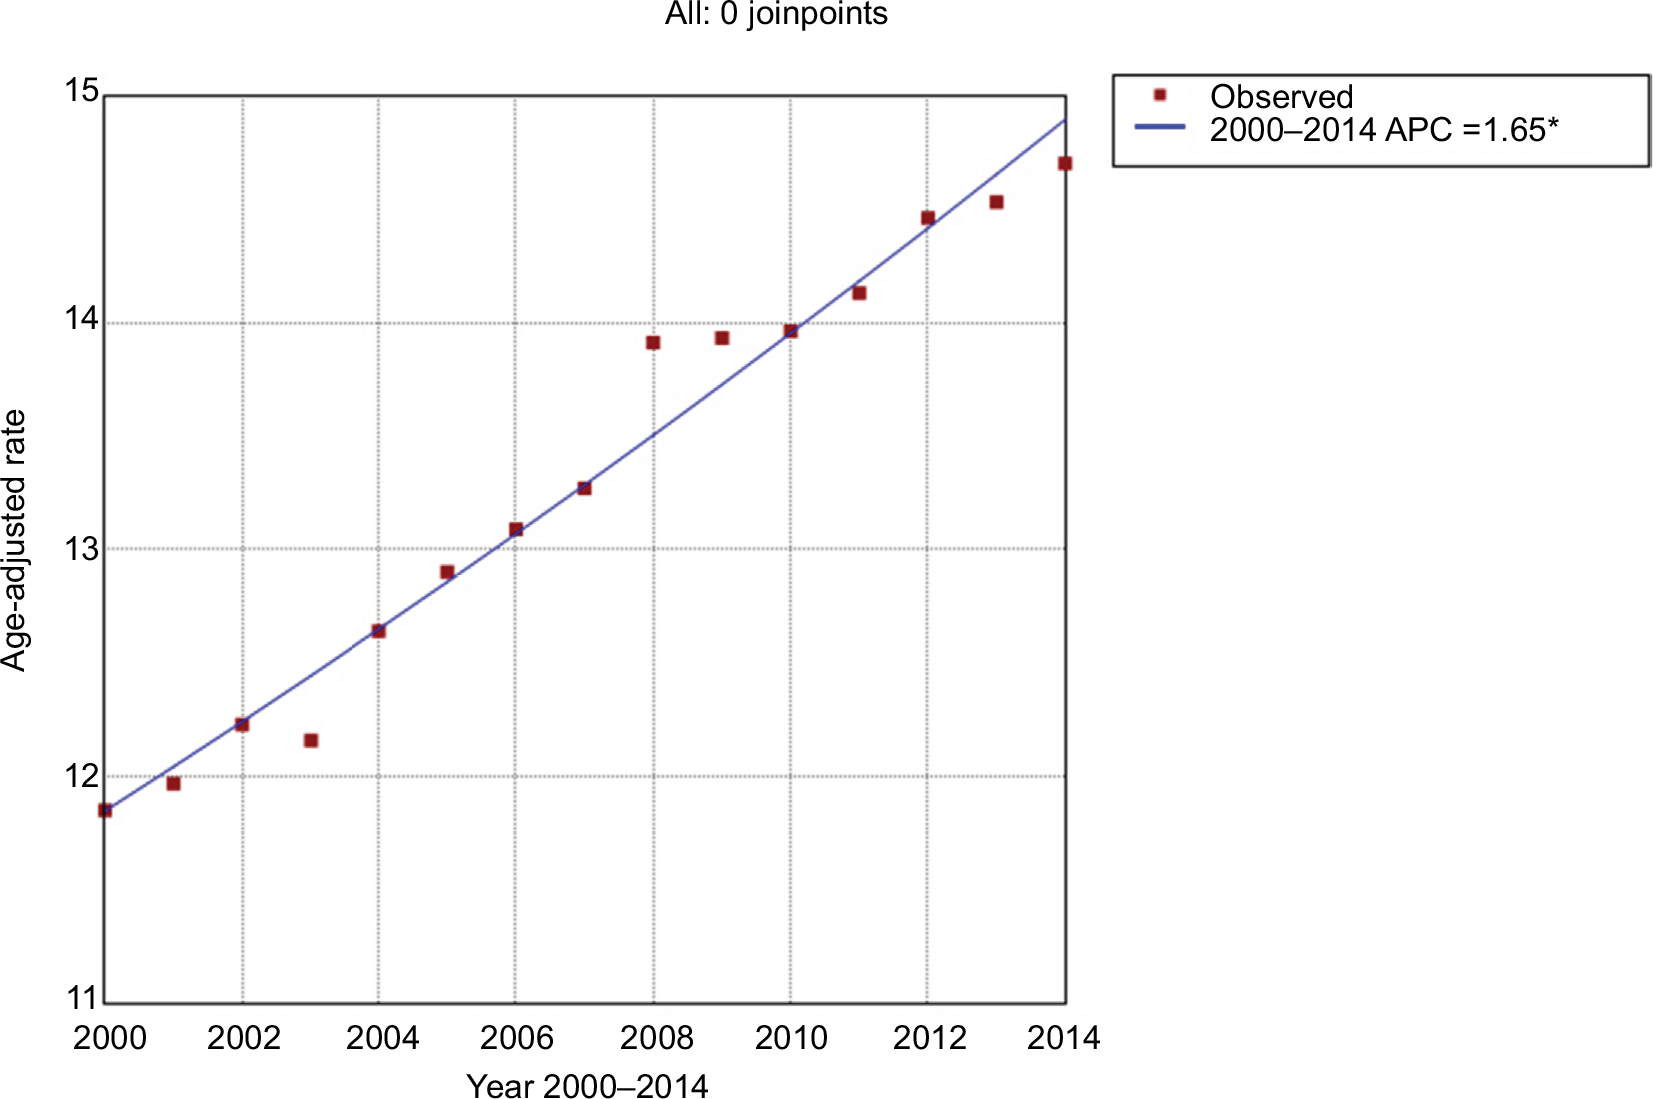 | Figure 1 Trends in pancreatic cancer incidence during 2000–2014. Rates were age-adjusted to the 2000 US standard population. Note: *The annual percentage change (APC) is significantly different from zero at the alpha=0.05 level. Final selected model: 0 joinpoints. |
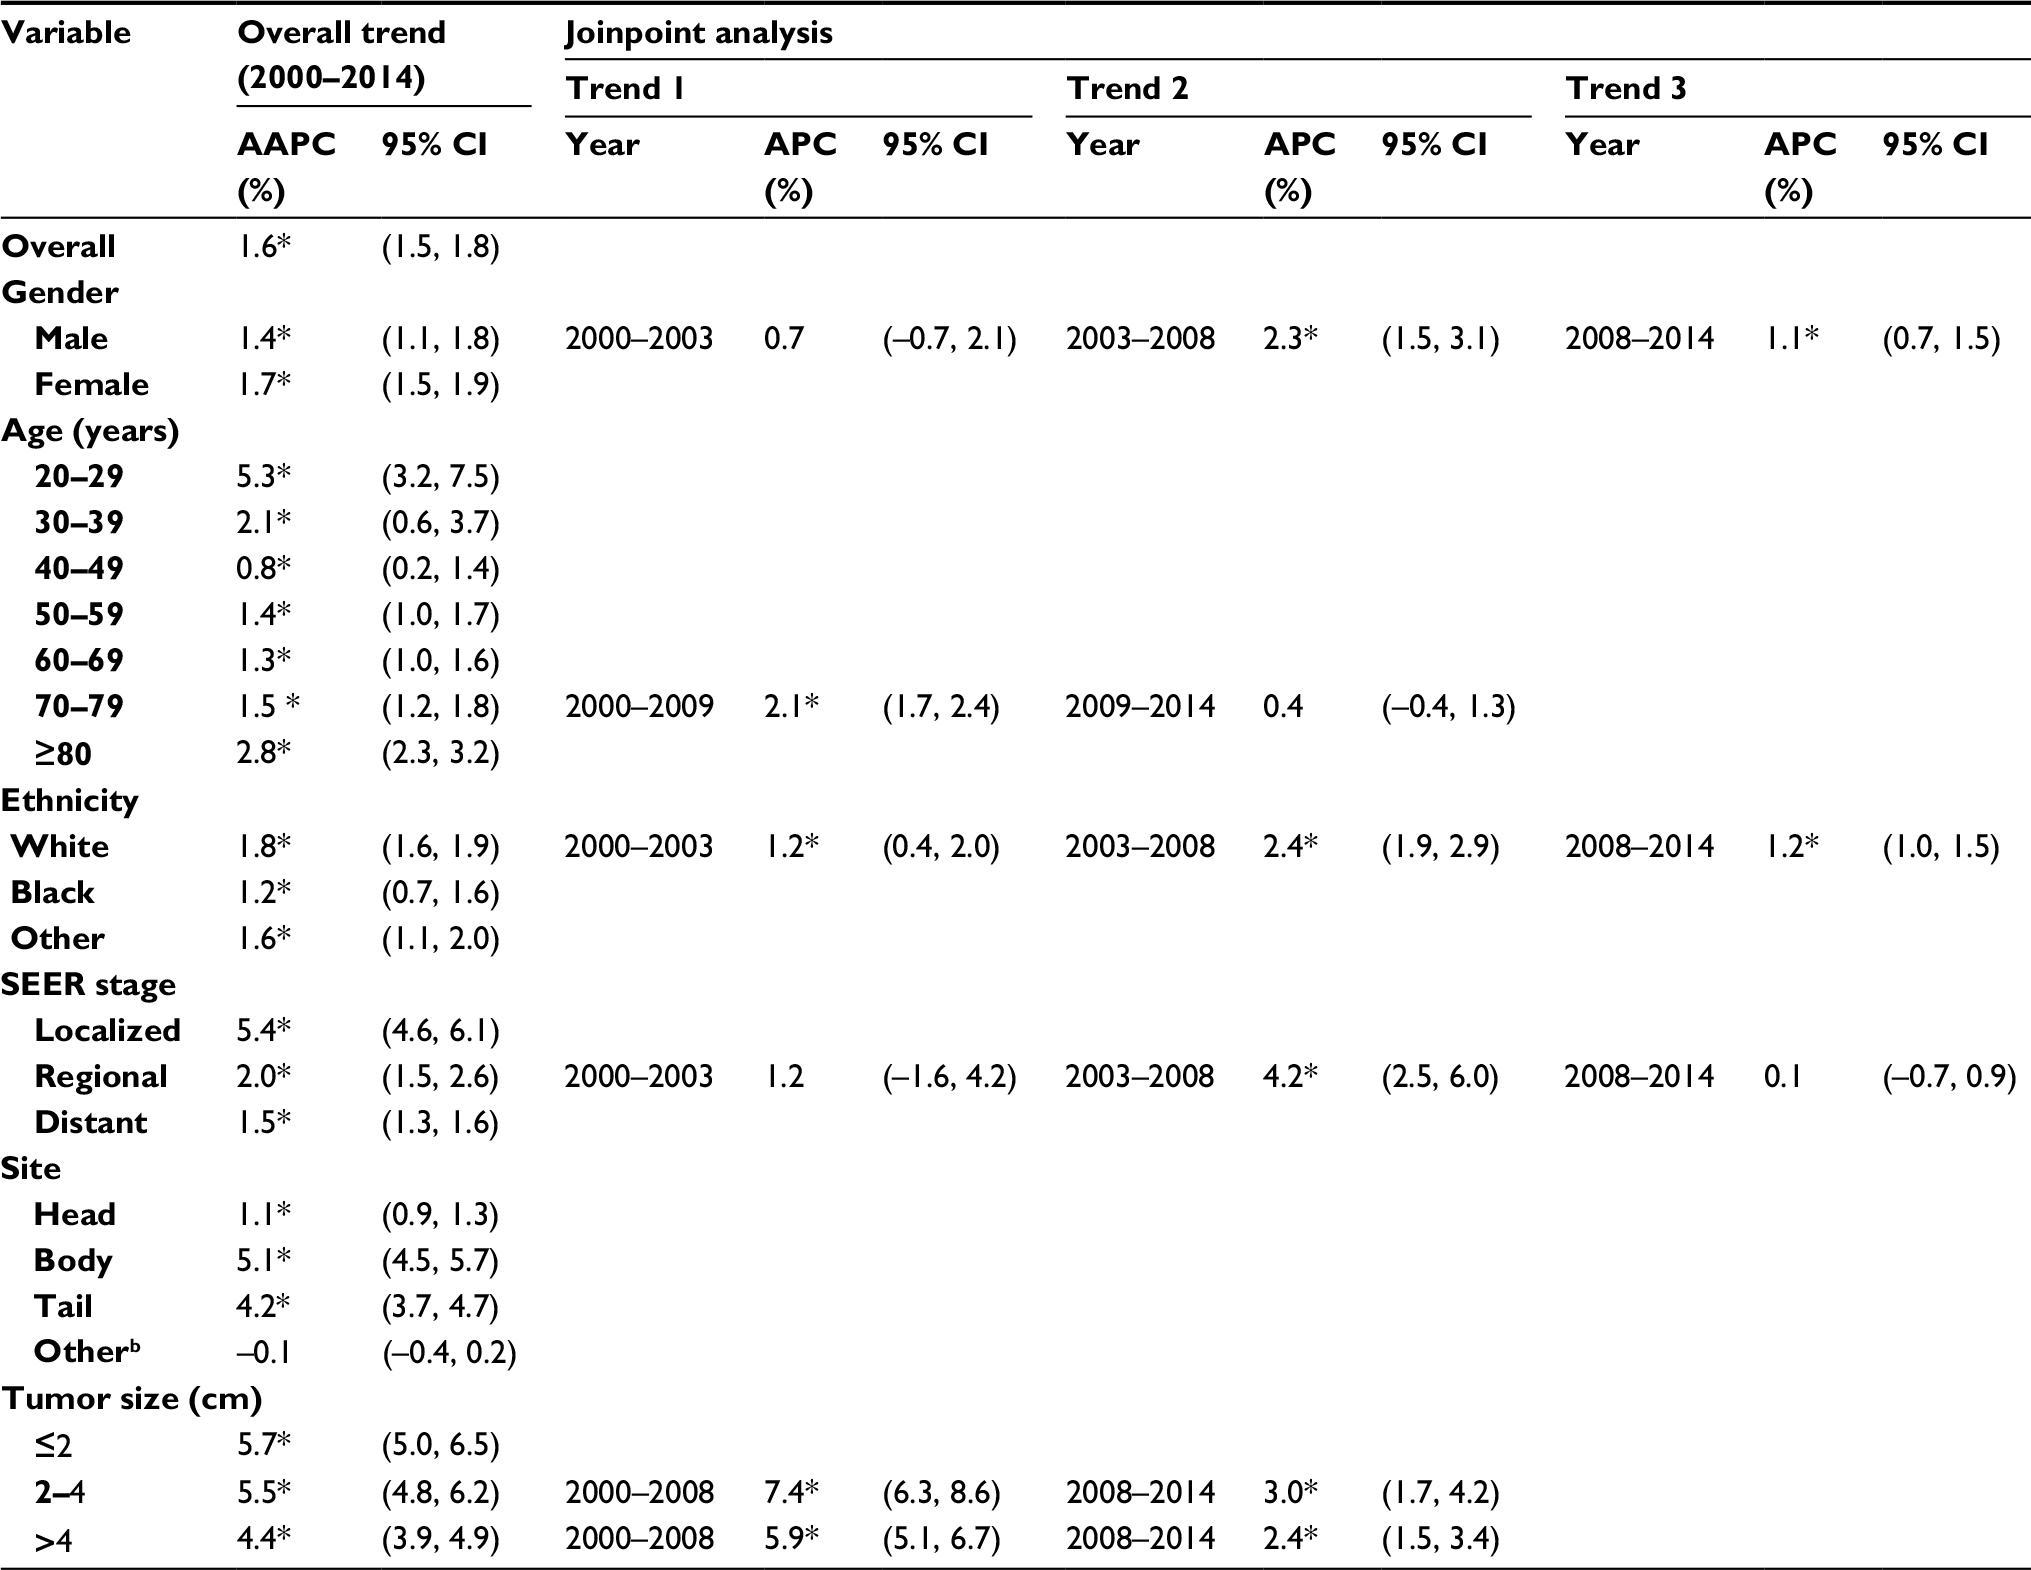 | Table 2 Trends in incidence for pancreatic cancer, 2000–2014a Note: aRates are per 100,000 person-years and age-adjusted to the 2000 US standard population. bOther sites include: C25.9, pancreas, not otherwise specified; C25.8, overlapping lesion of pancreas; C25.7, other specified parts of pancreas; C25.3, pancreatic duct; C25.4, islets of Langerhans. *The APC or AAPC is significantly different from zero (p<0.05). Abbreviations: SEER, Surveillance, Epidemiology, and End Results; AAPC, average annual percentage change; APC, annual percentage change. |
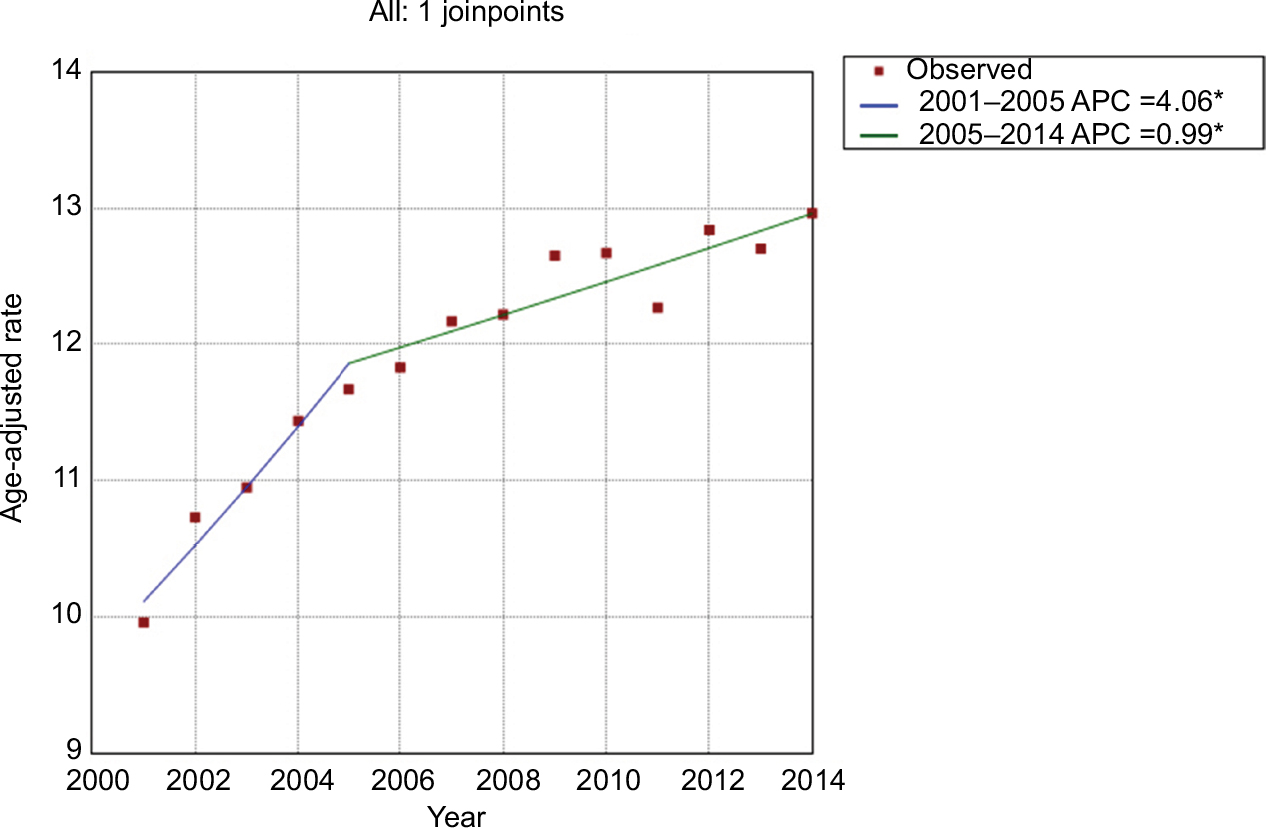 | Figure 2 Trends in pancreatic cancer mortality during 2000–2014. Rates were age-adjusted to the 2000 US standard population. Note: *The annual percentage change (APC) is significantly different from zero at the alpha=0.05 level. Final selected model: 1 joinpoint. |
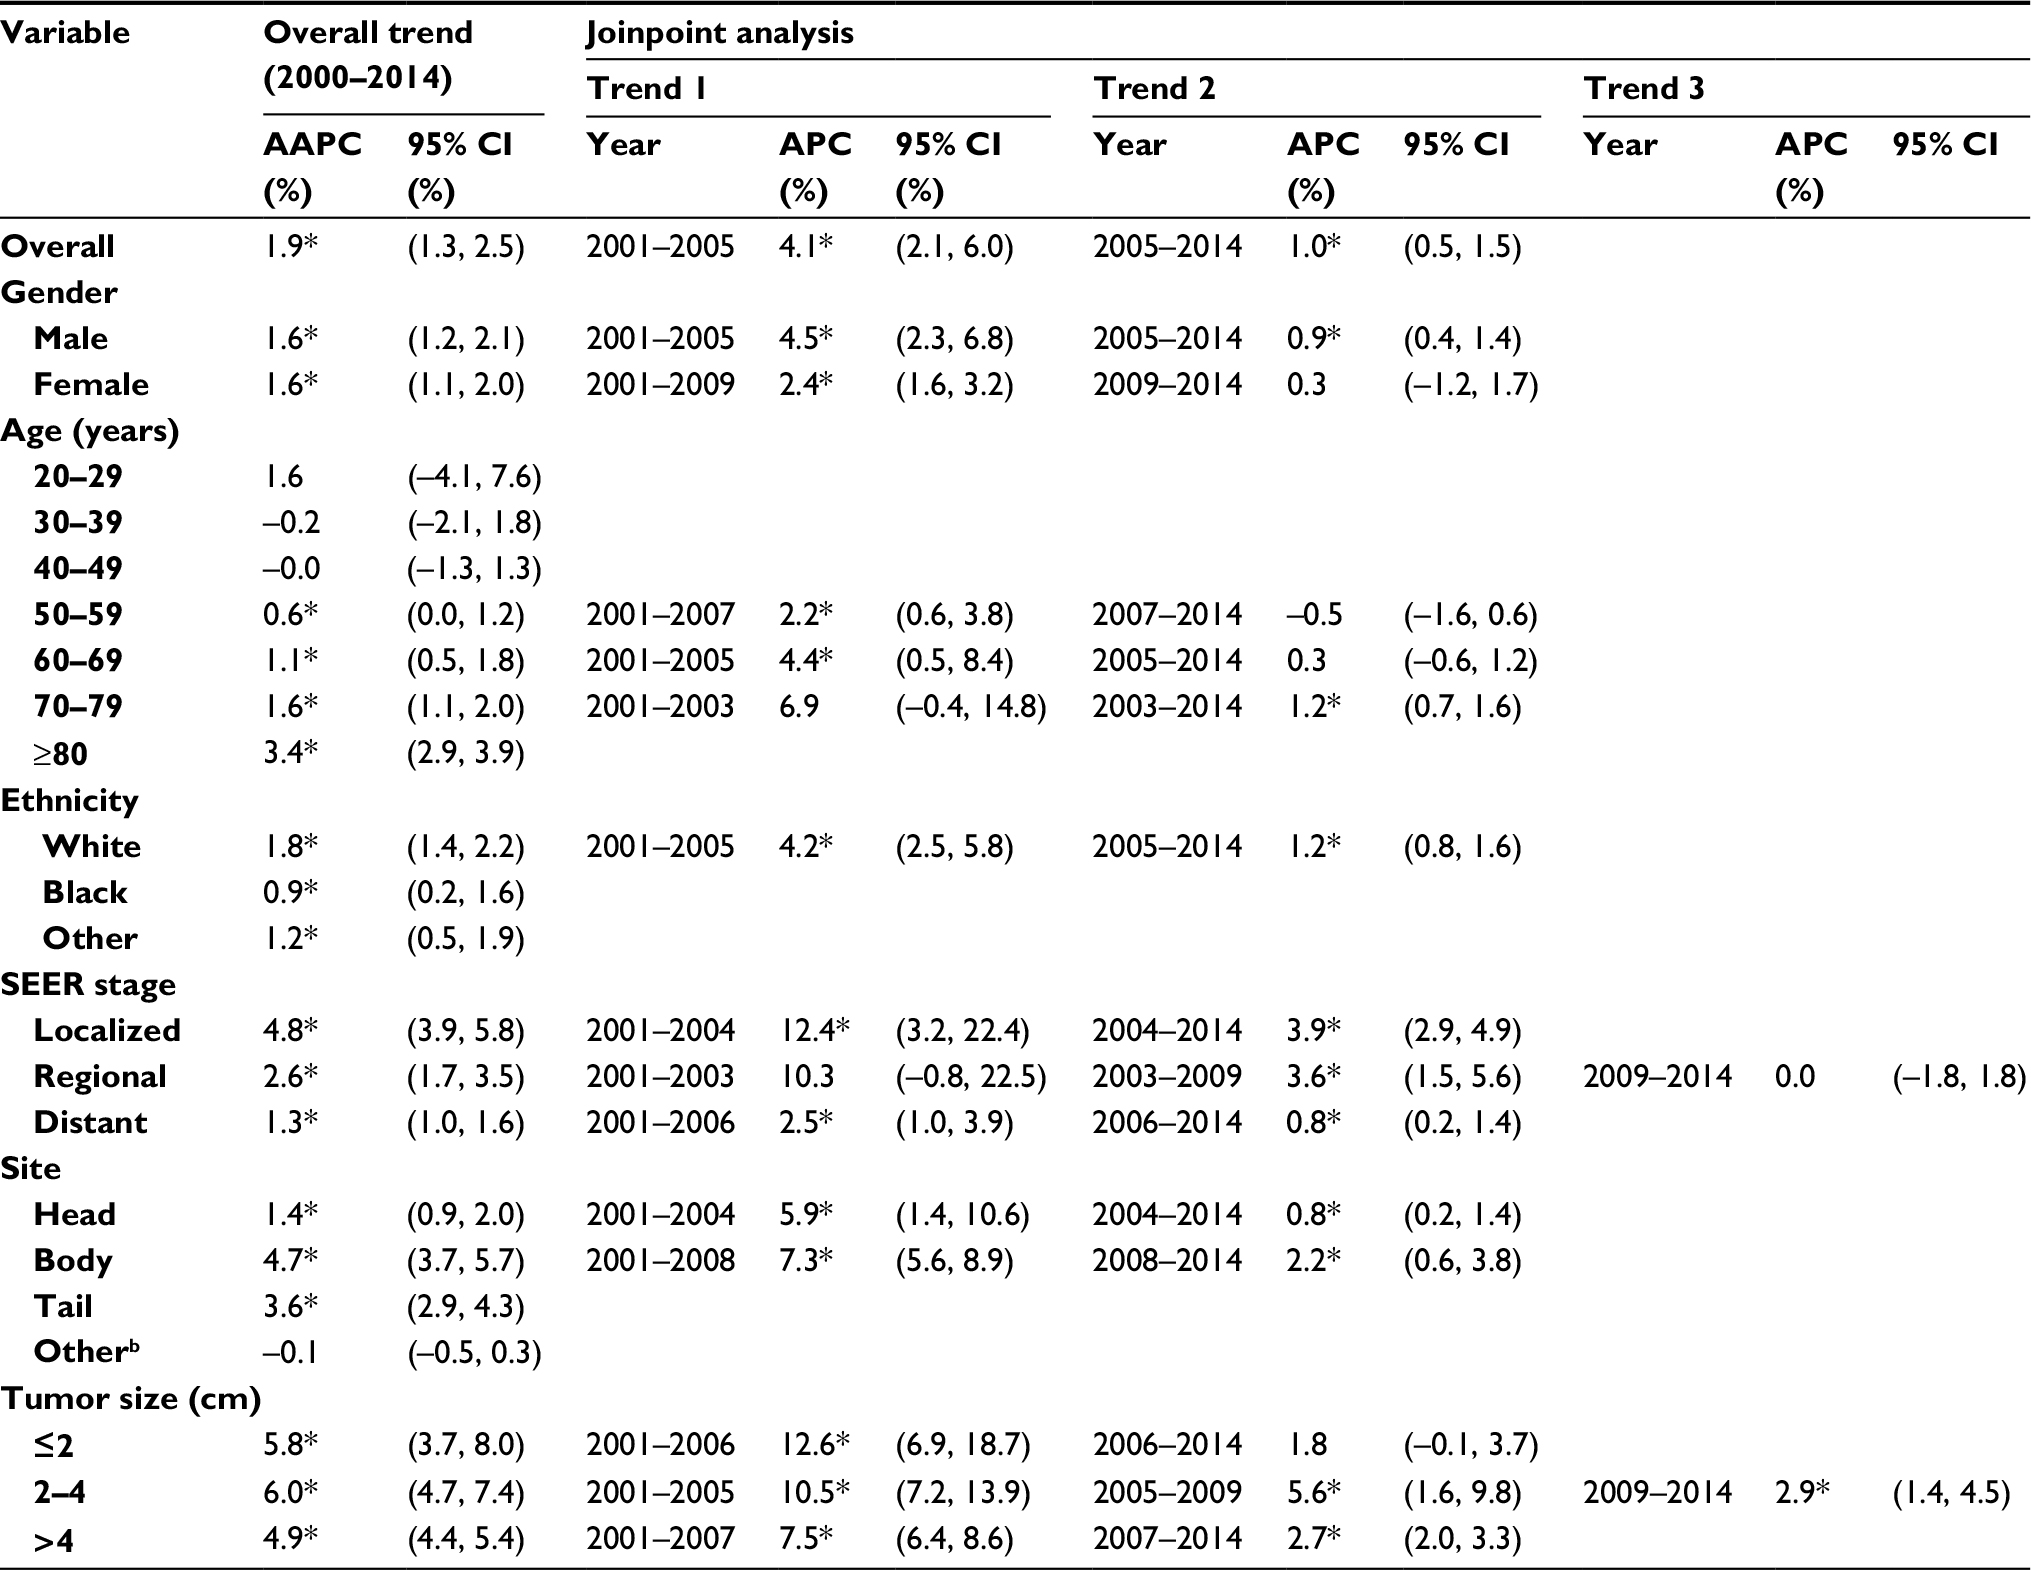 | Table 3 Trends in mortality for pancreatic cancer, 2001-2014a Note: aRates are per 100,000 person-years and age-adjusted to the 2000 US standard population. bOther sites include: C25.9, pancreas, not otherwise specified; C25.8, overlapping lesion of pancreas; C25.7, other specified parts of pancreas; C25.3, pancreatic duct; C25.4, islets of Langerhans. *The APC or AAPC is significantly different from zero (p<0.05). Abbreviations: SEER, Surveillance, Epidemiology, and End Results; AAPC, average annual percentage change; APC, annual percentage change. |
Changes in incidence and mortality stratified by demographic and tumor characteristics are presented in detail in Tables 2 and 3. When age-specific trends were analyzed, trends towards an increase were observed in all age subgroups, and increases were especially pronounced for the population aged 20–29 years and ≥80 years. The incidence rate among patients aged 70–79 years leveled off during 2009–2014 (Figure 3). With regard to mortality, in general, the more recent mortality rates increased more slowly or remained steady (Figure 4). When gender-specific trends were explored, incidence and mortality rates increased regardless of gender. The AAPC in incidence rate was higher in females (1.7%) than in males (1.4%) between 2000 and 2014. It increased at a lower rate in males during 2008–2014 (APC=1.1, 95% CI 0.7–1.5) and remained unchanged in females during the same period (APC=1.7, 95% CI 1.5–1.9) (Table 2 and Figure S1). In terms of mortality, the AAPC in mortality rate was similar in females and males (Table 3 and Figure S2). When ethnicity-specific trends were analyzed, the incidence rate was higher in white than in non-white patients. Among white people, it initially increased at an APC of 1.2% and accelerated at an APC of 2.4% between 2003 and 2008. Thereafter, it slowed to an annual increase of 1.2% in 2008–2014 (Table 2 and Figure S3). With regard to mortality trends, the largest increases occurred between 2001 and 2005 in white patients (Table 3 and Figure S4). When stage-specific trends were analyzed, the incidence trend was particularly noteworthy for localized tumors compared with pancreatic cancer in regional and distant stages (Table 2, Figure S5). Mortality stabilized or increased slightly in recent years, indicating improved survival rates (Figure S6). When site-specific trends were analyzed, there were overall increasing trends in the incidence and mortality of cancers of the head, body, and tail of the pancreas, but not in other parts of the pancreas (Figures S7 and S8). When size-specific trends were analyzed, the annual rates of increase in incidence and mortality decreased for large tumors (>2 cm). For small tumors (≤2 cm), mortality remained steady since 2006, although the incidence increased by 5.7% on average (Figures S9 and S10).
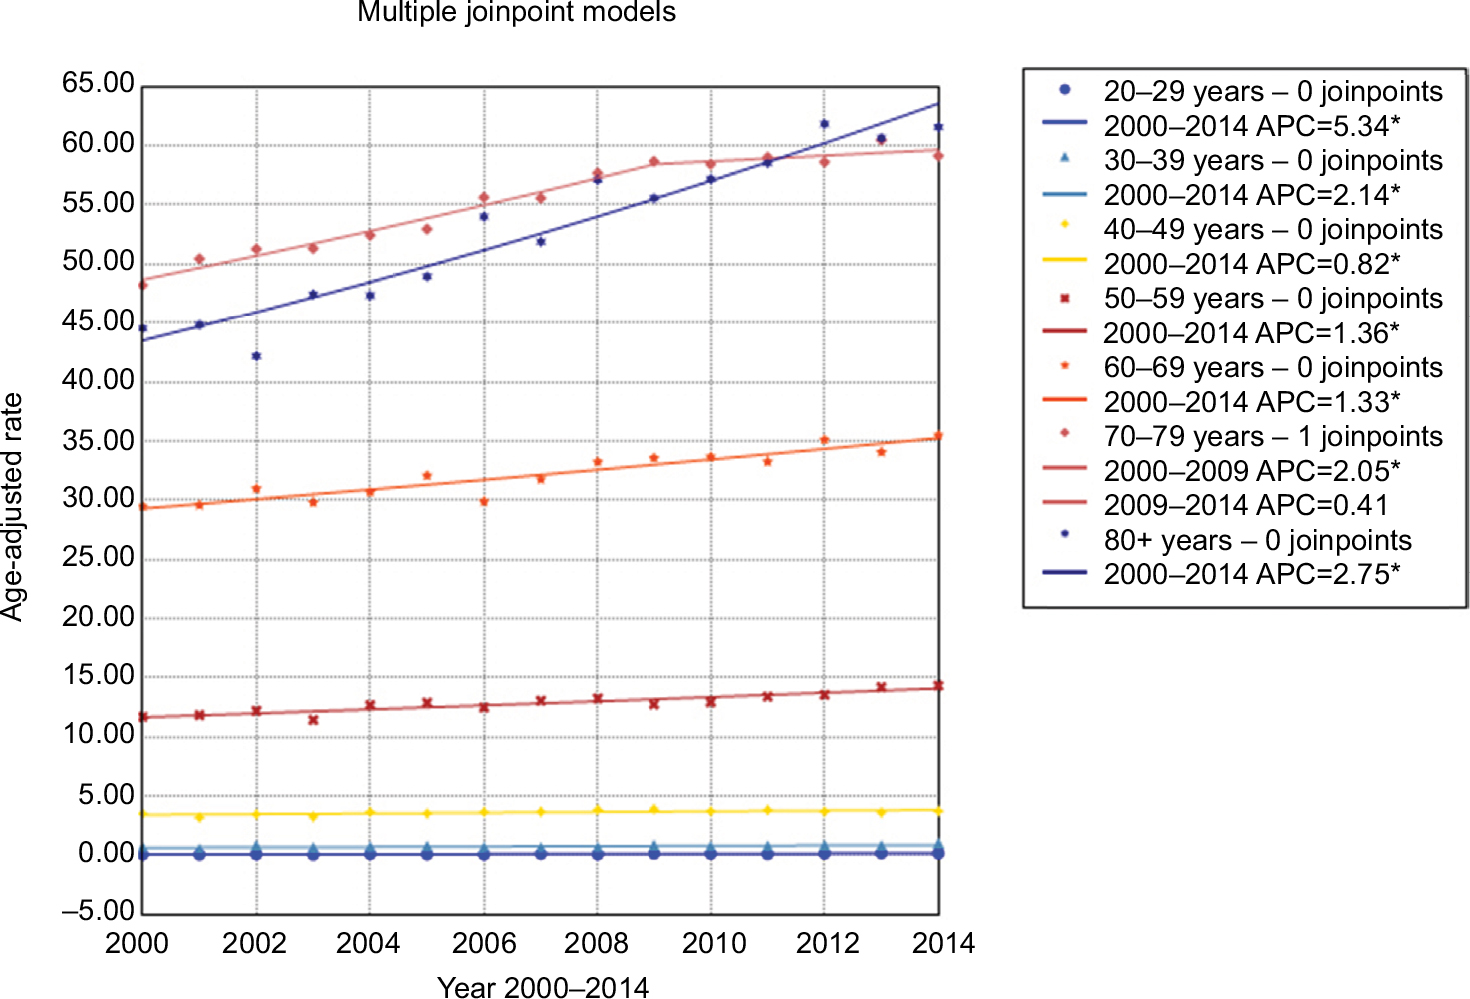 | Figure 3 Trends in pancreatic cancer incidence during 2000–2014 stratified by age subgroups. Rates were age-adjusted to the 2000 US standard population. Note: *p<0.05. |
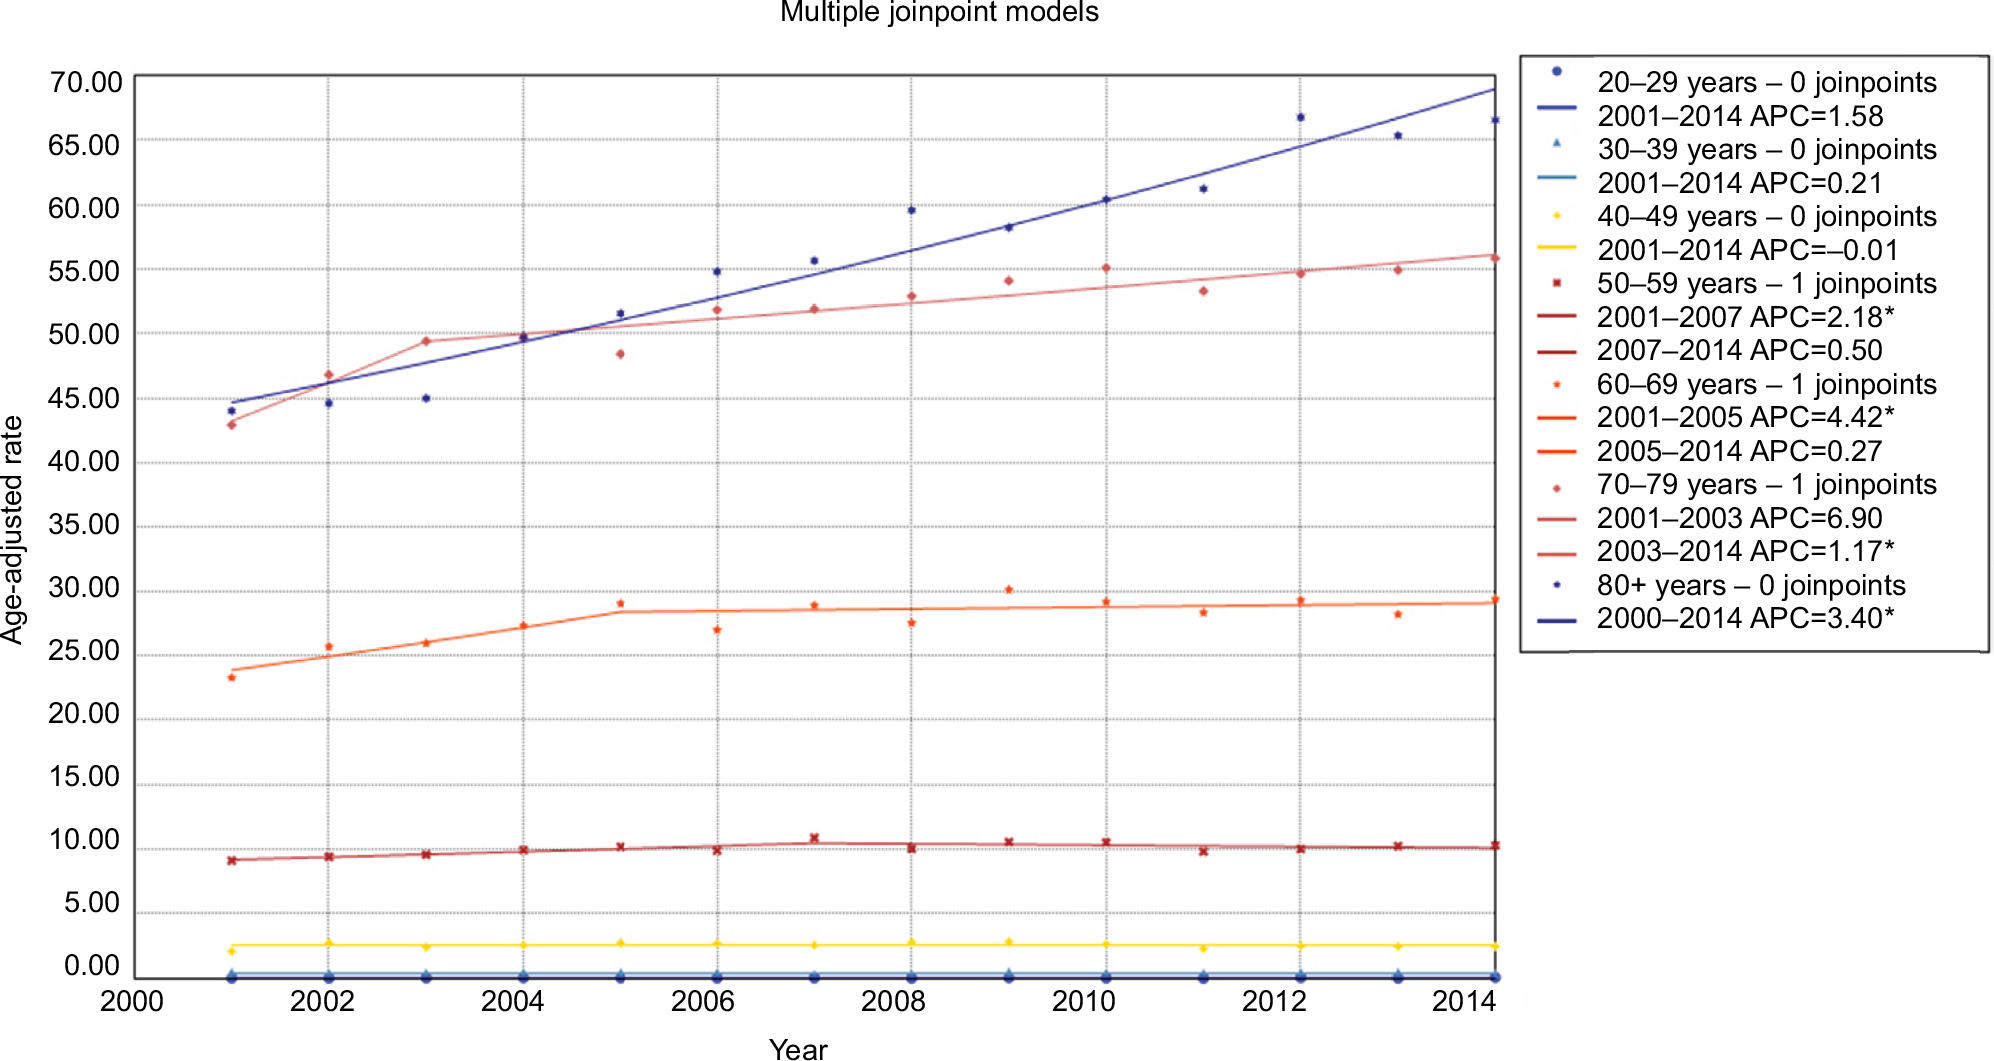 | Figure 4 Trends in pancreatic cancer mortality during 2000–2014 stratified by age subgroups. Rates were age-adjusted to the 2000 US standard population. Note: *p<0.05. |
Discussion
It is well acknowledged that the incidence and mortality of pancreatic cancer vary greatly across regions and populations worldwide. In general, high incidences and mortality rates are reported in developed countries and elderly populations.12–14 In the current study, an upward trend in pancreatic cancer incidence was noted throughout the study period, regardless of age, gender, ethnicity, and tumor stage, site, and size. The trend in mortality initially increased sharply and then slowed down after 2005. The detailed reasons for the more slowly increasing trends were unclear and we supposed that improvements in therapy for pancreatic cancer may be part of the explanation.15 The mortality rate remained steady or slightly increased. The overall increased trends in incidence and mortality were not influenced by other variables.
Those findings were slightly different from other registry-based data, where the trend remained relatively stable or even decreased gradually. In Europe, Wood et al16 examined the incidence, survival, and mortality trends of pancreatic cancer in England and Wales during 1975–2000. For both males and females, the incidence rate declined from peak levels during the 1970s and 1980s, and then fluctuated or leveled off. A similar trend in mortality was also observed during this period. Another study17 from 22 European countries also documented a leveling-off trend in mortality in Europe during the 1990s. In the USA, Weiss and Benarde18 assessed the temporal trends in mortality during 1920–1978. For males, mortality initially increased steeply to a peak in 1970, and thereafter declined gradually. For females, the increase was continuous but slower during this period. In 1995, Zheng et al19 analyzed the incidence of pancreatic cancer in Connecticut, USA, during 1935–1990. From the early 1970s, there were no signs of an increasing trend in incidence in Connecticut. For males, the incidence increased during 1935–1964 and leveled off thereafter. For females, the incidence increased during 1935–1974 and then remained relatively stable. Another study20 based on nine SEER registries also revealed a decreased incidence trend for pancreatic cancer between 1973 and 2002. In terms of mortality, Ma et al21 reported that white and black people experienced opposite trends. In white males, mortality decreased during 1970–1995 and then increased to 2009. In white females, mortality slightly increased during 1970–1984, leveled off until the late 1990s, and increased again thereafter. However, in black patients mortality initially increased and decreased thereafter. We did not observe different trends in black and white patients in the current study. Different population origins may partly account for the different trends. Indeed, two studies from Europe published in 2017 showed an increasing incidence trend in pancreatic cancer, and the study from France23 also described diverging trends in pancreatic cancer incidence and mortality.22,23 The incidence in both males and females increased during the past three decades, while mortality remained similar in men and slightly increased in women.23 Several commentaries considered that these trends might be artificial.24,25 The incidence and mortality rates in China also increased gradually, as reported by Chen et al.26 Owing to the lack of early diagnosis and effective therapies, the burden of pancreatic cancer remains huge.
Regarding increased trends in incidence, advances in high-resolution imaging and the widespread adoption of endoscopic ultrasound may have contributed to more cases of pancreatic cancer being diagnosed in the early stages. Sharp increases in the incidence of localized and small tumors (<2 cm) in the current study also support this explanation (Figures S5 and S9). Early stage and small size are two important prognostic factors for pancreatic cancer.27 The early diagnosis of pancreatic cancer may have partly decreased the mortality rate after 2006. Besides, recent advances in therapies for pancreatic cancer have partly improved the survival outcomes of pancreatic cancer.15,28 Rising mortality rates in early stages and small-size pancreatic cancer also slowed down in recent years in the current study (Figures S6 and S10). The potential mechanisms underlying the increased trends in incidence and mortality warrant investigation in further studies.
One strength of our study is that the results are based on 18 SEER registries, comprising the largest data set and covering approximately 30% of the overall US population. The high-quality data source indirectly supports the reliability of the overall results. However, there are also some limitations to our study. The results may be restricted to the US population and may not be generalizable to other populations in the world. In addition, we were unable to compare long-term trends based on the 18 SEER registers. Furthermore, several factors such as tobacco consumption, obesity, and chronic pancreatitis29–31 could not be examined in the current study.
Taken together, our findings reveal that there were increasing trends in incidence and mortality rates of pancreatic cancer, and fill a critical knowledge gap concerning recent trends in pancreatic cancer. Further studies are needed to determine the potential mechanisms underlying the increased trends in pancreatic cancer in the USA.
Abbreviations
SEER: Surveillance, Epidemiology, and End Results
ICD-O-3: International Classification of Diseases for Oncology, Third Edition
APC: annual percentage change
AAPC: average annual percentage change
Acknowledgments
We thank the National Cancer Institute’s SEER Program for collection of the SEER data. The work was funded by the Programs of the National Natural Science Foundation of China (nos 81330011 and 81570512) and the Science Fund for Creative Research Groups of the National Natural Science Foundation of China (no. 81721091).
Author contributions
All authors contributed toward data analysis, drafting and critically revising the paper and agree to be accountable for all aspects of the work.
Disclosure
The authors report no conflicts of interest in this work.
References
Siegel RL, Miller KD, Jemal A. Cancer Statistics, 2017. CA Cancer J Clin. 2017;67:7–30. | ||
Surveillance, Epidemiology, and End Results Program.. Cancer Stat Facts: Pancreas Cancer. National Cancer Institute; 2017. Available from: https://seer.cancer.gov/statfacts/html/pancreas.html. Accessed July, 2017. | ||
Inoue M, Iwasaki M, Otani T, Sasazuki S, Noda M, Tsugane S. Diabetes mellitus and the risk of cancer: results from a large-scale population-based cohort study in Japan. Arch Intern Med. 2006;166:1871–1877. | ||
Huxley R, Ansary-Moghaddam A, Berrington de Gonzalez A, Barzi F, Woodward M. Type-II diabetes and pancreatic cancer: a meta-analysis of 36 studies. Br J Cancer. 2005;92:2076–2083. | ||
Bosetti C, Lucenteforte E, Silverman DT, et al. Cigarette smoking and pancreatic cancer: an analysis from the International Pancreatic Cancer Case-Control Consortium (Panc4). Ann Oncol. 2012;23:1880–1888. | ||
Ilic M, Ilic I. Epidemiology of pancreatic cancer. World J Gastroenterol. 2016;22:9694–9705. | ||
Surveillance, Epidemiology, and End Results Program. SEER*Stat Database: Incidence - SEER 18 Regs Research Data + Hurricane Katrina Impacted Louisiana Cases, Nov 2016 Sub (2000-2014) <Katrina/Rita Population Adjustment> - Linked To County Attributes - Total U.S., 1969-2015 Counties, National Cancer Institute, DCCPS, Surveillance Research Program, released April 2017, based on the November 2016 submission. National Cancer Institute; 2016. Available from: https://seer.cancer.gov/data-software/documentation/seerstat/nov2016. Accessed July, 2017. | ||
Surveillance, Epidemiology, and End Results Program. SEER*Stat Database: Incidence-Based Mortality - SEER 18 Regs (Excl Louisiana) Research Data, Nov 2016 Sub (2000-2014) <Katrina/Rita Population Adjustment> - Linked To County Attributes - Total U.S., 1969-2015 Counties, National Cancer Institute, DCCPS, Surveillance Research Program, released April 2017, based on the November 2016 submission. National Cancer Institute; 2016. Available from: https://seer.cancer.gov/data-software/documentation/seerstat/nov2016. Accessed July, 2017. | ||
Surveillance, Epidemiology, and End Results Program. SEER Research Data Record Description Cases Diagnosed in 1973-2014. National Cancer Institute; 2017. Available from: https://seer.cancer.gov/data/seerstat/nov2016/TextData.FileDescription.pdf. Accessed July, 2017. | ||
Kim HJ, Fay MP, Feuer EJ, Midthune DN. Permutation tests for joinpoint regression with applications to cancer rates. Stat Med. 2000;19:335–351. | ||
Statistical Methodology and Applications Branch, Surveillance Research Program, National Cancer Institute; 2017. Joinpoint Regression Program. Available from: https://surveillance.cancer.gov/joinpoint/. Accessed July, 2017. | ||
Ferlay J, Soerjomataram I, Dikshit R, et al. Cancer incidence and mortality worldwide: sources, methods and major patterns in GLOBOCAN 2012. Int J Cancer. 2015;136:E359–E386. | ||
Hidalgo M, Cascinu S, Kleeff J, et al. Addressing the challenges of pancreatic cancer: future directions for improving outcomes. Pancreatology. 2015;15:8–18. | ||
Kamisawa T, Wood LD, Itoi T, Takaori K. Pancreatic cancer. Lancet. 2016;388:73–85. | ||
Rebelo A, Molpeceres J, Rijo P, Reis CP. Pancreatic Cancer Therapy Review: From Classic Therapeutic Agents to Modern Nanotechnologies. Curr Drug Metab. 2017;18:346–359. | ||
Wood HE, Gupta S, Kang JY, et al. Pancreatic cancer in England and Wales 1975-2000: patterns and trends in incidence, survival and mortality. Aliment Pharmacol Ther. 2006;23:1205–1214. | ||
Levi F, Lucchini F, Negri E, La Vecchia C. Pancreatic cancer mortality in Europe: the leveling of an epidemic. Pancreas. 2003;27:139–142. | ||
Weiss W, Benarde MA. The temporal relation between cigarette smoking and pancreatic cancer. Am J Public Health. 1983;73:1403–1404. | ||
Zheng T, Holford TR, Ward BA, McKay L, Flannery J, Boyle P. Time trend in pancreatic cancer incidence in Connecticut, 1935-1990. Int J Cancer. 1995;61:622–627. | ||
Zhang J, Dhakal I, Yan H, Phillips M, Kesteloot H, SEER Cancer Registries. Trends in pancreatic cancer incidence in nine SEER Cancer Registries, 1973-2002. Ann Oncol. 2007;18:1268–1279. | ||
Ma J, Siegel R, Jemal A. Pancreatic cancer death rates by race among US men and women, 1970-2009. J Natl Cancer Inst. 2013;105:1694–1700. | ||
Crocetti E, Mancini S. Pancreatic cancer incidence rises also in Italy. Int J Epidemiol. 2017;46:2090. | ||
Bouvier AM, Uhry Z, Jooste V, et al. Focus on an unusual rise in pancreatic cancer incidence in France. Int J Epidemiol. 2017;46:1764–1772. | ||
Armstrong BK. Commentary: A pancreatic cancer incidence and mortality gap? Int J Epidemiol. 2017;46:1775–1776. | ||
Vajdic CM, Laaksonen MA. Commentary: Unusual pancreatic cancer incidence and mortality patterns. Int J Epidemiol. 2017;46:1772–1773. | ||
Chen WQ, Liang D, Zhang SW, Zheng RS, He YT. Pancreatic cancer incidence and mortality patterns in china, 2009. Asian Pac J Cancer Prev. 2013;14:7321–7324. | ||
Agarwal B, Correa AM, Ho L. Survival in pancreatic carcinoma based on tumor size. Pancreas. 2008;36:e15–e20. | ||
Manzur A, Oluwasanmi A, Moss D, Curtis A, Hoskins C. Nanotechnologies in Pancreatic Cancer Therapy. Pharmaceutics. 2017;9(4):39. | ||
Ezzati M, Henley SJ, Lopez AD, Thun MJ. Role of smoking in global and regional cancer epidemiology: current patterns and data needs. Int J Cancer. 2005;116:963–971. | ||
Parkin DM, Boyd L, Walker LC. 16. The fraction of cancer attributable to lifestyle and environmental factors in the UK in 2010. Br J Cancer. 2011;105 Suppl 2:S77–S81. | ||
Willett WC. Diet and cancer. Oncologist. 2000;5:393–404. |
 © 2018 The Author(s). This work is published and licensed by Dove Medical Press Limited. The full terms of this license are available at https://www.dovepress.com/terms.php and incorporate the Creative Commons Attribution - Non Commercial (unported, v3.0) License.
By accessing the work you hereby accept the Terms. Non-commercial uses of the work are permitted without any further permission from Dove Medical Press Limited, provided the work is properly attributed. For permission for commercial use of this work, please see paragraphs 4.2 and 5 of our Terms.
© 2018 The Author(s). This work is published and licensed by Dove Medical Press Limited. The full terms of this license are available at https://www.dovepress.com/terms.php and incorporate the Creative Commons Attribution - Non Commercial (unported, v3.0) License.
By accessing the work you hereby accept the Terms. Non-commercial uses of the work are permitted without any further permission from Dove Medical Press Limited, provided the work is properly attributed. For permission for commercial use of this work, please see paragraphs 4.2 and 5 of our Terms.