")
Back to Journals » Clinical Ophthalmology » Volume 8
Retrobulbar blood flow changes in eyes with diabetic retinopathy a 10 year follow up study
Authors Neudorfer M, Kessner R, Goldenberg D, Lavie A, Kessler A
Received 15 July 2014
Accepted for publication 4 September 2014
Published 21 November 2014 Volume 2014:8 Pages 2325—2332
DOI https://doi.org/10.2147/OPTH.S71158
Checked for plagiarism Yes
Review by Single anonymous peer review
Peer reviewer comments 5
Editor who approved publication: Dr Scott Fraser
Meira Neudorfer,1,* Rivka Kessner,1,* Dafna Goldenberg,1 Anat Lavie,1 Ada Kessler2
1Department of Ophthalmology, 2Radiology Ultrasound Unit, Sackler Faculty of Medicine, Tel Aviv Sourasky Medical Center, Tel Aviv University, Tel Aviv, Israel
*These authors contributed equally to this work
Purpose: We sought to assess long-term changes in the flow parameters of retrobulbar vessels in diabetic patients.
Methods: The retrobulbar circulation of 138 eyes was evaluated between 1994 and 1995 and 36 eyes were reevaluated between 2004 and 2008 (study group). They were divided into four groups: eyes of diabetic patients without diabetic retinopathy (DR), eyes with nonproliferative DR, eyes with proliferative DR, and eyes of nondiabetic patients (controls). Color Doppler imaging was used to assess the flow velocities in the major retrobulbar vessels. The resistive index (RI) was calculated and compared among the groups and between the two time periods.
Results: RI values of the central retinal artery and posterior ciliary artery had increased in the two non-DR groups and in the nonproliferative DR group, with a surprising decrease measured in eyes with proliferative DR (P= nonsignificant [NS]). Combining the nonproliferative DR and proliferative DR groups resulted in a milder increase of the RI of the posterior ciliary artery (P= NS) and the central retinal artery (P=0.02) in the DR group compared to the other groups.
Conclusion: Our results demonstrate that an increase of the resistance in the retrobulbar vessels, as a part of DR, can lessen over time and may even be reversed.
Keywords: color Doppler imaging, diabetic retinopathy, retrobulbar blood flow
Introduction
Diabetic retinopathy (DR) is the most frequent cause of preventable blindness in working-age adults (20–74 years), representing a major public health issue.1 The frequency of DR as the most common microvascular complication of diabetes mellitus (DM) increases with age and disease duration. Almost all patients with type 1 DM and over 60% of the patients with type 2 DM will develop DR in 20 years.2 DR is a progressive disease, and in this study, its progression was divided into two main phases according to the Early Treatment Diabetic Retinopathy Study’s final retinopathy severity scale: nonproliferative DR (NPDR) and proliferative DR (PDR). The presence of apparent neovascularization, preretinal hemorrhage, or vitreous hemorrhage is the basis for characterizing an eye as having PDR.1,3
There is only one short-term follow-up study in the literature that has assessed changes in the ocular blood flow in DR by color Doppler imaging (CDI).4 Its results showed significantly increased central retinal vein peak systolic velocity (PSV), end-diastolic velocity (EDV), and resistive index (RI), with progression of the retinopathy over a period of 21 months. Circulatory parameters in the central retinal artery (CRA) and posterior ciliary artery (PCA) did not alter significantly after progression of DR.4 Only a few follow-up studies on these changes have been carried out, and they utilized techniques other than CDI.5–7
There has not been any long-term follow-up study about the changes of the ocular blood flow in the setting of DR. The purpose of the current study was to conduct measurements with CDI and present the changes in RI of the retrobulbar vessels in the same diabetic patients and nondiabetic controls after a 10-year follow-up.
Materials and methods
Subjects
The study protocol adhered to the tenets of the Declaration of Helsinki and was approved by the institutional ethics committee of the Tel Aviv Medical Center (TAMC), Tel Aviv, Israel. All participants signed an informed consent form after a detailed explanation of the nature and possible consequences of the study procedures.
This study is a historical prospective study because the baseline data were taken from measurements obtained for unpublished research that was conducted in the authors’ Department of Ophthalmology at TAMC 10 years earlier.
Patients with a history of nondiabetic vascular ocular disease, retinal detachment, previous ocular surgery, or panretinal photocoagulation were excluded. The follow-up data were taken from measurements of the same parameters made 1 decade later on the same patients from among the patients of the original cohort who were available and compliant.
All the patients of the current study underwent a full slit-lamp examination and fundoscopy by a staff ophthalmologist. The diagnosis and severity of DR were determined according to the system used in the Early Treatment Diabetic Retinopathy Study.3 The patients were then divided into the same four groups mentioned earlier: patients with DM without retinal findings, with NPDR, with PDR, and nondiabetic controls.
Methods
Retrobulbar blood flow velocity was determined by CDI of the ophthalmic artery (OA), CRA, and PCA using the ultrasound device that was available in our department. During the years 1994–1995, the sonographic examination was performed using Acuson128XP10 (Acuson, Mountain View, CA, USA) with a 7.5 MHz linear transducer. During the years 2004–2008, the ATL HDI 5000 (Philips, Seattle, WA, USA) with a multifrequency 7–12 MHz linear array probe was used. All CDI examinations were performed by the same experienced sonographer at the two time points. Each patient was placed in a supine position, and the probe was applied to the closed eyelid using sterile coupling gel. The PSV (cm/s) and EDV (cm/s) of blood flow in the OA, CRA, and PCA were measured with CDI. The RI was then calculated using the expression [(PSV − EDV)/PSV] with a computer for each measured vessel. We decided to include only the RI measurements in the statistical analysis.
Statistical analysis
The RI was the main measure for comparison of the changes in the four groups between the two time points 1994–1995 and 2004–2008. During the analysis, the NPDR and PDR groups were combined in order to increase the statistical significance of the results. The paired t-test assessed the differences between the RI results of the same patients between the two points of examination. Statistical significance was set at P<0.05. The Pearson correlation test assessed the correlation between the differences in the RI during the follow-up and the duration of diabetes. A one-way analysis of variance characterized changes in the RI between the four groups. All the measurable results were specified as the means with standard deviations (SDs). The SPSS program (Statistical Package for the Social Sciences Statistics, version 17.0.1) was used for all analyses.
Results
The original participants included 72 consecutive patients (138 eyes), of whom 33 had since died, three declined to participate in the current study, and 17 patients were unable to arrive to the medical center for various reasons (moved away and so on). We had to exclude one eye of two patients due to major ocular pathology (end-stage glaucoma). Thus, we had 36 eyes from 19 patients of the previous study who were examined a second time by CDI after an interval of 10 years. The patients included 13 men and six women; their mean age was 69.9 years (SD =10.07) and the mean duration of DM in all the patients was 21.4 years (SD =7.6). The mean follow-up period was 10.9 years (SD =2.19), and the median measure of 10 years was used in the statistical analysis for all the patients.
The study population was again divided into four groups according to the first examination and diagnosis at presentation: diabetic patients without DR (n=12 eyes, 33%), patients with NPDR (n=9 eyes, 25%), patients with PDR (n=8 eyes, 22%), and nondiabetic patients (n=7 eyes, 19%; served as controls). The relevant characteristics of all the study participants are listed in Table 1. During the follow-up, three eyes progressed from NPDR to PDR, but they were allocated to their original group in the statistical analysis. Furthermore, one patient’s right eye was in the NPDR group and his left eye was in the PDR group.
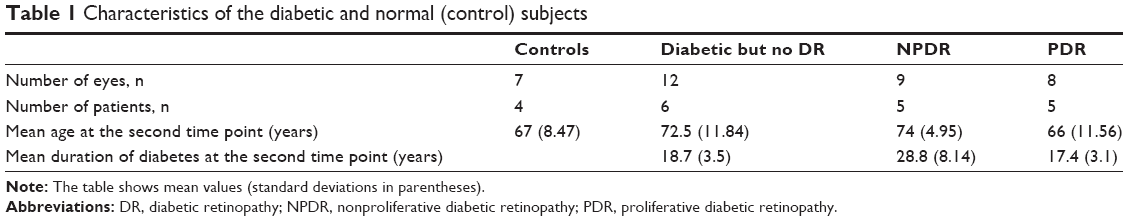 | Table 1 Characteristics of the diabetic and normal (control) subjects |
There had been a similar significant increase (P=0.02–0.006) in the RI of the OA in all patient groups (Figure 1 and Table 2). The question arose as to whether this increase was caused by aging, but no correlation was found between the age of the patients and the RI results of the OA (P=0.56, nonsignificant [NS]). RI values of the CRA and PCA had a different pattern of progression: they increased in the two non-DR groups and in the NPDR group (P=0.06–0.1, NS), with a nonsignificant decrease (P=0.3–0.8, NS) measured in eyes with PDR (Figures 2 and 3; Table 2). Combining the NPDR and PDR groups in order to increase the statistical significance of the results resulted in a smaller increase in the RI values of the PCA (P=0.12, NS) and the CRA (P=0.02) in the DR group, compared to the increases in the other groups (Figures 4 and 5; Table 3).
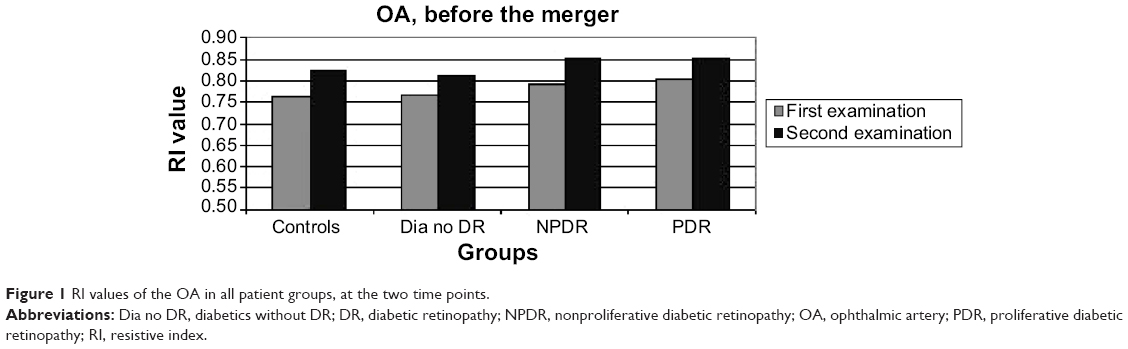 | Figure 1 RI values of the OA in all patient groups, at the two time points. |
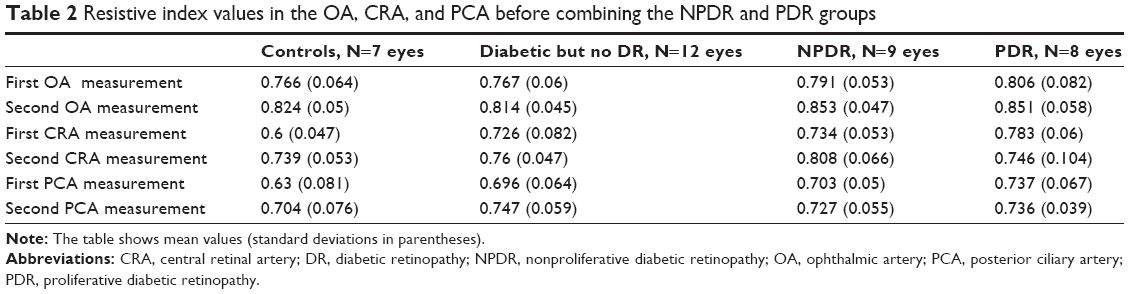 | Table 2 Resistive index values in the OA, CRA, and PCA before combining the NPDR and PDR groups |
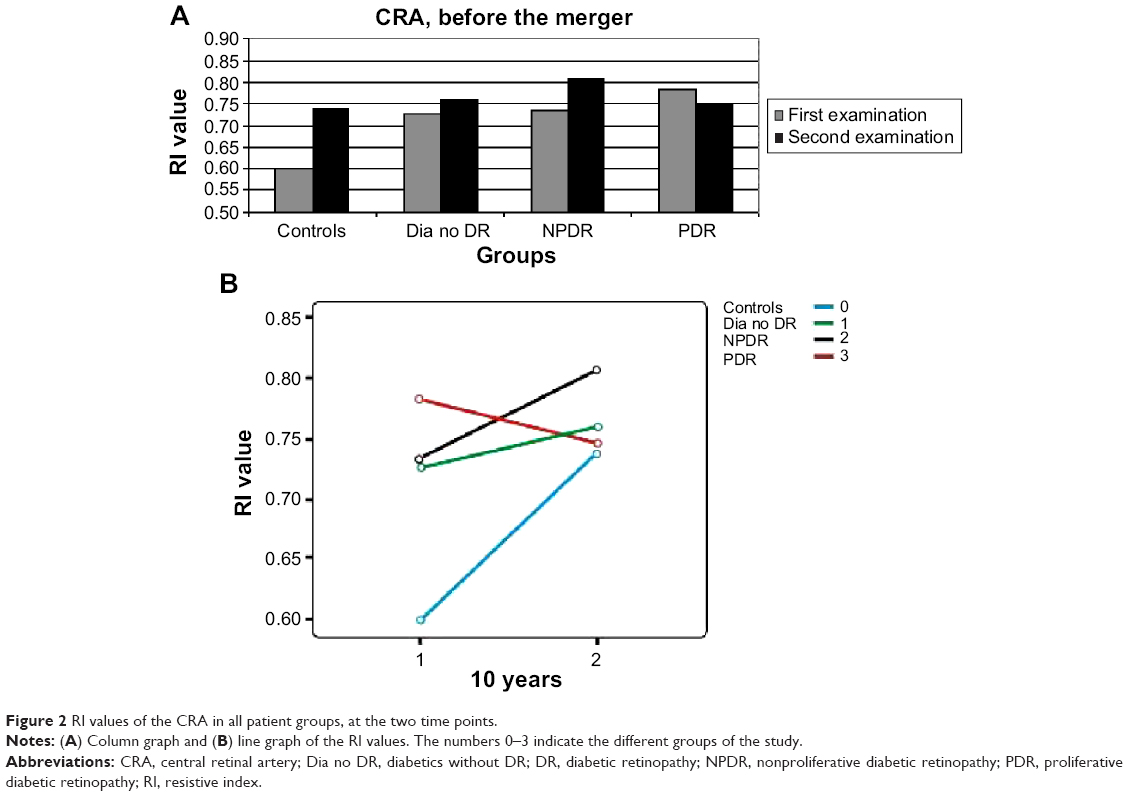 | Figure 2 RI values of the CRA in all patient groups, at the two time points. |
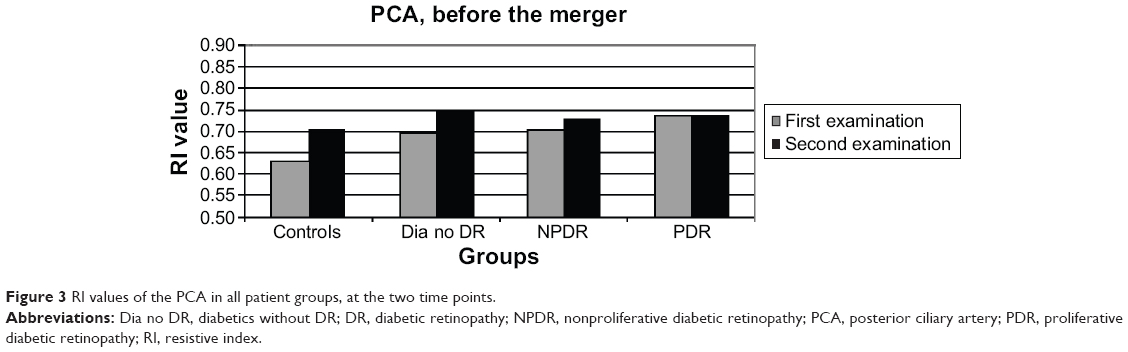 | Figure 3 RI values of the PCA in all patient groups, at the two time points. |
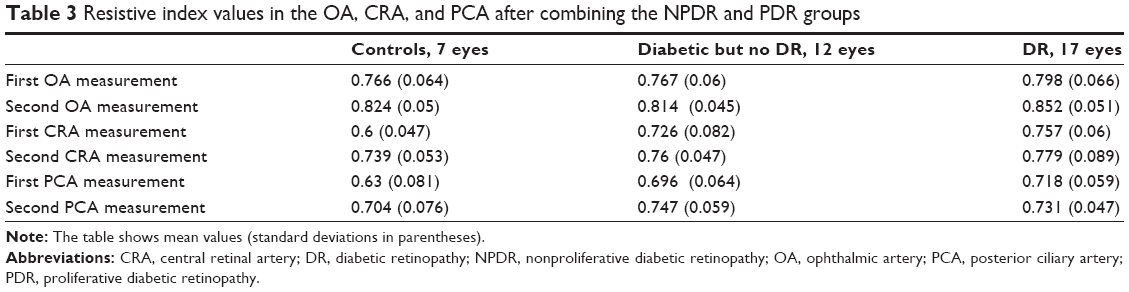 | Table 3 Resistive index values in the OA, CRA, and PCA after combining the NPDR and PDR groups |
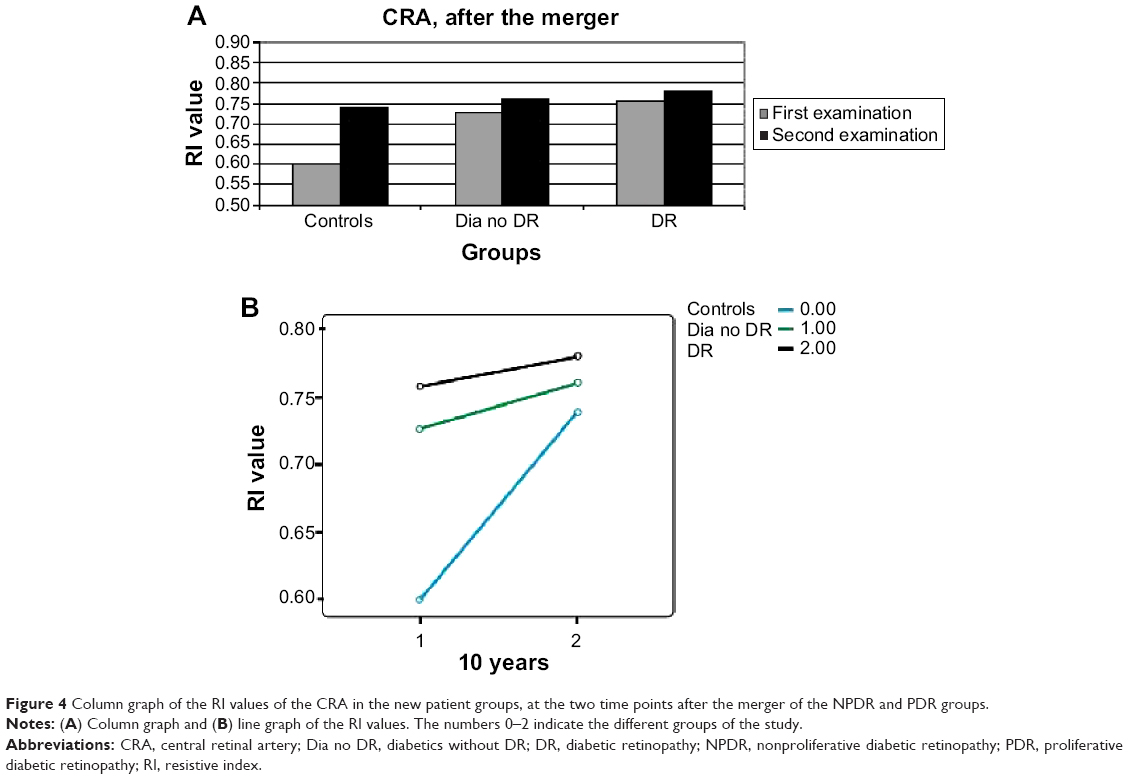 | Figure 4 Column graph of the RI values of the CRA in the new patient groups, at the two time points after the merger of the NPDR and PDR groups. |
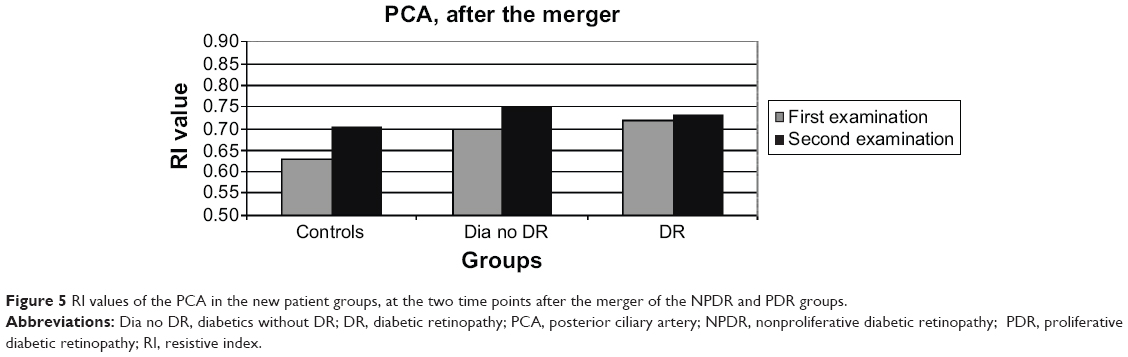 | Figure 5 RI values of the PCA in the new patient groups, at the two time points after the merger of the NPDR and PDR groups. |
Discussion
The pathophysiological mechanism of DR remains a challenge for medical research. Although the exact pathogenesis of the disease is yet unknown, there are several theories about the processes that affect the ocular blood flow in DR. Most of the studies claim that the central abnormality in DR is microangiopathy, which causes macular edema and retinal ischemia. The microangiopathy is multifactorial and appears to be a consequence of hyperglycemic and hypoxic damages.8–12
Hemodynamic changes in the diabetic retina and choroid have been the focus of considerable research. As in other vascular beds, ocular blood flow is measured as blood flow velocity multiplied by cross-sectional area. Reports about ocular blood flow abnormalities in the different stages of DR show some significant deviations, but the exact nature of these deviations is somewhat controversial and possibly attributable to the variety of techniques used to measure retinal blood flow.13,14
Despite the many advances that have been made in the past 30 years, there is still no gold standard for the evaluation of blood flow in humans. The methods that are currently available for the assessment of ocular blood flow utilize different measures that evaluate, and thus represent, different phases in the retinal circulation.15 These methods include fluorescein angiography, fluorescein angiography with scanning laser ophthalmoscopy, CDI, laser Doppler velocimetry, laser Doppler flowmetry, scanning laser Doppler flowmetry, laser speckle imaging, blue field entoptic test, pneumotonometry, laser interferometric measurement of fundus pulsation, and color Doppler Fourier domain optical coherence tomography.15–17
CDI is an ultrasound-based technique that combines B-scan images with velocity information obtained from the Doppler shift of the moving erythrocytes. Doppler spectra can be obtained from the CRA, PCA, and OA. The operator can identify the PSV and the EDV, which represent the fastest velocities in systole and diastole, respectively. The RI can be calculated as a measure of downstream vascular resistance. The RI is calculated as RI = (PSV − EDV)/PSV.15–17 All the studies utilizing CDI that have been published thus far showed a decrease in the retrobulbar flow velocities, an increase of the resistance, or a combination of these two processes in DR. These results have been attributed to downstream vascular changes related to diabetes in both the retinal and choroidal vasculature, ie, the concept of “diabetic choroidopathy.”18–33
Furthermore, several studies reported a correlation between the severity of retinopathy and the extent of the decrease in blood flow. Hyperglycemia increases blood flow and interferes with retinal autoregulation. Retinal blood flow regulation is achieved through changes in ocular vascular resistance; thus, the parameter of resistance is important in the assessment of hemodynamic changes in DR.19,20,26,34,35
To the best of the authors’ knowledge, this study is the first to assess long-term changes in flow parameters of the retrobulbar vessels in diabetic patients. Blood flow measurements, as expressed in their RI values, were compared after an interval of 10 years in 36 eyes of nondiabetic patients, diabetic patients without DR, patients with NPDR, and patients with PDR. We chose to present the RI measurements only because the RI is more accurate than pure velocity measurements. In reproducibility tests, the lowest coefficients of variation were obtained for the RI, among all the circulatory parameters of CDI. Furthermore, the RI value is more reliable because it is not direction (angle) dependent, as has been proven by several studies.30,31,36–38
The results of the RI of the OA were as expected: there was an increase in the RI in all patient groups during the 10 years that had elapsed since the baseline evaluation. The RI values of the CRA and the PCA had increased in the two non-DR groups and in the NPDR group, with a surprising, albeit nonsignificant, decrease in eyes with PDR. Combining the NPDR and PDR groups resulted in a smaller increase in the RI of the PCA and the CRA in the DR group compared to the other groups. The slope of the increase in the RI of the CRA was the smallest in the DR group, and the extent of change reached a level of significance. This result contradicted the widely accepted hypothesis, according to which progression of the disease is accompanied with a greater increase in the resistance.
The age difference between diabetic patients and normal controls in our study was not significant. In addition, there was no correlation between the changes in RI during follow-up and the age of the patients. This result is in line with the findings of Mendivil et al.20 However, there are a few studies that did show a linear correlation between the age of the patient and the RI, and such a correlation could explain the increase in the RI that had been measured in the control group. Williamson et al39 presented a linear correlation between the RI of the CRA and the age of the patient, attributing the increase in RI with the progression of age to the decrease in the peripheral perfusion. Greenfield et al40 demonstrated an increase in the RI of the CRA and the PCA with the progression of age in 32 healthy subjects. Harris et al41 presented the changes in retrobulbar blood flow with age progression in male versus female subjects and showed an increase in RI of the OA in both sexes with age progression.
The only follow-up study on the assessment of the ocular blood flow utilizing CDI in diabetic patients thus far was that of Dimitrova et al.4 The mean follow-up period in their study was 21 months. The patients who developed DR progression showed significantly increased central retinal vein PSV, EDV, and RI at the final measurement compared to the initial measurement, but circulatory parameters in the CRA and the PCA did not alter significantly after progression of DR. This follow-up might have been too short to reflect the unique changes that characterize the ocular hemodynamics in DR.
Past findings on CDI measurements in diabetic patients versus healthy controls led to the assumption that the RI increases with the progression of retinopathy. The increase in RI was proposed as being attributable to several mechanisms, such as capillary obstruction due to microaneurysms, sclerotic lesions, and so on.10 The current findings demonstrated a smaller increase in the RI of the CRA in patients with DR compared to healthy controls, and even a decrease in the RI of patients with PDR.
The longest published follow-up study on changes in the ocular blood flow in patients with DR was carried out by Konno et al7 who used laser Doppler velocimetry. The follow-up period in their study lasted 3.8 years, and the duration of the disease ranged between 7 and 20 years. The changes in the flow measurements were compatible with the results of the current study. They showed a unique transition from decreasing retinal blood flow to increasing retinal blood flow in patients with type 1 DM, which depended on the duration of disease and the severity of the retinopathy. Their study proved that at approximately 20 years of diabetes, the retinal blood flow values are the lowest and the blood flow in the major retinal arteries ceases to decrease thereafter and begins to increase.7 The decreasing blood flow measured in the major retinal arteries close to the onset of the disease was attributed to increasing resistance to flow through the retinal vascular network. The beginning of an increase in retinal blood flow suggests that there is a beginning of a net decrease in the resistance to flow. One explanation for the net decrease is that short-circuiting of the obstructed retinal capillary network begins to occur during the progression of DR. This explanation is supported by histopathologic studies42,43 that clearly show areas of capillary closure traversed by preferential dilated anastomotic channels that act as shunts between arterioles and venules. The beginning of an increase in blood flow in the major feeding arteries may thus be an indication that more blood begins to flow through the preferential channels, bypassing obstructed portions of the capillary network.
The saturation curve model, which applies to variables that follow a sigmoid pattern, provides another reasonable explanation for the current findings. The pattern of progression in DR is still unknown. Therefore, if the increase in RI follows a sigmoid pattern, the reason for the milder increase in the RI of the DR group could be their progression to the plateau phase of the curve. The patients in the DR group began the study with a higher RI value and reached their maximum potential for increasing the RI sooner than the other groups, whereupon the slope of the increase in the RI in this group would be significantly less.
One of the main limitations of our study is its small sample. We have conducted a long-term follow-up of old-age patients with DM. Unfortunately, many patients died during the follow-up. In addition, we had only partial data regarding some of the patients, and we had to exclude from the study the measurments of PSV and EDV, the blood pressure, and the intraocular pressure results of the patients. Because of the unique nature of our study, we believe that its results are important and need to be presented despite the limitations.
Conclusion
The current study used CDI to assess long-term changes in flow parameters in diabetic patients. During the 10-year interval between measurements, the RI of the CRA and the PCA decreased in patients with PDR and slightly increased in patients with DR, both compared to healthy controls. The increase of resistance in the retrobulbar vessels, as a part of DR, was shown to lessen during follow-up. These results contradicted the commonly accepted theory that claims that the RI increases as a part of the deterioration that takes place during the disease process, but the findings were in line with the results of follow-up studies that had employed other techniques. Multicenter studies are needed to verify these findings and their contribution to the better understanding of the pathophysiology of DR.
Acknowledgment
The work included in this study was presented as a poster at the Annual Meeting of the Association for Research in Vision and Ophthalmology in May 2010.
Disclosure
The authors report no conflicts of interest in this work.
References
Cheung N, Mitchell P, Wong TY. Diabetic retinopathy. Lancet. 2010;376:124–136. | ||
Mohamed Q, Gillies MC, Wong TY. Management of diabetic retinopathy – a systematic review. JAMA. 2007;298:902–916. | ||
Wilkinson CP, Ferris FL, Klein RE, et al; for the Global Diabetic Retinopathy Project Group. Proposed international clinical diabetic retinopathy and diabetic macular edema disease severity scales. Ophthalmology. 2003;110:1677–1682. | ||
Dimitrova G, Kato S, Yamashita H, et al. Relation between retrobulbar circulation and progression of diabetic retinopathy. Br J Ophthalmol. 2003;87:622–625. | ||
Rimmer T, Fallon TJ, Kohner EM. Long-term follow-up of retinal blood flow in diabetes using the blue light entoptic phenomenon. Br J Ophthalmol. 1989;73:1–5. | ||
Falck A, Laatikainen L. Retinal vasodilation and hyperglycemia in diabetic children and adolescents. Acta Ophthalmol Scand. 1995;73:119–124. | ||
Konno S, Feke GT, Yoshida A, Fujio N, Goger DG, Buzney SM. Retinal blood flow changes in type I diabetes: a long-term follow-up study. Invest Ophthalmol Vis Sci. 1996;37:1140–1148. | ||
Lorenzi M, Gerhardinger C. Early cellular and molecular changes induced by diabetes in the retina. Diabetologia. 2001;44:791–804. | ||
Kroll P, Rodrigues EB, Hoerle S. Pathogenesis and classification of proliferative diabetic vitreoretinopathy. Ophthalmologica. 2007;221:78–94. | ||
Cai J, Boulton M. The pathogenesis of diabetic retinopathy: old concepts and new questions. Eye. 2002;16:242–260. | ||
Madsen-Bouterse SA, Kowluru RA. Oxidative stress and diabetic retinopathy: pathophysiological mechanisms and treatment perspectives. Rev Endocr Metab Disord. 2008;9:315–327. | ||
Ciulla TA, Amador AG, Zinman B. Diabetic retinopathy and diabetic macular edema: pathophysiology, screening, and novel therapies. Diabetes Care. 2003;26:2653–2664. | ||
Curtis TM, Gardiner TA, Stitt AW. Microvascular lesions of diabetic retinopathy: clues towards understanding pathogenesis? Eye. 2009;23:1496–1508. | ||
Pemp B, Schmetterer L. Ocular blood flow in diabetes and age-related macular degeneration. Can J Ophthalmol. 2008;43:295–301. | ||
Schmetterer L, Garhofer G. How can blood flow be measured? Surv Ophthalmol. 2007;52(suppl 2):134–138. | ||
Wang Y, Bower BA, Izatt JA, Tan O, Huang D. In vivo total retinal blood flow measurement by Fourier domain Doppler optical coherence tomography. J Biomed Opt. 2007;12:041215. | ||
Schmetterer L, Wolzt M. Ocular blood flow and associated functional deviations in diabetic retinopathy. Diabetologia. 1999;42:387–405. | ||
Tamaki Y, Nagahara M, Yamashita H, Kikuchi M. Blood velocity in the ophthalmic artery determined by color Doppler imaging in normal subjects and diabetics. Jpn J Ophthalmol. 1993;37:385–392. | ||
Goebel W, Lieb WE, Ho A, Sergott RC, Farhoumand R, Grehn F. Color Doppler imaging: a new technique to assess orbital blood flow in patients with diabetic retinopathy. Invest Ophthalmol Vis Sci. 1995;36:864–870. | ||
Mendivil A, Cuartero V, Mendivil MP. Ocular blood flow velocities in patients with proliferative diabetic retinopathy and healthy volunteers. Br J Ophthalmol. 1995;79:413–416. | ||
Li-Ping S. The clinical study of retinal hemodynamics in patients with diabetic retinopathy. Chin Ocular Fundus Dis. 1997;13:210–212. | ||
Arai T, Numata K, Tanaka K, et al. Ocular arterial flow hemodynamics in patients with diabetes mellitus. J Ultrasound Med. 1998;17:675–681. | ||
MacKinnon JR, McKillop G, O’Brien C, Swa K, Butt Z, Nelson P. Colour Doppler imaging of ocular circulation in diabetic retinopathy. Acta Ophthalmol Scand. 2000;78:386–389. | ||
Ino-ue M, Azumi A, Yamamoto M. Ophthalmic artery blood flow velocity changes in diabetic patients as a manifestation of macroangiopathy. Acta Ophthalmol Scand. 2000;78:173–176. | ||
Dimitrova G, Kato S, Tamaki Y, et al. Choroidal circulation in diabetic patients. Eye. 2001;15:602–607. | ||
Saito T, Tsubakimori S, Sakamoto Y, Okamoto N, Fukuda M. Color Doppler imaging investigation of orbital blood flow in patients with diabetic retinopathy who require hemodialysis. Folia Ophthalmol Japonica. 2003;54:172–175. | ||
Paivansalo M, Pelkonen O, Rajala U, Keinanen-Kiukaanniemi S, Suramo I. Diabetic retinopathy: sonographically measured hemodynamic alterations in ocular, carotid, and vertebral arteries. Acta Radiol. 2004;45:404–410. | ||
Krasnicki P, Mariak Z, Ustymowicz A, Proniewska-Skretek E. Assessment of blood flow in the ocular circulation in type 2 diabetes patients with color Doppler imaging. Klin Oczna. 2006;108:294–298. | ||
Baydar S, Adapinar B, Kebapci N, Bal C, Topbas S. Colour Doppler ultrasound evaluation of orbital vessels in diabetic retinopathy. Australas Radiol. 2007;51:230–235. | ||
Gracner T. Ocular blood flow velocity determined by color Doppler imaging in diabetic retinopathy. Ophthalmologica. 2004;218:237–242. | ||
Dimitrova G, Kato S. Color Doppler imaging of retinal diseases: major review. Surv Ophthalmol. 2010;55:193–214. | ||
Basturk T, Albayrak R, Ulas T, et al. Evaluation of resistive index by color Doppler imaging of orbital arteries in type II diabetes mellitus patients with microalbuminuria. Ren Fail. 2012;34:708–712. | ||
Meng N, Liu J, Zhang Y, Ma J, Li H, Qu Y. Color Doppler imaging analysis of retrobulbar blood flow velocities in diabetic patients without or with retinopathy: a meta-analysis. J Ultrasound Med. 2014;33(8):1381–1389. | ||
Güven D, Ozdemir H, Hasanreisoglu B. Hemodynamic alterations in diabetic retinopathy. Ophthalmology. 1996;103:1245–1249. | ||
Kawagishi T, Nishizawa Y, Emoto M, et al. Impaired retinal artery blood flow in IDDM patients before clinical manifestations of diabetic retinopathy. Diabetes Care. 1995;18:1544–1549. | ||
Senn BC, Kaiser HJ, Schotzau A, Flammer J. Reproducibility of color Doppler imaging in orbital vessels. Ger J Ophthalmol. 1996;5:386–391. | ||
Tranquart F, Bergès O, Koskas P, et al. Color Doppler imaging of orbital vessels: personal experience and literature review. J Clin Ultrasound. 2003;31:258–273. | ||
Williamson TH, Harris A. Color Doppler ultrasound imaging of the eye and orbit. Surv Ophthalmol. 1996;40:255–267. | ||
Williamson TH, Lowe GDO, Baxter GM. Influence of age, systolic blood pressure, smoking, and blood viscosity on orbital blood velocities. Br J Ophthalmol. 1995;79:17–22. | ||
Greenfield DS, Heggerick PA, Hedges TR 3rd. Color Doppler imaging of normal orbital vasculature. Ophthalmology. 1995;102:1598–1605. | ||
Harris A, Harris M, Biller J, et al. Aging affects the retrobulbar circulation differently in women and men. Arch Ophthalmol. 2000;118:1076–1080. | ||
Cogan DG, Kuwabara T. Capillary shunts in the pathogenesis of diabetic retinopathy. Diabetes. 1963;12:293–300. | ||
Cunha-Vaz JG. Diabetic retinopathy: human and experimental studies. Trans Ophthalmol Soc UK. 1972;92:111–124. |
 © 2014 The Author(s). This work is published and licensed by Dove Medical Press Limited. The full terms of this license are available at https://www.dovepress.com/terms.php and incorporate the Creative Commons Attribution - Non Commercial (unported, v3.0) License.
By accessing the work you hereby accept the Terms. Non-commercial uses of the work are permitted without any further permission from Dove Medical Press Limited, provided the work is properly attributed. For permission for commercial use of this work, please see paragraphs 4.2 and 5 of our Terms.
© 2014 The Author(s). This work is published and licensed by Dove Medical Press Limited. The full terms of this license are available at https://www.dovepress.com/terms.php and incorporate the Creative Commons Attribution - Non Commercial (unported, v3.0) License.
By accessing the work you hereby accept the Terms. Non-commercial uses of the work are permitted without any further permission from Dove Medical Press Limited, provided the work is properly attributed. For permission for commercial use of this work, please see paragraphs 4.2 and 5 of our Terms.