")
Back to Journals » Neuropsychiatric Disease and Treatment » Volume 17
Retinal Imaging Techniques Based on Machine Learning Models in Recognition and Prediction of Mild Cognitive Impairment
Authors Zhang Q, Li J, Bian M, He Q, Shen Y, Lan Y, Huang D
Received 11 August 2021
Accepted for publication 27 October 2021
Published 6 November 2021 Volume 2021:17 Pages 3267—3281
DOI https://doi.org/10.2147/NDT.S333833
Checked for plagiarism Yes
Review by Single anonymous peer review
Peer reviewer comments 2
Editor who approved publication: Dr Taro Kishi
Qian Zhang,1,2,* Jun Li,3,* Minjie Bian,1,2 Qin He,1,2 Yuxian Shen,1,2 Yue Lan,4 Dongfeng Huang1,2
1Department of Rehabilitation Medicine, The Seventh Affiliated Hospital, Sun Yat-sen University, Shenzhen, People’s Republic of China; 2Guangdong Engineering and Technology Research Center for Rehabilitation Medicine and Translation, Guangzhou, People’s Republic of China; 3Department of Urology, Kidney and Urology Center, The Seventh Affiliated Hospital, Sun Yat-sen University, Shenzhen, People’s Republic of China; 4Department of Rehabilitation Medicine, Guangzhou First People’s Hospital, Guangzhou Medical University, Guangzhou, People’s Republic of China
*These authors contributed equally to this work
Correspondence: Yue Lan
Department of Rehabilitation Medicine, Guangzhou First People’s Hospital, Guangzhou Medical University, 151 Yanjiang Road, Guangzhou, 510030, People’s Republic of China
Tel +86-18988991916
Email [email protected]
Dongfeng Huang
Department of Rehabilitation Medicine, The Seventh Affiliated Hospital, Sun Yat-sen University, 628 Zhenyuan Road, Shenzhen, 518107, People’s Republic of China
Tel +86-13322800919
Fax +86-0755-81206511
Email [email protected]
Background and Purpose: Mild Cognitive Impairment (MCI) is thought to be the signal of many progressive diseases but is easily ignored. Therefore, a simple and easy screening method for recognizing and predicting MCI is urgently needed. The study aimed to establish machine learning models of retinal vascular features to categorize and predict MCI.
Patients and Methods: Subjects enrolled underwent cognitive function assessment and were divided into a normal group, an MCI group, and a dementia group, and fundus photography was performed. MATLAB 2019b was used for fundus image preprocessing and vascular segmentation. Via the Green channel, adaptive histogram equalization (AHE), image binarization, and median filtering, we obtained the original and segmentation retinal vessel images. Afterwards, the histogram of oriented gradient (HOG) was used for image feature extraction. Support vector machine (SVM) and extreme learning machine (ELM) were selected for training models in the fundus original images and fundus vascular segmentation images, respectively. Among the three cognitive groups, sensitivity, specificity, the receiver operating characteristic (ROC) curves, and the area under the curve (AUC) were used to evaluate and compare the predictive performance of the two models in the fundus original and vascular segmentation images, respectively.
Results: A total of 86 eligible subjects were enrolled in the study. After a clinical cognitive assessment, the participants were divided into the normal group (N = 38), the MCI group (N = 26), and the dementia group (N = 22). A total of 332 qualified fundus images were adopted after screening. Comparing the models among the three groups showed that the SVM model had more advantages than the ELM model in the fundus original images and vascular segmentation images. Meanwhile, we found that the original images performed better than the segmentation images in the same prediction model. Among the three groups, the SVM model of the fundus original images had the best performance.
Conclusion: The establishment of a predictive model based on vascular-related feature extraction from fundus images has high recognition and prediction abilities for cognitive function and can be used as a screening method for MCI.
Clinical Trial Registration: ChiCTR.org.cn (ChiCTR1900027404), Registered on Nov 12, 2019.
Keywords: retinal imaging techniques, mild cognitive impairment, machine learning, support vector machine, extreme learning machine
Introduction
Mild Cognitive Impairment
With the ageing of the population, the number of people with mild cognitive impairment (MCI) or dementia is expected to increase. There are over 55 million people worldwide living with dementia in 2020. This number will almost double every 20 years, reaching 78 million in 2030 and 139 million in 2050.1 Such growth will inevitably lead to a substantial increase in the economic and health burden on societies worldwide.
MCI, which is defined by the Diagnostic and Statistical Manual of Mental Disorders 5th Edition (DSM-V), refers to a clinical condition between normal ageing and dementia. Patients have a subjective and objective decline from a previous level of functioning in one or more of the six cognitive domains but their activities of daily living are not significantly affected and the problems are not severe enough to meet the diagnosis criteria for dementia.2 There are more than six main cognitive domains that could be affected potentially, such as learning and memory, complex attention, executive function, language, visuospatial and structural function, and social cognition. These domains are hierarchical in nature, with the bottom referring to more basic sensory and perceptual processes and the top referring to elements of executive functioning and cognitive control. They are not independent of each other and executive functioning exerts control over the utilization of more basic processes. Among the domains, learning and memory is considered to be the most vulnerable.3
In the past, MCI was thought simply to be a “precursor” phase of Alzheimer’s disease (AD).4,5 Current research has shown that MCI is not synonymous with AD and does not always progress to dementia; fortunately, some patients revert to the range of normal cognition.6 However, there are many diseases known to have a positive association with MCI, such as Parkinson’s disease, cerebrovascular diseases, and Huntington’s disease.7 Initially, these progressive diseases may appear as mild cognitive behavioural impairment, which is easily overlooked. In principle, the diagnosis of MCI is decided on the basis of clinical judgment whether the patients are absence or presence of cognitive impairment. Afterwards, specialists conduct the comprehensive neuropsychological test that can help to diagnose MCI and assess impaired cognitive domains further, which should take into account age and education of the patients. Therefore, universal screening for MCI is important to facilitate earlier diagnosis, and potential progression may be prevented or postponed with treating reversible causes and making lifestyle changes. Nowadays, the early diagnosis of MCI has been the focus of the recent research.
Machine Learning
In recent years, machine learning (ML) has become the hot spot in neurocognition study due to great advantages and wide applications in feature training and group classification. ML is an artificial intelligence instrument that predicts future data based on learning data from the past. There are two main types of ML: supervised learning and unsupervised learning. Supervised learning methods, such as neural networks (NNs), support vector machines (SVMs), K-nearest algorithms, linear and logistic regression, and random forest (RF) algorithms, build a model by learning from known classes (labelled training data). In contrast, unsupervised learning methods, including principal component analysis (PCA), are to classify to predict for unknown data (unlabelled training data).8
With advances in ML and computing techniques, developing computerized-aided diagnostics to assist specialists in the diagnosis and prediction of diseases has been recognized as an important area of medical research and development. As a branch of ML, deep learning (DL) is an algorithm of representational learning based on artificial neural networks. Simulating the structure and function of the nervous system of the human brain, DL learns representation information automatically by transforming the input data into multiple levels of abstraction. In the deeply stacked neural network, the output results of the upper neural layer serve as the input data of the next, and the final layer reveals the output diagnostic results. Each neuron in the layer has its own weight for each input connection that represents the strength for the particular connection and the bias value, which allows us to shift the activation function to the neuron with the weighted sum of the inputs and to control the trigger value of the activation function. In order to create the output for the neuron and introduce non-linearity to the neuron decision, one of the activation functions is applied to the neuron output.9 There are several types of deep neural networks, including convolutional neural networks (CNNs) and recurrent neural networks (RNNs). CNNs are known to deal with image data, while RNNs are utilized for sequential input data.
As a clinical decision-making technology, DL can provide decision support to clinicians and improving the accuracy and efficiency of various diagnostic and treatment processes by extracting features directly from the raw data and generate an appropriate model for the target task.10 DL is also frequently applied to improve the sensitivity and specificity of disease detection and surveillance, increase objectivity in clinical decision making, significantly enhance identification and diagnostic imaging, and contribute to a wide range of screening programs.11
Retinal Imaging Techniques
Retinal imaging technique is commonly used in the field of neurology and ophthalmology. Currently, coloured digital imaging technique of retina captured by fundus camera is one of the standard methods to record the vascular appearance of the retina. Fundus vascular morphology can be observed directly by ophthalmoscope. Optical coherence tomography angiography (OCT-A) is a non-invasive imaging technique providing depth-resolved images of blood flow in the retina, choroid, and optic nerve.12 The three methods mentioned above have been applied in the clinical practice.
Literature has indicated that the retina and the central nervous system are homologous. Embryologically, the retina, the epitaxial part of the diencephalon, originates from the neural tube. During early development, the retina has a similar pattern of angiogenesis to the brain.13,14 Meanwhile, the retinal vasculature is the only part of an individual’s cerebral microcirculation that can be directly visualized.15 Therefore, the observation of changes in the retinal vasculature can be used as a window to evaluate the continuous changes in the central microcirculation.
Recently, a growing body of evidence has demonstrated that the nerve fiber and vascular pathologic changes of the retina and brain are significantly correlated.16 The study reported that retinal nerve fiber layer (RNFL) thinning was associated with cingulate cortex atrophy and episodic memory decline in old participants.17 Some evidence has also shown that the RNFL was thinner in the superior quadrant in patients with AD compared to the healthy groups, while the RNFL thickness was not differed significantly in the inferior, nasal, and temporal quadrants.18
In addition to the changes of nerve fiber layer thickness, there is a difference in vascular morphology with cognitive impairment. The researchers found that the arterial dilation and reaction amplitude of retinal vessels were decreased in the AD group in comparison with the control group, and it demonstrated that Alzheimer’s and MCI subjects were characterized by significant impairment of the retinal neurovascular coupling which was inversely correlated with the level of amyloid β in the cerebrospinal fluid.19 Recently, several clinical investigations have attempted to determine whether the retinal vasculature could be an imaging biomarker for cognitive impairment.20,21 They found that the amplitude of retinal venous pulsations correlated negatively with the neocortical Aβ scores while the amplitude of retinal arterial pulsations correlated positively with neocortical Aβ scores. Meanwhile, they also found that the retinal ganglion cell layer (RGCL) thickness was significantly lower in the clinical AD group.22 Studies have also shown that retinal vascular geometry changes, including retinal vascular calibre, retinal vascular tortuosity, retinal vascular fractal dimension,23 and retinal nerve layer thickness,20 are correlated with cognitive impairment.
Changes in the retinal vessels to a certain extent can reflect the extent of a lesion by fundus examination. Clinicians can extract specific features from fundus images to suggest reactions or changes from systemic diseases, such as diabetes, multiple sclerosis, and cognitive impairment, and to assist in making correct diagnoses and treatments.24
Retinal Vessel Segmentation Technology
Machine learning based retinal vessel segmentation technology for fundus images is one of the most important segmentation methods at present and is the basis of clinical auxiliary diagnosis systems and large-scale screening systems.25
Due to the interference of noise sources during image acquisition, transmission and storage, and the characteristics of blood vessels in fundus images, it is difficult to extract and segment blood vessels as areas of interest effectively. In order to extract the vascular components in fundus images and obtain the ideal segmentation effect, the contrast between the blood vessels and the background was increased, the greyscale of the background part of the vasculature consistent was made, and necessary image preprocessing was carried out before vascular segmentation. In the MATLAB environment, blood vessels in fundus image pretreatment technology as well as theoretical analysis and research combined with fundus image backgrounds are studied. Fundus images, by the red, green, and blue (RGB) channels, enhance image contrast, greyscale inversion and enhancement, and image filtering, realize fundus image preprocessing to obtain clear vascular eyeground veins from digital images and enhance vascular characteristics.26 Computer image processing technology is applied to the analysis and processing of coloured fundus images, and the blood vessels of the images are segmented and quantified. This approach greatly improves the utilization of medical resources, which has become an important direction in the research field of computer-aided diagnosis in recent years.
In this study, features from coloured retinal vascular images are extracted and analysed in a comprehensive manner based on ML to identify and predict MCI. This article aims to screen out populations at high risk for MCI as early as possible by ML models, to make clinical diagnoses in time, and to determine effective intervention means, which is of great significance for achieving the secondary prevention goals of early detection, early diagnosis, and early treatment, delaying the progression of the disease, and improving the lives of elderly individuals. Moreover, examining the pathophysiology of the retina in these earliest stages of dementia is scientifically valuable for the development of a screening measure that can be administered by point-of-care clinicians to large populations. It is important for the coming ageing of the population in 2050 as well.
Materials and Methods
Study Design
This study was a cross-sectional study. Eighty-six subjects were recruited from the outpatient department and the inpatient department of rehabilitation medicine at the Seventh Affiliated Hospital of Sun Yat-sen University from November 2019 to August 2020. All participants, between the age of 18 and 80 years, including stroke patients and non-stroke subjects, were provided with written consent for study inclusion and offered information for the case report form (CRF). The exclusion criteria were unstable vital signs, complications with severe chronic diseases which are difficult to complete clinical assessments, and contraindications for completing fundus photography.
The CRF was used to collect the demographic information and the clinical information of the subjects, such as age, sex, and time of education. All enrolled stroke patients conformed to the relevant diagnostic criteria for cerebral infarction and cerebral haemorrhage, which were formulated by MRI or CT examination, and they also completed the internal carotid and vertebral artery ultrasonography and heart ultrasonography simultaneously. Meanwhile, they all underwent cognitive function assessments, including the Mini-Mental State Examination scale (MMSE), Montreal Cognitive Assessment scale (MoCA), Clinical Dementia Rating scale (CDR), Physical Activities of Daily Living (PADL), Instrumental Activities of Daily Living (IADL), and fundus photography.
The study was approved by the ethic committee at the Seventh Affiliated Hospital of Sun Yat-sen University, where all data collection occurred, complies with the principles of the Declaration of Helsinki. The study has been registered in the China Clinical Trial Registry (ChiCTR1900027404).
Cognitive Impairment Grouping
MCI Diagnostic Criteria
In the 11th Revision of the International Classification of Diseases (ICD-11), the World Health Organization (WHO) adopted the definition MCI as ‘mild neurocognitive disorders’.27,28 It includes the following four main points: a) subjective experience of a decline from a previous level of cognitive functioning; b) accompanying objective evidence of impairment in performance on one or more cognitive domains relative to that expected given the individual’s age and general level of intellectual functioning, and that is not sufficiently severe to significantly interfere with independence in the person’s performance of activities of daily living; c) cognitive impairment that is not entirely attributable to normal ageing; and d) cognitive impairment that may be attributable to an underlying disease of the nervous system, a trauma, an infection, or other disease processes affecting specific areas of the brain, to chronic use of specific substances or medications, or to an etiology that may be undetermined. These points align with the DSM-5 diagnostic guidelines as well.2
Criteria for Grouping Cognitive Functions
The subjects were grouped based on the MCI diagnostic criteria and a clinical cognitive scale assessment. According to the clinical experts’ advice and the relative literature for analysis, the subjects who were divided into MCI group met the following requirements: the range of MMSE score was a loss of 3 from normal (normal standard according to educational level: illiterate group >19, primary group >22, junior secondary group and above >26); MoCA scale scores ranged from 19 to 26, the CDR score was 0.5, and PADL and IADL were not apparently abnormal. The rest of the subjects were classified into the normal group or cognitive impairment group.29–31 Afterwards, each cognitive group was divided into a training set and validation set at a ratio of 2:1 according to the random tables.
Personnel Training and Quality Monitoring
Researchers were organized to conduct training of clinical cognition scales before the study began and discussed problems and inconsistent opinions throughout the survey to ensure the identical evaluation criteria. During the evaluation, the investigators introduced the purpose and content of the study for participants and obtained informed consent and signatures from the subjects. Then, each subjects completed all the assessments and fundus photography in the study with the same day. The researchers completed the CRF within one week. Meanwhile, one person in charge and another person as quality controller of the study supervised the research process and controlled the quality of all the research data.
Fundus Image Acquisition, Image Preprocessing and Segmentation
RetiCam 3100, the fully automatic and free mydriatic fundus camera, was used for fundus imaging. Total four fundus images were taken, two of which belong to one eye with their centre on the optic disc and the macula, respectively.
MATLAB 2019b (MathWorks, USA) was used for image preprocessing and segmentation, as presented in Figure 1, via the Green channel, adaptive histogram equalization (AHE), image binarization, and median filtering, to obtain the original and segmentation retinal vessel images. The preprocessed fundus images were randomly horizontally translated, flipped, randomly enlarged, miscut transformed and filled to increase the diversity of the training images. Then, the images were normalized. Finally, the retinal vessel images were inputted for feature extraction and constructed machine learning models.32
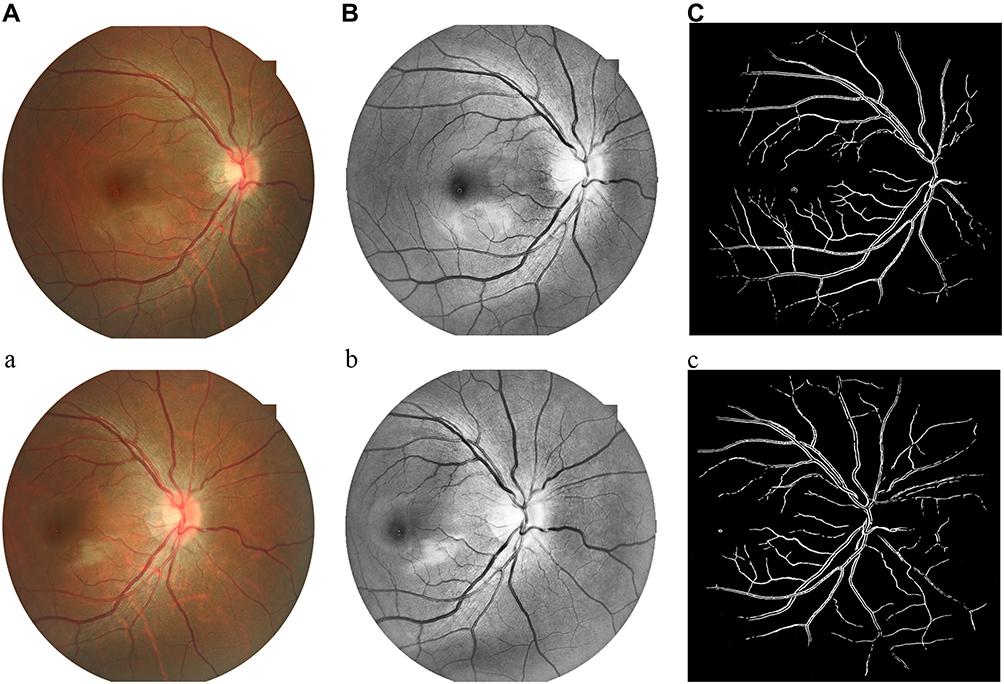 |
Figure 1 Fundus images centred on the macula and optic disc. (A) Original fundus images centred on the macula; (B) adaptive histogram equalization (AHE) fundus images centred on the macula; (C) segmentation fundus images centred on the macula; (a) Original fundus images centred on the optic disc; (b) adaptive histogram equalization (AHE) fundus images centred on the optic disc; (c) segmentation fundus images centred on the optic disc. |
AHE
Histogram equalization (HE) is a commonly used histogram method. The basic idea is to determine a mapping curve through the histogram of the grey distribution of the image, which is used to transform the grey level of the image to achieve the purpose of improving the image contrast. AHE is a computer image processing technique used to improve image contrast. Different from ordinary HE algorithms, the AHE algorithm calculates the local histogram of the image and then redistributes the brightness to change the image contrast.
Median Filtering
Median filtering based on the theory of order statistics of a nonlinear signal processing technology can effectively restrain noise, and it is the basic principle of the digital image or the value of the point in the sequence in which the values at various points in the field of a median instead. Then, the surrounding pixel values close to the real value are ordered to remove isolated noise points.
Extract Image Features and Train Machine Learning Models
Model Selection
The support vector machine (SVM) is a general type of feedforward network that is mainly used to solve the problem of data classification in pattern recognition fields. The SVM is based on nonlinear mapping theory to find the optimal hyperplane of feature space division to help in finding the key samples and eliminating the redundant samples with good robustness.33
Extreme learning machines (ELM) are learning algorithms for solving a single hidden layer feedforward neural network that does not need to adjust the hidden nodes. Its greatest advantage is that it is faster than the traditional learning algorithm on the premise of ensuring the learning accuracy.34
The above two models were selected for training in this study.
Extract Features and Model Training
Extracting image features and training machine learning models were implemented in Python 3.6 with OpenCV. In this study, feature extraction and model training were carried out on the original and segmentation images of fundus images, respectively. The workflow is presented in Figure 2.
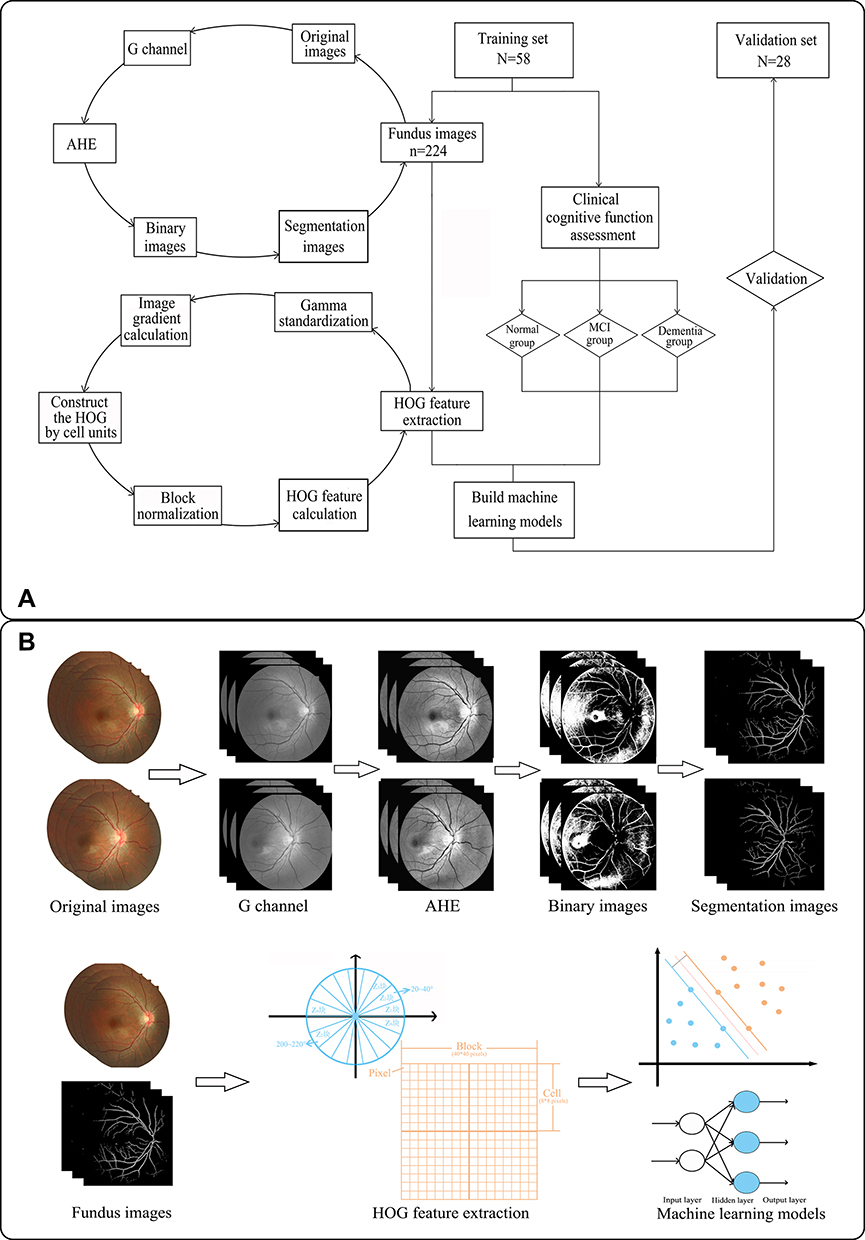 |
Figure 2 The workflow of the study. (A) Flowchart of the study; (B) graphical abstracts of the study. |
The histogram of oriented gradient (HOG) feature is a feature descriptor used for object detection in computer vision and image processing. It calculates and statistically analyses a histogram of gradient direction in the local area of the image to form the feature. The feature extraction process was as follows:
- Gamma standardization: the image was greyed first, and then the gamma space was processed to reduce the sensitivity of the light.
- Image gradient calculation: the gradient of the abscissa and ordinate directions of the image was calculated, and the gradient direction value of each pixel position was calculated accordingly. The derivation not only can capture contours and some textural information but also further attenuate the effect of lighting.
- Histogram of gradient direction construction by cell units: the images were divided into multiple cell units of the same size, the gradient direction was divided into 9 bins, and the interval of each direction was 0–20 degrees.
- Block normalization: the cells were grouped into large, spatially connected sections. In this way, the feature vectors of the cells within a block were connected in series to obtain the HOG feature of the block. The gradient intensity varied over a wide range due to local variations in illumination and variations in the foreground-background contrast. Therefore, this required the normalization of the gradient intensity.
- HOG feature calculation: the last step was to collect all overlapping blocks in the detection window for HOG feature collection and combine them into the final feature vector for classification.
In this paper, the size of the normalized image was 80×80 pixels, the size of the block area was 40×40 pixels, the size of each cell was 8×8 pixels, and the pixel with sliding step length was 8×8 pixels. The gradient direction was divided into 9 bins. That is, the number of eigenvectors was [(80–8)/8+1]2*(2*2) *9=3600. Finally, the feature vector was input into the model for training as well as self-verification and verification.
Statistical Analysis
Python 3.6 was used for data processing. The result of the machine learning models was estimated using a ten-fold cross-validation approach. The receiver operating characteristic (ROC) curves of sensitivity and specificity and the area under the curve (AUC) were evaluated to identify and predict impaired cognitive function. Sensitivity was used to describe the proportion of actual cognitive impairment and judged as positive (sensitivity = true positive/(true positive + false negative)), and specificity was used to describe the proportion of actual non-cognitive impairment and judged as negative (specificity = true negative/(true negative + false positive)). This paper compared the sensitivity, specificity and AUC of the original retinal vascular fundus images and segmentation images for classifying and predicting cognitive impairment and compared the classification effects of different machine learning models. A two-sided t-test was used for statistical analysis, and P < 0.05 was considered statistically significant.
Results
Demographic Characteristics
A total of 86 eligible subjects were included in the study, with an average age of 46.37 ± 1.79 years. Of these patients, the following cases were noted: 25 with cerebral infarction, 13 with cerebral hemorrhage, and 48 with non-stroke subjects. After comprehensive cognitive assessment, the participants were divided into a normal group (N = 38), an MCI group (N = 26), and a dementia group (N = 22), and then each group was randomly divided into a training set and a validation set, as shown in Table 1. Significant differences were observed among the three groups in terms of age, educational status, MMSE, MoCA, CDR, PADL and IADL, but not sex. A total of 332 qualified fundus images were adopted after screening. Twelve images were removed due to poor exposure, over-exposure, blurriness, or out-of-focus.
 |
Table 1 Baseline Characteristics of the Training and Validation Sets |
Comparison of Each Cognitive Function Group Based on Models and the Fundus Original and Vascular Segmentation Images
The fundus original and vascular segmentation images of each group were selected to establish the SVM and ELM models, respectively. The model was self-validated and validated apart in the training set and validation set. The sensitivity, specificity and AUC results are shown in Table 2 and Figure 3.
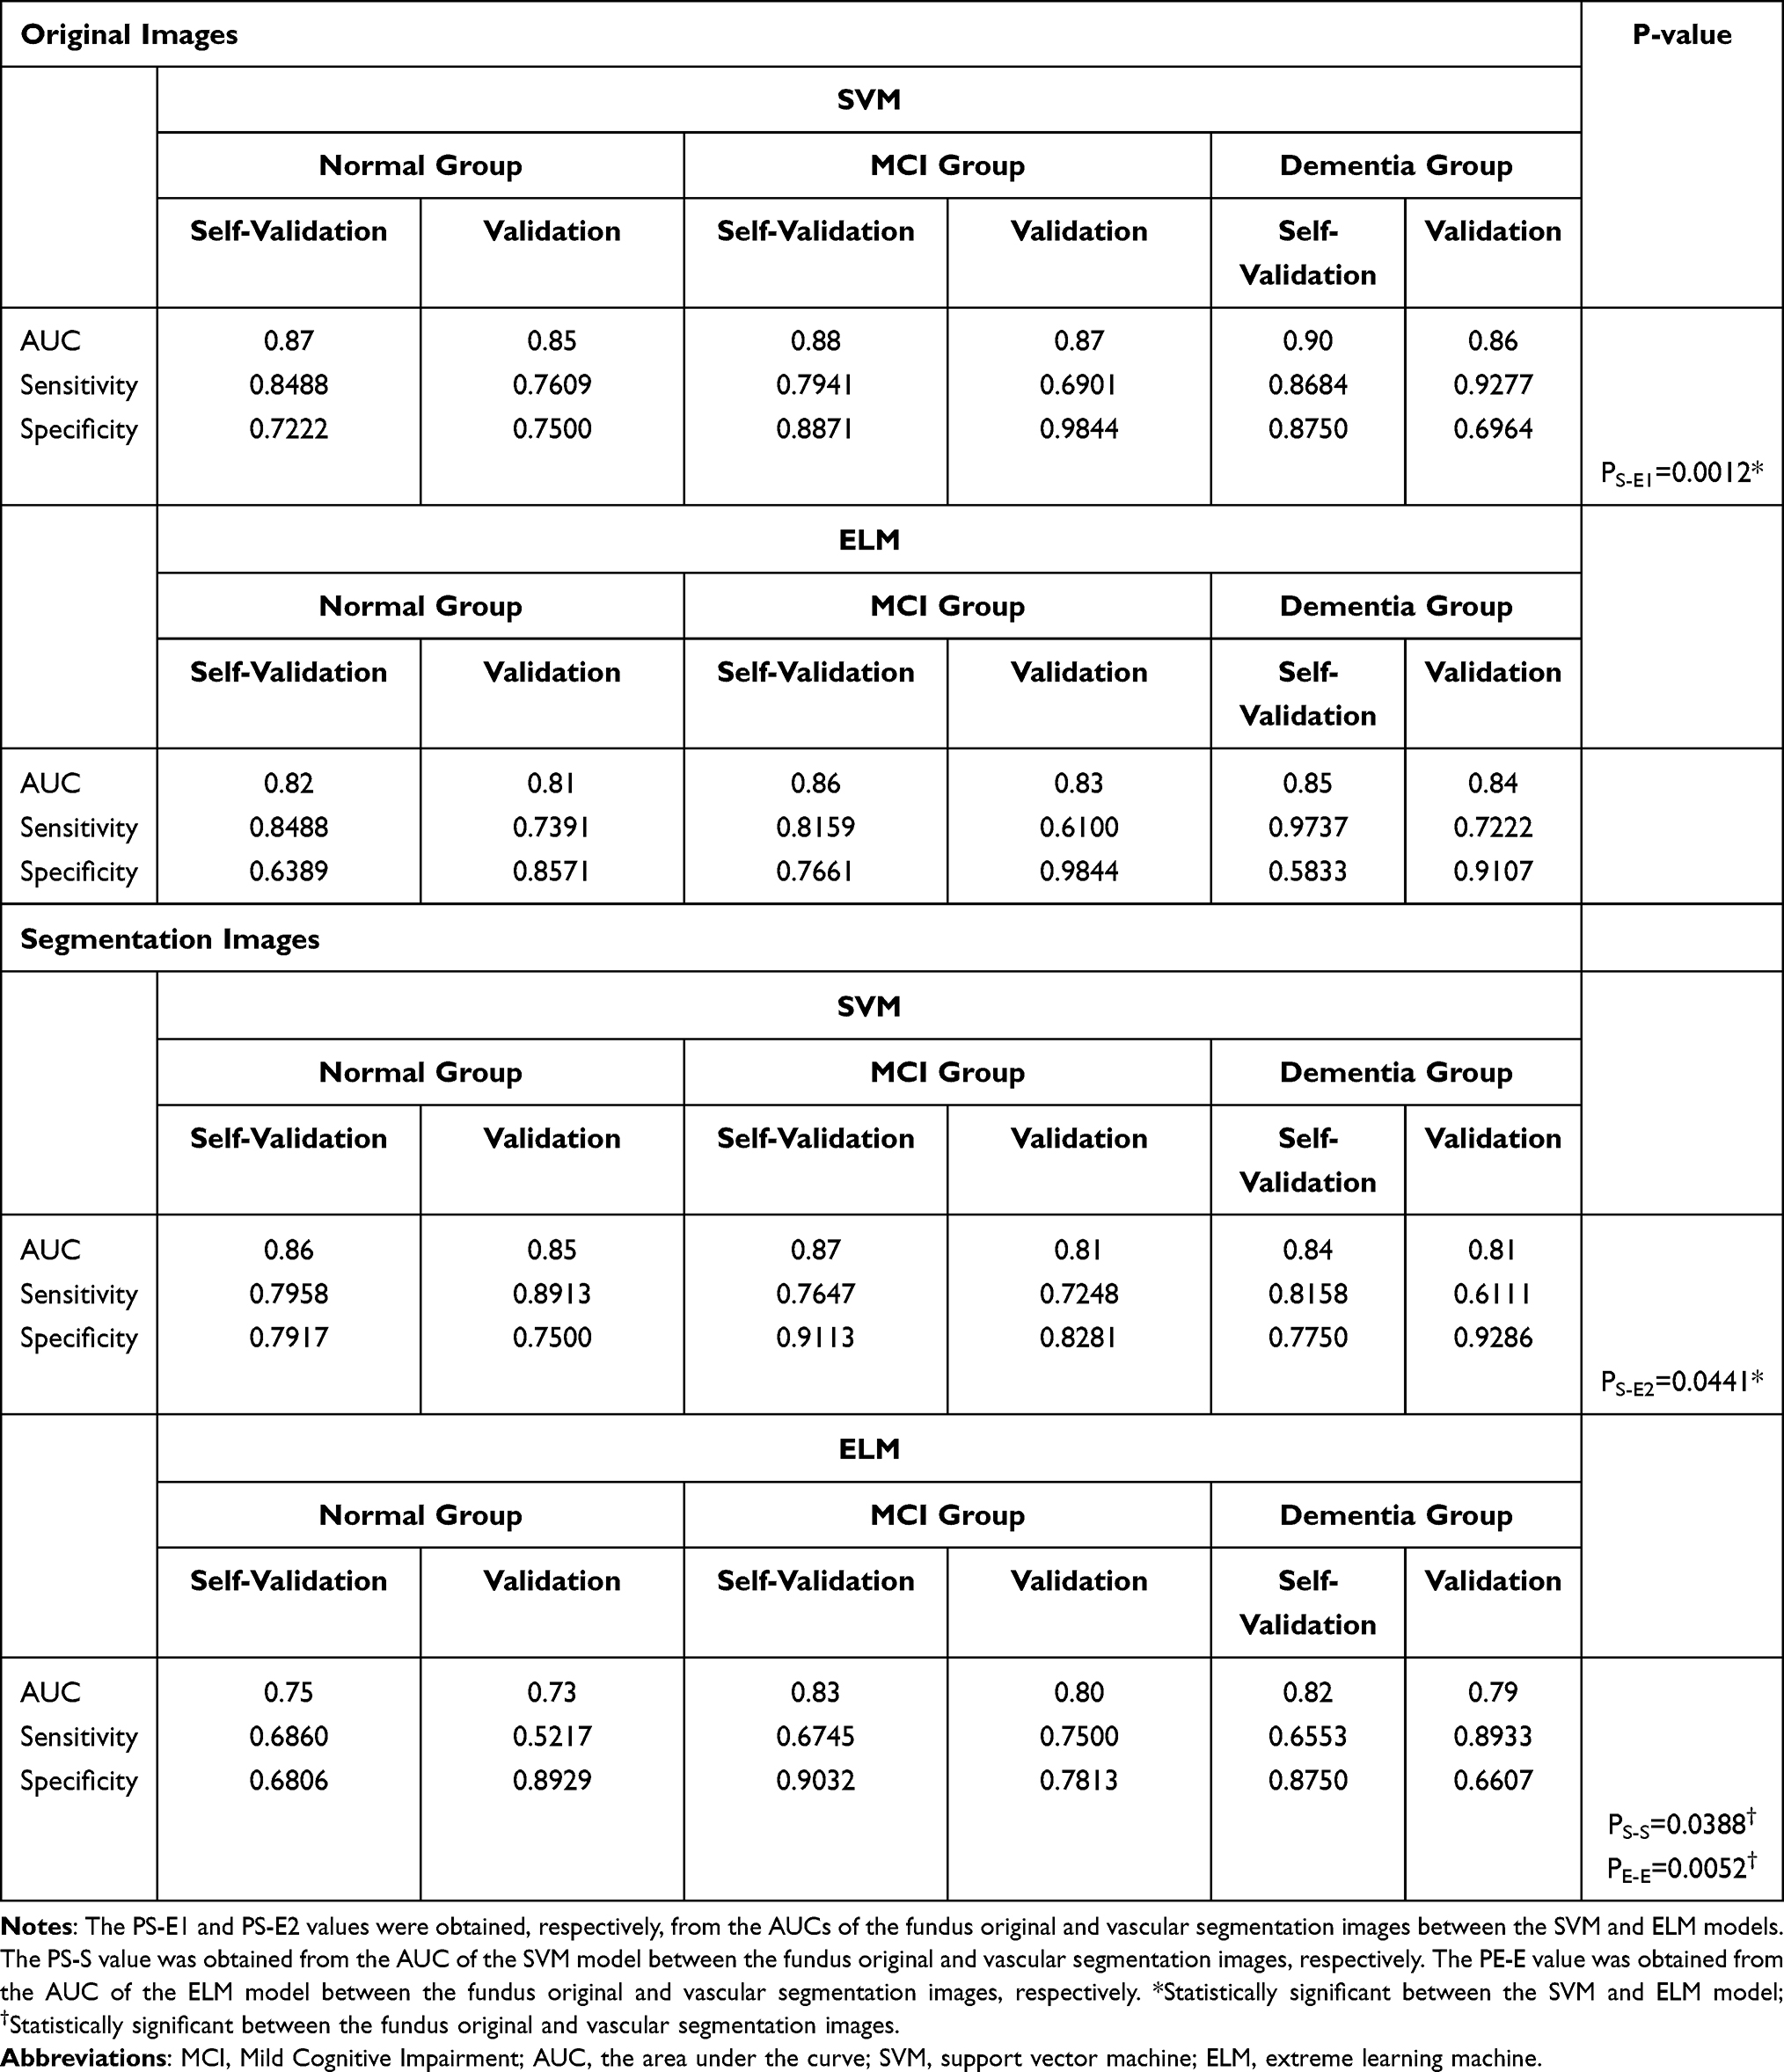 |
Table 2 Sensitivity, Specificity and AUC for the SVM and ELM Models of the Fundus Original and Vascular Segmentation Images |
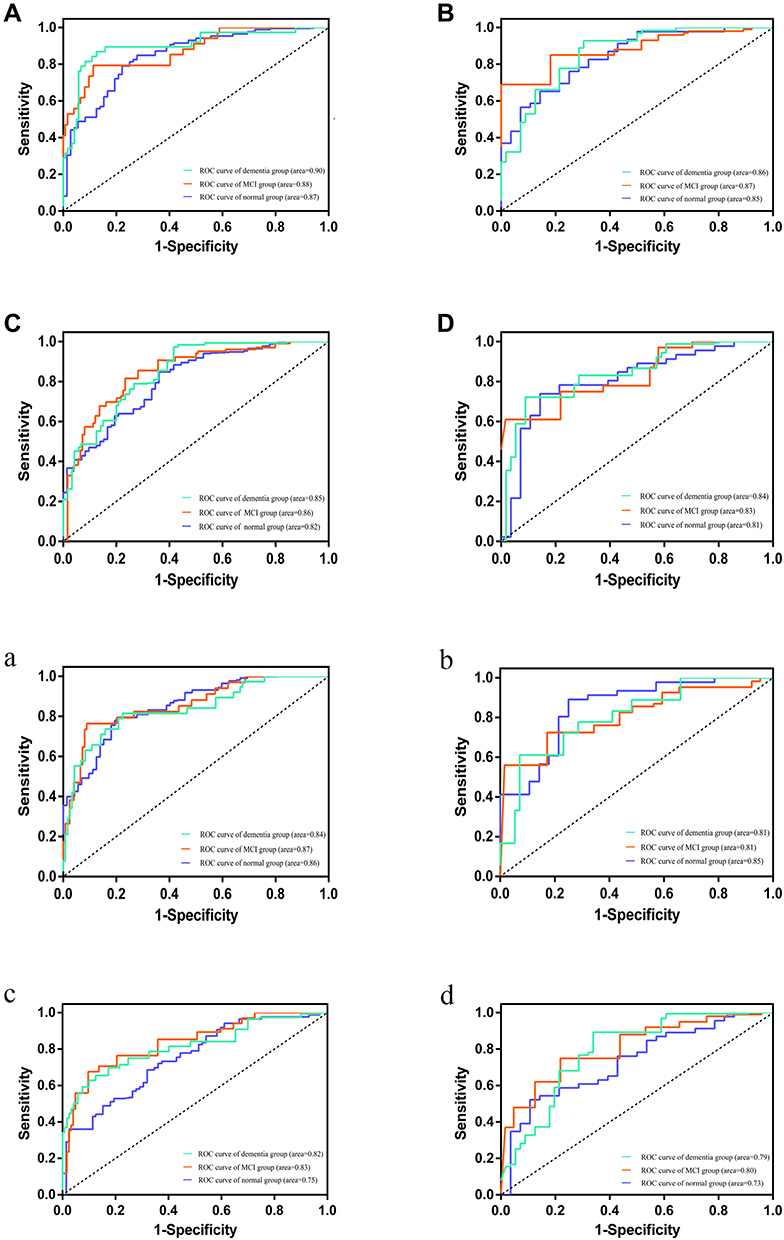 |
Figure 3 The ROC curves and areas under the curve for the SVM and ELM models of the fundus original and segmentation images in the training set and validation set. (A) The ROC curve and area under the curve for the SVM model of the fundus original images in the training set; (B) the ROC curve and area under the curve for the SVM model of the fundus original images in the validation set; (C) the ROC curve and area under the curve for the ELM model of the fundus original images in the training set; (D) the ROC curve and area under the curve for the ELM model of the fundus original images in the validation set; (a) The ROC curve and area under the curve for the SVM model of the fundus segmentation images in the training set; (b) the ROC curve and area under the curve for the SVM model of the fundus segmentation images in the validation set; (c) the ROC curve and area under the curve for the ELM model of the fundus segmentation images in the training set; (d) the ROC curve and area under the curve for the ELM model of the fundus segmentation images in the validation set. |
In the fundus original images, the AUCs of the SVM model were 0.85, 0.87, and 0.86 for the normal group, MCI group, and dementia group, while the AUCs of the ELM model were 0.81, 0.83, and 0.84, suggesting that the fundus original vascular images achieved good predictive efficacy. Meanwhile, the AUCs of the fundus original images between the SVM and ELM models among three groups were compared, and the results showed that the difference was statistically significant (P = 0.0012), indicating that the SVM model had more advantages than the ELM model. Similar results were found in the fundus vascular segmentation images. The AUCs of the SVM model were 0.85, 0.81, and 0.81 for the three groups in the fundus vascular segmentation images, while the AUCs of the ELM model were 0.73, 0.80, and 0.79, suggesting that the fundus vascular segmentation images achieved good predictive efficacy as well. Also, the AUCs of the fundus vascular segmentation images between the two models were compared, and the results showed that the difference was statistically significant (P = 0.0441), demonstrating the SVM model was better than ELM model.
In addition, the fundus original and vascular segmentation images were compared between the same prediction models. For the SVM model, the AUCs of the fundus original images were 0.85, 0.87, and 0.86 for the normal group, MCI group, and dementia group, while the AUCs of the segmentation images were 0.85, 0.81, and 0.81, and the results showed that the difference was statistically significant (P = 0.0388), suggesting the fundus original images performed better than the vascular segmentation images. For the ELM model, the results indicated that the difference was statistically significant (P = 0.0052), suggesting the fundus original images performed better than the vascular segmentation images as well. In the fundus original images, the AUCs of the SVM model in the above three groups were 0.87, 0.88 and 0.90 in the training set and 0.85, 0.87, and 0.86 in the validation set, respectively, which was the best performance of all.
Discussion
Episodic memory loss is the most common early manifestation of dementia and is often overlooked. Later, terrain difficulties gradually emerge and are often accompanied by difficulties with multitasking. As the disease continues to progress, cognitive impairment becomes more severe and interferes with activities in daily life. Most dementia patients are identified in the middle and late period often by family members. Disease-modifying treatments that alter the underlying disease pathology or disease course are not yet available.35,36 Therefore, dementia seriously affects the quality of life of patients and their families and increases the social burden. At present, some studies have shown that early intervention, such as cognitive function training,37 motor function training38 and psychological and behavioural intervention,39 in patients with MCI can delay or prevent the progression of cognitive impairment and can even promote a reversion to a normal cognitive state in some patients. Therefore, early prediction and diagnosis of dementia is important for clinical decision-making and the prognosis of patients.
There are many clinical instruments available to screen for cognitive dysfunction. There are clinical assessments that follow the DSM-V criteria for specific tests in six cognitive domains, including learning and memory, language, executive function, complex attention, and social cognition. However, different environmental conditions, time periods, and qualified evaluators require specific tools to screen for cognitive impairment. The MMSE40 is still the most widely used in screening dementia, and the MoCA41 has better performance than the other dementia screening tests for MCI. Additionally, neuropsychological assessments,42 which include six main cognitive domains, may predict preclinical diseases, such as AD. Recently, various neuroimaging technologies, including structural magnetic resonance imaging (MRI), diffusion tensor imaging (DTI), arterial spin labelling (ASL), magnetic resonance spectroscopy (MRS), functional MRI (fMRI), and positron emission tomography (PET), have emerged and been applied in clinical practice. There is also growing evidence supporting the validity of MRI as a biomarker for MCI and dementia. Early identification and diagnosis of MCI or dementia can be achieved by detecting tau protein aggregation sites, atrophy of the temporal lobe and hippocampus, and changes in blood flow and metabolism.43,44 However, most clinical assessments of cognitive function are based on medical knowledge and MRI techniques are often used in hospitals. With the increasing degree of global ageing, it is difficult to effectively carry out large-scale screening.
Fundus photography is simple and easy to perform, cost-effective, and most hospitals have gradually included it in physical examination programs or popularized it in social health programs. In this study, a machine learning intelligent diagnostic model was combined with fundus photography technology based on the theoretical basis of the homology of retinal blood vessels and cerebral blood vessels during embryonic development. By extracting the features of blood vessels from the fundus images, we attempted to establish a prediction model to screen people at high risk of cognitive impairment. The study found that the models based on the vascular features of the fundus images had good recognition and prediction ability, and the normal group, the MCI group, and the dementia group showed good calibration and discrimination ability in the self-verification and verification set as well. Therefore, clinicians could refer to the predicted results and the patient’s situation to perform further targeted evaluation or examination as well as targeted cognitive function training.
In the fundus original and vascular segmentation images, we found that the SVM model had more advantages than the ELM model. Moreover, compared to fundus vascular segmentation images, we found that the original images had a better ability to recognize and predict cognitive impairment for the same prediction model. In this paper, taking monocular fundus photos centred on optic disc and the macula allowed us to extract vascular features from different angles and in a larger range, avoiding the loss of vascular information. The AHE algorithm and median filtering method used in this study for segmentation were more suitable for improving the local contrast of the image to obtain more image details and for removing noise to protect the edge of the signal from being blurred. Additionally, the method of pedestrian detection based on HOG feature combined with SVM classifiers was first proposed by French researcher Dalal in CVPR in 2005. Now, it has been widely and successfully used in image recognition, especially in pedestrian detection. Because quantization of position and direction space by the HOG algorithm can suppress the influence of translation and rotation to a certain extent and normalize it to offset the changes brought by illumination, the HOG algorithm was applied to extract features in this study. Compared with the segmentation images, original images performed better in the prediction of MCI, this result indicated that some information in the picture may be lost in the process of image segmentation. Alternatively, we need to expand the sample size further and improve image segmentation techniques and the performance of the models to verify this result.
Furthermore, there are some inconsistencies in the choice of cognitive assessment scales in the studies. MMSE is the most widely applied test for cognitive function screening throughout decades. However, it has been shown inadequate to detect MCI and clinical signs of dementia because of its ceiling effect.45 Then, MoCA was developed by Nasreddine et al in 2005 and has been shown to be a highly capable tracking tool for the recognition of normal cognitive function, MCI, and early-onset dementia. The sensitivity of MoCA to identify MCI was 90%, which is superior to MMSE when evaluating patients with MCI.30 But some studies have demonstrated that MoCA is not better than MMSE.46 Consequently, there is no consensus on which tool is more accurate in detecting cognitive function decline. CDR is a global assessment tool to evaluate both cognition and function. Also, it is a highly effective clinically based interview to distinguish between cognitive and functional decline in the spectrum of AD. In general, a CDR score of 0.5 is considered to be the definition of MCI.47 Studies have consistently shown that ADL is impaired in patients with cognitive impairment. Therefore, the impact of cognitive impairment on ADL, especially IADL, is being used as a criterion to distinguish between MCI and dementia.48 Combining with diagnostic criteria for MCI based on ICD-11, we used MMSE, MOCA, CDR, PADL, and IADL to comprehensively evaluate the cognitive and functional status of subjects, and then classified into a normal group, an MCI group, and a dementia group.
There are several limitations to our study that may represent a direction for further research. One important limitation is the lack of external validation for the model. To obtain a high level of clinical application evidence, multicentre validation with a larger sample size is needed. In addition, the studies showed that blood sugar,49 blood pressure,50 and language51 are associated with cognitive function. Whether those factors had good recognition and predictive ability for MCI, or whether they could improve the predictive performance of the model in combination with fundus vessel features, requires further exploration. Moreover, different diseases and different subtypes of the stroke may lead to different degrees and domains of cognitive impairment. In order to improve the early recognition and prediction of cognitive impairment in different diseases and different types of the same disease, further research on a large sample size is needed.
Conclusion
In the study, the establishment of a predictive model based on vascular-related feature extraction from fundus images by machine learning has high recognition and prediction abilities for cognitive function and can be used as a screening method for MCI. In conclusion, we believe this study gives a preliminary conclusion and provides a basis for further research in this field. Compared with the cognitive function assessment and imaging examination commonly used in clinical screening and diagnosis of dementia, the predictive model has greater advantages in operation and implementation, and is more suitable as a screening method for MCI or dementia in the community or physical examination centres. In future research, we will conduct a larger sample size study in multiple centres and try a variety of image segmentation and feature extraction methods to improve the recognition ability. In the process of further research, the performance of the prediction model will decline due to different factors, such as equipment and region. How to train the model with more stable and better performance through the transfer learning method is our next research direction.
Data Sharing Statement
We are willing to share all individual deidentified participant data related to the article, including the data of models, the datasets of the fundus images, the Case Report Form (CRF), and so on. The data of the SVM and ELM models are within the manuscript. The datasets of the fundus images will be uploaded to the public repository after the clinical trial is completed within six months for further analysis for other researchers. The data are available on request from the corresponding author (Dongfeng Huang, E-mail: [email protected]) and the first author (Qian Zhang, E-mail: [email protected]).
Ethics
The study was approved by the ethic committee at the Seventh Affiliated Hospital of Sun Yat-sen University, where all data collection occurred, complies with the principles of the Declaration of Helsinki. The study has been registered in the China Clinical Trial Registry (ChiCTR1900027404).
Acknowledgments
This study was supported by the Sun Yat-Sen University Clinical Research 5010 (Grant Number: 2014001).
Author Contributions
All authors contributed to data analysis, drafting or revising the article, have agreed on the journal to which the article will be submitted, gave final approval of the version to be published, and agree to be accountable for all aspects of the work.
Disclosure
The authors declare that they have no conflicts of interest.
References
1. Alzheimer’s Disease International [homepage on the Internet]; 2021. Available from: https://www.alzint.org/about/dementia-facts-figures/dementia-statistics.
2. Nemeroff CB, Weinberger D, Rutter M, et al. DSM-5: a collection of psychiatrist views on the changes, controversies, and future directions. BMC Med. 2013;11:202. doi:10.1186/1741-7015-11-202
3. Harvey PD. Domains of cognition and their assessment. Dialogues Clin Neurosci. 2019;21(3):227–237.
4. Morris JC. Mild cognitive impairment is early-stage Alzheimer disease: time to revise diagnostic criteria. Arch Neurol. 2006;63:15–16. doi:10.1001/archneur.63.1.15
5. Fiorini R, Luzzi S, Vignini A. Perspectives on mild cognitive impairment as a precursor of Alzheimer’s disease. Neural Regen Res. 2020;15(11):2039–2040. doi:10.4103/1673-5374.282256
6. Sanford AM. Mild cognitive impairment. Clin Geriatr Med. 2017;33(3):325–337. doi:10.1016/j.cger.2017.02.005
7. Sachdev PS, Blacker D, Blazer DG, et al. Classifying neurocognitive disorders: the DSM-5 approach. Nat Rev Neurol. 2014;10(11):634–642. doi:10.1038/nrneurol.2014.181
8. Deo RC. Machine learning in medicine. Circulation. 2015;132(20):1920–1930. doi:10.1161/CIRCULATIONAHA.115.001593
9. Kalmet PHS, Sanduleanu S, Primakov S, et al. Deep learning in fracture detection: a narrative review. Acta Orthop. 2020;91(2):215–220. doi:10.1080/17453674.2019.1711323
10. LeCun Y, Bengio Y, Hinton G. Deep learning. Nature. 2015;521(7553):436–444. doi:10.1038/nature14539
11. Anwar SM, Majid M, Qayyum A, Awais M, Alnowami M, Khan MK. Medical image analysis using convolutional neural networks: a review. J Med Syst. 2018;42(11):226. doi:10.1007/s10916-018-1088-1
12. Pellegrini M, Vagge A, Ferro Desideri LF, et al. Optical coherence tomography angiography in neurodegenerative disorders. J Clin Med. 2020;9(6):1706. doi:10.3390/jcm9061706
13. Risau W. Mechanisms of angiogenesis. Nature. 1997;386(6626):671–674. doi:10.1038/386671a0
14. Dorrell MI, Aguilar E, Friedlander M. Retinal vascular development is mediated by endothelial filopodia, a preexisting astrocytic template and specific R-cadherin adhesion. Invest Ophthalmol Vis Sci. 2002;43(11):3500–3510.
15. Heringa SM, Bouvy WH, van den Berg E, Moll AC, Kappelle LJ, Biessels GJ. Associations between retinal microvascular changes and dementia, cognitive functioning, and brain imaging abnormalities: a systematic review. J Cereb Blood Flow Metab. 2013;33(7):983–995. doi:10.1038/jcbfm.2013.58
16. Zhang Y, Wang Y, Shi C, Shen M, Lu F. Advances in retina imaging as potential biomarkers for early diagnosis of Alzheimer’s disease. Transl Neurodegener. 2021;10(1):6. doi:10.1186/s40035-021-00230-9
17. Shi Z, Zheng H, Hu J, et al. Retinal nerve fiber layer thinning is associated with brain atrophy: a longitudinal study in nondemented older adults. Front Aging Neurosci. 2019;11:69. doi:10.3389/fnagi.2019.00069
18. Kwon JY, Yang JH, Han JS, Kim DG. Analysis of the retinal nerve fiber layer thickness in Alzheimer disease and mild cognitive impairment. Korean J Ophthalmol. 2017;31(6):548–556. doi:10.3341/kjo.2016.0118
19. Querques G, Borrelli E, Sacconi R, et al. Functional and morphological changes of the retinal vessels in Alzheimer’s disease and mild cognitive impairment. Sci Rep. 2019;9(1):63. doi:10.1038/s41598-018-37271-6
20. Chan VTT, Sun Z, Tang S, et al. Spectral-domain OCT measurements in Alzheimer’s disease: a systematic review and meta-analysis. Ophthalmology. 2019;126(4):497–510. doi:10.1016/j.ophtha.2018.08.009
21. Cheung CY, Chan VTT, Mok VC, Chen C, Wong TY. Potential retinal biomarkers for dementia: what is new? Curr Opin Neurol. 2019;32(1):82–91. doi:10.1097/WCO.0000000000000645
22. Golzan SM, Goozee K, Georgevsky D, et al. Retinal vascular and structural changes are associated with amyloid burden in the elderly: ophthalmic biomarkers of preclinical Alzheimer’s disease. Alzheimers Res Ther. 2017;9(1):13. doi:10.1186/s13195-017-0239-9
23. Cheung CY, Ong YT, Ikram MK, et al. Microvascular network alterations in the retina of patients with Alzheimer’s disease. Alzheimers Dement. 2014;10(2):135–142. doi:10.1016/j.jalz.2013.06.009
24. Nadal J, Deverdun J, de Champfleur NM, et al. Retinal vascular fractal dimension and cerebral blood flow, a pilot study. Acta Ophthalmol. 2020;98(1):e63–e71. doi:10.1111/aos.14232
25. Srinidhi L, Aparna P, Rajan J. Recent advancements in retinal vessel segmentation. J Med Syst. 2017;41(4):70. doi:10.1007/s10916-017-0719-2
26. Rasta SH, Partovi ME, Seyedarabi H, Javadzadeh A. A comparative study on preprocessing techniques in diabetic retinopathy retinal images: illumination correction and contrast enhancement. J Med Signals Sens. 2015;5(1):40–48. doi:10.4103/2228-7477.150414
27. World Health Organization. International statistical classification of diseases and related health problems (11th Revision); 2018. Available from: https://www.who.int/classifications/icd/en.
28. Kasper S, Bancher C, Eckert A, et al. Management of mild cognitive impairment (MCI): the need for national and international guidelines. World J Biol Psychiatry. 2020;21(8):579–594. doi:10.1080/15622975.2019.1696473
29. Folstein MF, Folstein SE, McHugh PR. “Mini-mental state”. A practical method for grading the cognitive state of patients for the clinician. J Psychiatr Res. 1975;12(3):189–198. doi:10.1016/0022-3956(75)90026-6
30. Nasreddine ZS, Phillips NA, Bédirian V, et al. The Montreal Cognitive Assessment, MoCA: a brief screening tool for mild cognitive impairment. J Am Geriatr Soc. 2005;53(4):695–699. doi:10.1111/j.1532-5415.2005.53221.x
31. Breton A, Casey D, Arnaoutoglou NA. Cognitive tests for the detection of mild cognitive impairment (MCI), the prodromal stage of dementia: meta-analysis of diagnostic accuracy studies. Int J Geriatr Psychiatry. 2019;34(2):233–242. doi:10.1002/gps.5016
32. Lakhani P, Gray DL, Pett CR, Nagy P, Shih G. Hello world deep learning in medical imaging. J Digit Imaging. 2018;31(3):283–289. doi:10.1007/s10278-018-0079-6
33. Noble WS. What is a support vector machine? Nat Biotechnol. 2006;24(12):1565–1567. doi:10.1038/nbt1206-1565
34. Jammoussi I, Ben Nasr M, Hybrid Method A. Based on extreme learning machine and self organizing map for pattern classification. Comput Intell Neurosci. 2020;2020:2918276. doi:10.1155/2020/2918276
35. Mangialasche F, Solomon A, Winblad B, Mecocci P, Kivipelto M. Alzheimer’s disease: clinical trials and drug development. Lancet Neurol. 2010;9(7):702–716. doi:10.1016/S1474-4422(10)70119-8
36. Costandi M. Ways to stop the spread of Alzheimer’s disease. Nature. 2018;559(7715):S16–S17. doi:10.1038/d41586-018-05723-8
37. Gates NJ, Rutjes AW, Di Nisio M, et al. Computerised cognitive training for maintaining cognitive function in cognitively healthy people in midlife. Cochrane Database Syst Rev. 2019;3(3):CD012278.
38. Carrasco-Poyatos M, Rubio-Arias JA, Ballesta-García I, Ramos-Campo DJ. Pilates vs. muscular training in older women. Effects in functional factors and the cognitive interaction: a randomized controlled trial. Physiol Behav. 2019;201:157–164. doi:10.1016/j.physbeh.2018.12.008
39. Robert P, Manera V, Derreumaux A, et al. Efficacy of a web app for cognitive training (MeMo) regarding cognitive and behavioral performance in people with neurocognitive disorders: randomized controlled trial. J Med Internet Res. 2020;22(3):e17167. doi:10.2196/17167
40. Li H, Jia J, Yang Z, Moreau N. Mini-mental state examination in elderly Chinese: a population-based normative study. J Alzheimers Dis. 2016;53(2):487–496. doi:10.3233/JAD-160119
41. Liew TM, Feng L, Gao Q, Ng TP, Yap P. Diagnostic utility of Montreal Cognitive Assessment in the Fifth Edition of Diagnostic and Statistical Manual of Mental Disorders: major and mild neurocognitive disorders. J Am Med Dir Assoc. 2015;16(2):144–148. doi:10.1016/j.jamda.2014.07.021
42. Tosi G, Borsani C, Castiglioni S, Daini R, Franceschi M, Romano D. Complexity in neuropsychological assessments of cognitive impairment: a network analysis approach. Cortex. 2020;124:85–96. doi:10.1016/j.cortex.2019.11.004
43. Chandra A, Dervenoulas G, Politis M. Alzheimer’s disease neuroimaging initiative. magnetic resonance imaging in Alzheimer’s disease and mild cognitive impairment. J Neurol. 2019;266(6):1293–1302. doi:10.1007/s00415-018-9016-3
44. Mamun AA, Uddin MS, Mathew B, Ashraf GM. Toxic tau: structural origins of tau aggregation in Alzheimer’s disease. Neural Regen Res. 2020;15(8):1417–1420. doi:10.4103/1673-5374.274329
45. Tsoi KK, Chan JY, Hirai HW, Wong SY, Kwok TC. Cognitive tests to detect dementia: a systematic review and meta-analysis. JAMA Intern Med. 2015;175(9):1450–1458. doi:10.1001/jamainternmed.2015.2152
46. Zhou S, Zhu J, Zhang N, et al. The influence of education on Chinese version of Montreal cognitive assessment in detecting amnesic mild cognitive impairment among older people in a Beijing rural community. Sci World J. 2014;2014:689456. doi:10.1155/2014/689456
47. Saxton J, Snitz BE, Lopez OL, et al. Functional and cognitive criteria produce different rates of mild cognitive impairment and conversion to dementia. J Neurol Neurosurg Psychiatry. 2009;80(7):737–743. doi:10.1136/jnnp.2008.160705
48. Perneczky R, Pohl C, Sorg C, et al. Complex activities of daily living in mild cognitive impairment: conceptual and diagnostic issues. Age Ageing. 2006;35(3):240–245. doi:10.1093/ageing/afj054
49. Fickweiler W, Wolfson EA, Paniagua SM, et al. Association of cognitive function and retinal neural and vascular structure in type 1 diabetes. J Clin Endocrinol Metab. 2021;106(4):1139–1149. doi:10.1210/clinem/dgaa921
50. Hughes D, Judge C, Murphy R, et al. Association of blood pressure lowering with incident dementia or cognitive impairment: a systematic review and meta-analysis. JAMA. 2020;323(19):1934–1944. doi:10.1001/jama.2020.4249
51. Bidet-Ildei C, Beauprez SA, Boucard G. The link between language and action in aging. Arch Gerontol Geriatr. 2020;90:104099. doi:10.1016/j.archger.2020.104099
 © 2021 The Author(s). This work is published and licensed by Dove Medical Press Limited. The full terms of this license are available at https://www.dovepress.com/terms.php and incorporate the Creative Commons Attribution - Non Commercial (unported, v3.0) License.
By accessing the work you hereby accept the Terms. Non-commercial uses of the work are permitted without any further permission from Dove Medical Press Limited, provided the work is properly attributed. For permission for commercial use of this work, please see paragraphs 4.2 and 5 of our Terms.
© 2021 The Author(s). This work is published and licensed by Dove Medical Press Limited. The full terms of this license are available at https://www.dovepress.com/terms.php and incorporate the Creative Commons Attribution - Non Commercial (unported, v3.0) License.
By accessing the work you hereby accept the Terms. Non-commercial uses of the work are permitted without any further permission from Dove Medical Press Limited, provided the work is properly attributed. For permission for commercial use of this work, please see paragraphs 4.2 and 5 of our Terms.