")
Back to Journals » Diabetes, Metabolic Syndrome and Obesity » Volume 13
Resveratrol Upregulates mmu-miR-363-3p via the PI3K-Akt Pathway to Improve Insulin Resistance Induced by a High-Fat Diet in Mice
Authors Shu L , Zhao H, Huang W, Hou G, Song G, Ma H
Received 3 December 2019
Accepted for publication 24 January 2020
Published 14 February 2020 Volume 2020:13 Pages 391—403
DOI https://doi.org/10.2147/DMSO.S240956
Checked for plagiarism Yes
Review by Single anonymous peer review
Peer reviewer comments 2
Editor who approved publication: Prof. Dr. Antonio Brunetti
Linyi Shu, 1, 2 Hang Zhao, 2 Wenli Huang, 1, 2 Guangsen Hou, 1, 2 Guangyao Song, 1, 2 Huijuan Ma 1–3
1Department of Internal Medicine, Hebei Medical University, Shijiazhuang, Hebei 050017, People’s Republic of China; 2Endocrinology Department, Hebei General Hospital, Shijiazhuang, Hebei 050051, People’s Republic of China; 3Hebei Key Laboratory of Metabolic Diseases, Hebei General Hospital, Shijiazhuang, Hebei 050051, People’s Republic of China
Correspondence: Guangyao Song
Endocrinology Department, Hebei General Hospital, 348, Heping West Road, Shijiazhuang, Hebei 050051, People’s Republic of China
Tel +86 311 8598 8556
Email [email protected]
Purpose: This study aimed to investigate how resveratrol (RSV) improves high-fat diet (HFD)-induced hepatic insulin resistance in mice via microRNA (miRNA) mmu-miR-363-3p in vitro and in vivo.
Materials and Methods: C57BL/6J mice were fed a HFD for 8 weeks to establish an insulin resistance model. The model mice were treated or not with RSV for 6 weeks. Differential miRNA expression in mouse liver tissues was analyzed by high-throughput sequencing. Mouse HepG2 cells were treated with palmitic acid (PA) to establish a cell model of insulin resistance. HepG2 cells were transfected with mmu-miR-363-3p inhibitor or mimic, and the expression of PI3K-Akt signaling pathway-related proteins was analyzed.
Results: Based on the high-throughput sequencing analysis, mmu-miR-363-3p was identified as a major miRNA involved in the action of RSV on insulin resistance. Based on KEGG pathway enrichment analysis, PI3K-Akt signaling was found to be significantly enriched among differentially expressed miRNAs, and this pathway is closely related to insulin resistance. RSV treatment reduced the expression of FOXO1 and G6PC, which are downstream of the PI3K-Akt pathway. In the cell model, mmu-miR-363-3p inhibitor significantly suppressed p-Akt and p-PI3K levels, but enhanced those of FOXO1 and G6PC. In contrast, mmu-miR-363-3p mimic significantly enhanced the p-Akt and p-PI3K levels, but suppressed FOXO1 and G6PC expression, which was similar to the effect of RSV.
Conclusion: RSV improves insulin resistance by upregulating miRNA mmu-miR-363-3p via the PI3K-Akt pathway.
Keywords: insulin resistance, resveratrol, microRNA, high-throughput sequencing, PI3K-Akt pathway
Introduction
The incidence of type 2 diabetes has increased yearly since the last century. The number of adults with type 2 diabetes is expected to rise globally to 590 million by 2035.1 The most prominent feature of type 2 diabetes is insulin resistance, in which the insulin signalling pathway in the liver, fat, skeletal muscle, and other target organs is blocked. As a result, these organs become less sensitive to insulin, and the body cannot effectively use glucose. The liver plays a central role in glycolipid metabolism. Disorders of glucose metabolism can lead to glycogen accumulation in the liver and induce microvascular disease. Lipid metabolism disorders can lead to the formation of fatty liver and liver function impairment.2
Resveratrol is a polyphenolic compound with multiple biological activities. Resveratrol has anti-tumour, anti-oxidative stress, and anti-inflammatory effects, and protective effects on the nervous and cardiovascular systems. In addition, resveratrol counteracts insulin resistance, regulates blood sugar and lipids, and improves diabetes and metabolic syndrome.3
MicroRNAs (miRNAs), which are short-chain (~22 nt) non-coding RNAs, have recently been found to be associated with diabetes and associated signalling pathways.4 The first member of the miRNA family, lin-4,5 was discovered in 1993. There are more than 1400 known miRNAs, each of which can affect the expression of various mRNAs. Each mRNA also contains multiple miRNA-binding sites. miRNAs inhibit translation or target the mRNA for degradation by base-pairing. They play important regulatory roles in various biological processes, including metabolism, proliferation, and differentiation. Therefore, miRNAs can serve as potential targets for the diagnosis and treatment of complex diseases such as diabetes.
MiRNAs and resveratrol reportedly improve hepatic insulin resistance and participate in liver glycolipid metabolism and insulin signalling transduction.6 However, the role of miRNAs in resveratrol-mediated reduction of hepatic insulin resistance has not been studied in detail. In this study, we confirmed the insulin sensitivity-improving effects of resveratrol in the liver and explored the possible involvement of miRNAs in the mechanism of action of resveratrol to provide new ideas for the prevention and treatment of diabetes.
Materials and Methods
Animal Model
Thirty-six male C57BL/6J mice (6 weeks old, 21.0–23.0 g; Beijing Weitong Lihua Experimental Animal Center; license number: SCXK (Beijing) 2016–0006) were housed at the Hebei General Hospital animal laboratory (20–25°C, 40–60% relative humidity, 12-h light/dark cycle, free access to food and water). After 1 week of adaptive feeding, they were divided into two groups: a control group (CON, n = 12) fed a general feed (D12450J: 20% protein, 70% carbohydrate, 10% fat, 3.85 kcal/g) and a high-fat diet group (HFD, n = 24) fed an HFD (D12492: 20% protein, 20% carbohydrate, 60% fat, 5.24 kcal/g). The feeds were purchased from Beijing Huafukang Biotechnology. After 8 weeks of feeding and a 12-h fast, the mice were subjected to intraperitoneal glucose tolerance testing, and the area under the curve was determined to confirm insulin resistance establishment in the HFD group. Then, the HFD group was divided into HFD and HFD plus resveratrol (HFD+RSV) groups (n = 12 each). Thirty milligrams of resveratrol powder (Sigma) was dissolved in 1 mL of dimethyl sulfoxide (DMSO, Sigma) and diluted with a 0.9% sodium chloride solution. Resveratrol (100 mg/kg) was intragastrically administered daily.7 The CON and HFD groups were intragastrically administered 0.1% DMSO in 0.9% sodium chloride daily. After 6 weeks of resveratrol or control treatment, the mice were fasted for 12 h overnight. Three mice randomly selected from each group received 1.5 IU/40 g of insulin (Sigma) intraperitoneally for 20 min before anaesthesia. All mice were euthanized by cervical dislocation and blood was collected by cardiac puncture. The liver was quickly dissected, washed with saline, and a small piece (always from the same leaf) was fixed with 4% paraformaldehyde. The remaining tissue was frozen in liquid nitrogen and stored at –80°C. The experiment was supervised and approved (No. 201920) by the Ethics Committee of the People’s Hospital of Hebei Province and complied with the International Regulations for the Use of Laboratory Animals.
Western Blotting
Total protein was extracted from hepatocytes using RIPA buffer. Protein concentrations were determined using a BCA kit (Thermo Fisher Scientific). Proteins were resolved by SDS-PAGE and then transferred to a PVDF membrane, which was blocked with 5% dry skim milk for 2 h. The membrane was incubated at 4°C overnight with primary antibody diluted to a suitable concentration in blocking solution. The membrane was washed thrice with TBST (10 min each), incubated with secondary antibody at room temperature for 50 min, and washed thrice with TBST (10 min each). Bands were detected using enhanced chemiluminescence reagent (Thermo Fisher Scientific) and a gel imager. Grey values were quantified using ImageJ. β-Actin was used for normalization. The following antibodies were used: mouse anti-β-actin, (1:1000), rabbit anti-protein kinase B (Akt; 1:2000), rabbit anti-p-Akt (Ser 473) (1:1000), rabbit anti-phosphatidylinositol 3-kinase (PI3K; (1:2000), and rabbit anti-p-PI3K (Tyr 458) (1:1000), all of which were purchased from Cell Signaling Technology; rabbit anti-forkhead box transcription factor 1 (FOXO1; (1:1000) and rabbit anti- glucose-6-phosphatase, catalytic subunit (G6PC; 1:2000), which were purchased from Proteintech. HRP-labelled goat anti-rabbit IgG antibody (1:8000) and goat anti-mouse IgG antibody (1:3000) were purchased from Signalway Antibody.
Quantitative Reverse-Transcription Polymerase Chain Reaction (RT-qPCR)
Total RNA was extracted with an RNAsimple Total RNA Kit (TIANGEN) and was reverse-transcribed into cDNA using HiScript II Q RT SuperMix for qPCR. qPCRs were run using SYBR® Premix Ex TaqTM II (RR820A) under the conditions of 95°C for 10 min, followed by 40 cycles of 15 s at 95°C, 15 s at 95°C, and 15 s at 60°C. Melting curves were generated (60–95°C). Target gene expression levels were normalized to the level of β-actin mRNA using the 2–ΔΔCT method.8 Primers used are listed in Table 1.
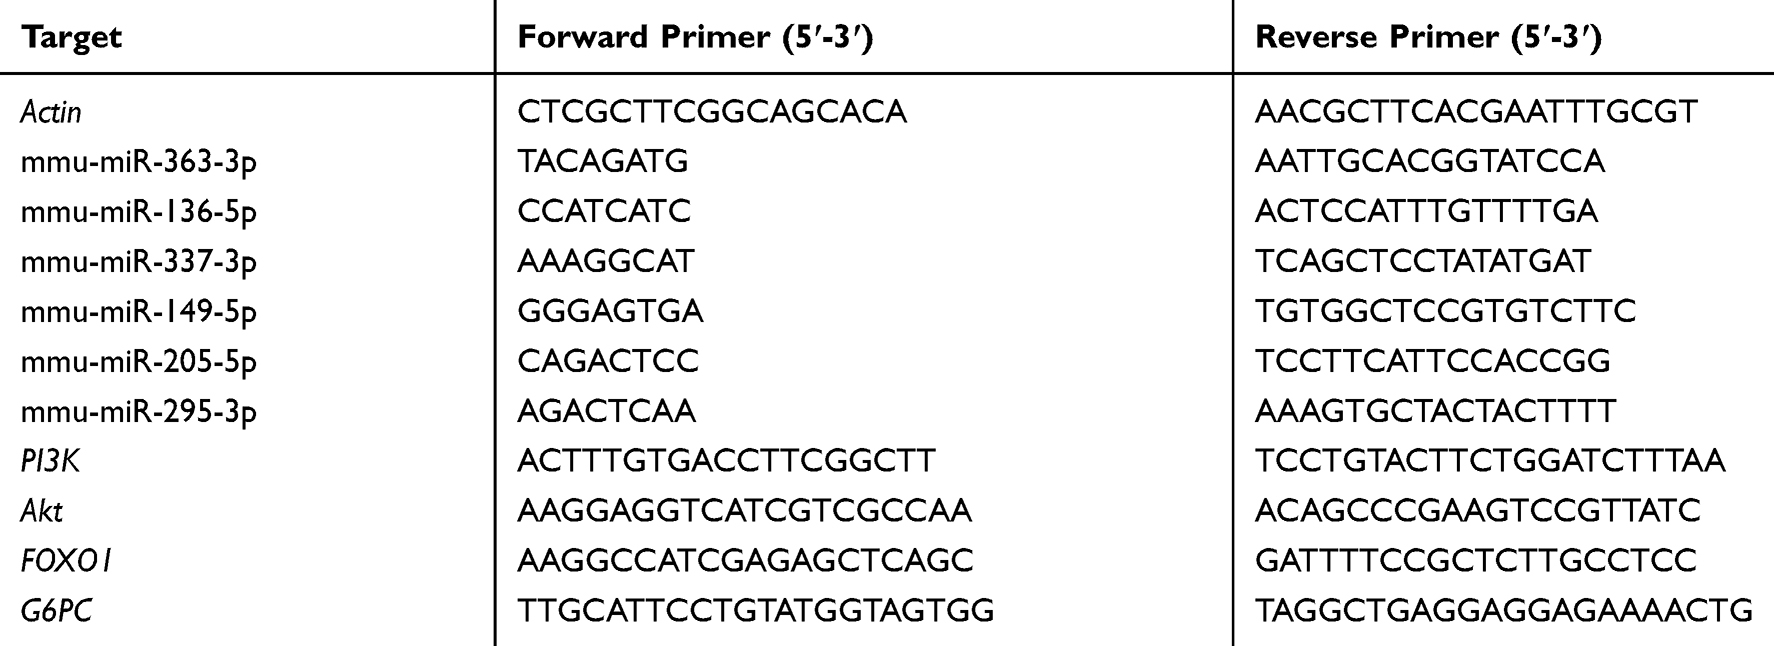 |
Table 1 Primers Used for RT-qPCR |
High-Throughput Sequencing
Total RNA was extracted from four liver samples of each of the CON, HFD, and the +RSV groups using an RNeasy Mini kit (Qiagen). The TruSeqTM RNA Library Prep Kit (Illumina) was used for library construction. Ribosomal RNA was removed using the Ribo-Zero rRNA Removal Kit (Epicentre). mRNA was fragmented with divalent cations. First-strand cDNA was generated using reverse transcriptase and random primers, second-strand cDNA using RNase H DNA polymerase I. A single “A” base was added at the end of the cDNAs and linker sequences were ligated. Purified products were PCR-amplified to generate the final cDNA library. Insert sizes were verified using a Qubit® 2.0 (Life Technologies) and molar concentrations were calculated. Clusters were generated using cBot, diluted to 10 pM, and sequenced on an Illumina NovaSeq 6000. Library construction and sequencing were performed at Shanghai Sinomics.
miRNA Expression Analysis
Clean reads were mapped to miRBase and NCBI piRNA, Rfam, and RepBase to determine differential expression. miRNA expression levels were calculated using counts-per-million normalization. Differential expression was determined using DESeq software and was defined as P ≤ 0.05 and log2(foldchange) ≥ 1.9
Establishment of an in-vitro Cell Model of Insulin Resistance
HepG2 human hepatoma cells were purchased from the National Infrastructure of Cell Line Resource of China and stored at the Clinical Research Center of Hebei General Hospital. The cells were cultured in MEM (Hyclone) containing 10% foetal bovine serum (Hyclone), 1% non-essential amino acids (Gibco) and 1% streptomycin (Hyclone) in the presence of 5% CO2 at 37°C. When the cells reached approximately 80% confluence, they were treated with serum-free medium (CON group) or serum-free medium containing 0.25 mmol/L palmitic acid (PA) to establish insulin resistance (PA group). At 0, 12, and 24 h, the glucose concentration in the medium was measured using a glucose oxidase assay kit (Applygen) to evaluate model establishment.
Cytotoxicity Assessment of Resveratrol
Resveratrol (Sigma-Aldrich) was dissolved in dimethyl sulfoxide (Sigma-Aldrich) at 50 mmol/L. HepG2 cells were cultured in a 96-well plate to 80% confluence. Cells with or without palmitic acid were treated with 0, 12.5, 25, 50, or 100 μM resveratrol. Cell viability was determined using a Cell Counting Kit-8 (Dojindo).
mmu-miR-363-3p Knockdown and PI3K-Akt Overexpression Construct Preparation and Transfection
HepG2 cells were transfected at approximately 60% confluence. A 20-μM RNA oligo stock solution was prepared in siRNA-mate transfection reagent (GenePharma) and DEPC water. Five microliters of RNA oligo stock solution and 10 μL of siRNA-Mate transfection reagent was mixed with 200 μL of OPTI-MEM (Thermo Fisher Scientific). Two-hundred microliters of the transfection complex was added to 1.8 mL of medium; the final concentration of miRNA mimic and inhibitor was 50 nM and 100 nM, respectively. HepG2 cells were transfected with the transfection complexes in 6-well plates at 37°C for 24 h. Then, PA and/or RSV were added to the corresponding groups. After 24 h, part of the cells were stimulated with insulin for 40 min. Proteins were extracted for Western blotting.
Statistical Analysis
All data are expressed as the mean ± standard deviation (SD) and were processed using SPSS 22.0. Normally distributed data were analysed using Student’s t-test for two groups and one-way ANOVA followed by LSD or Tamhane’s tests for multiple groups. Otherwise, the non-parametric test was used. P < 0.05 was considered significant.
Results
Resveratrol Treatment Affects Liver mRNA Expression in HFD Mice
High-throughput sequencing was used to compare miRNA expression in the liver in model mice treated with resveratrol and control model mice. We detected 1089 miRNAs in total, 32 of which were differentially expressed (12 up- and 20 down-regulated) (Table 2). Differential miRNA expression is visualized in the heat map and signal density distribution in the box plot shown in (Figure 1A and B), respectively. Scatter plots and volcano plots can reveal the distribution and approximate number of miRNAs that differ more than twice as much (Figure 1C and D).
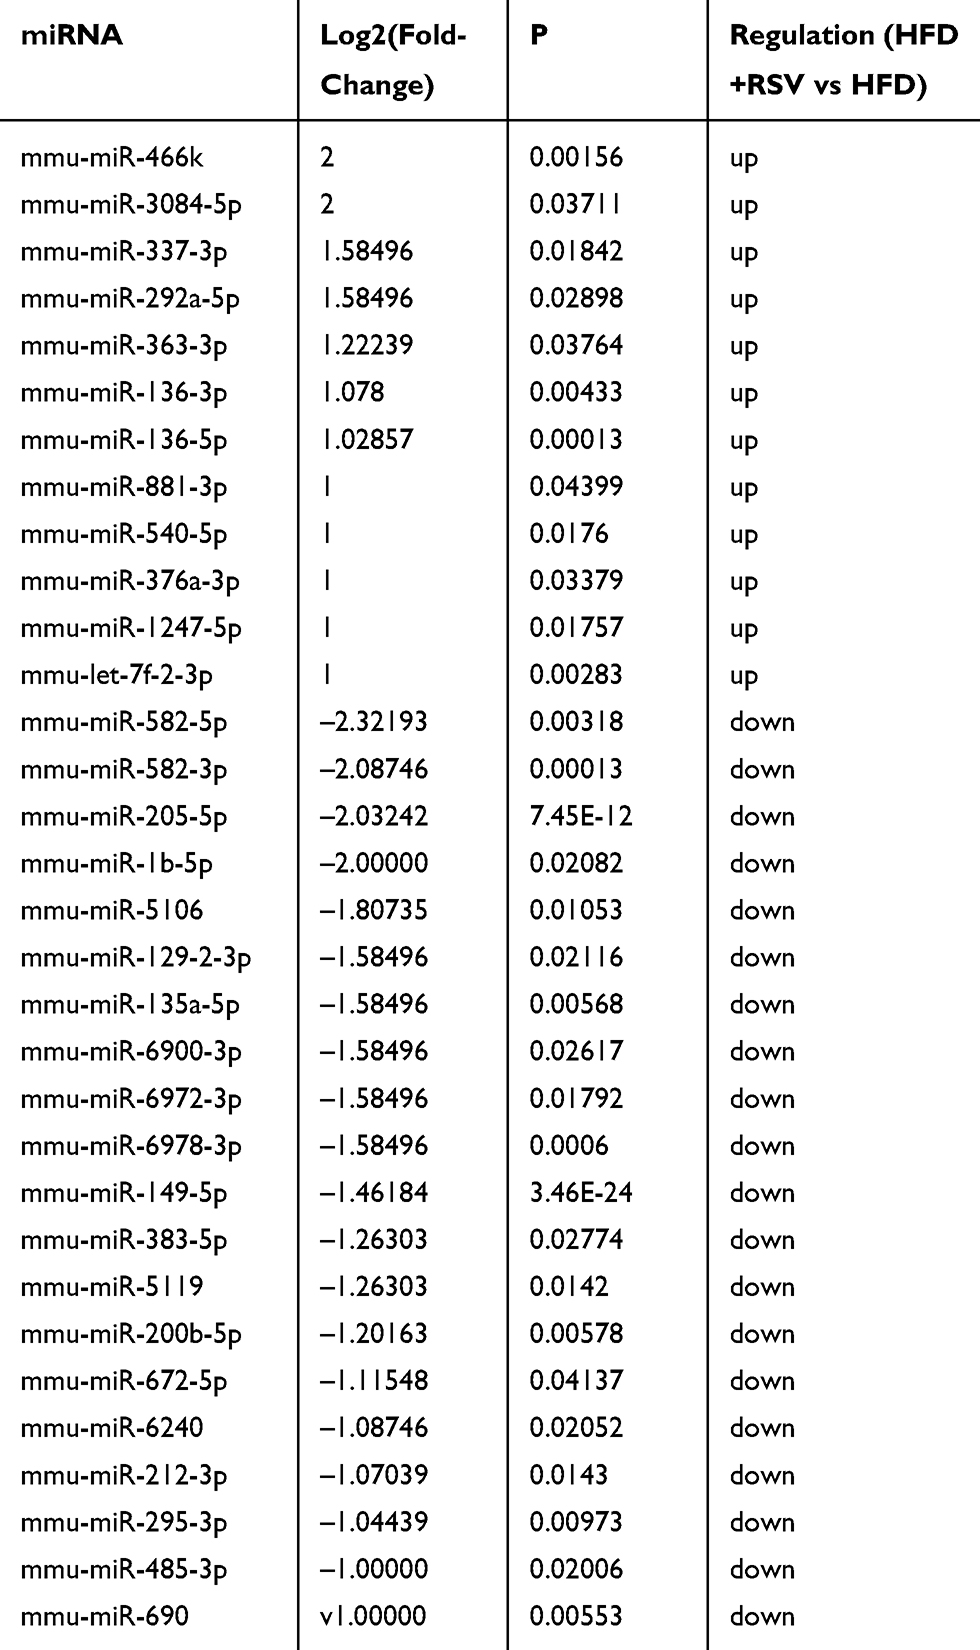 |
Table 2 miRNA Expression Patterns in HFD and HFD+RSV Mice |
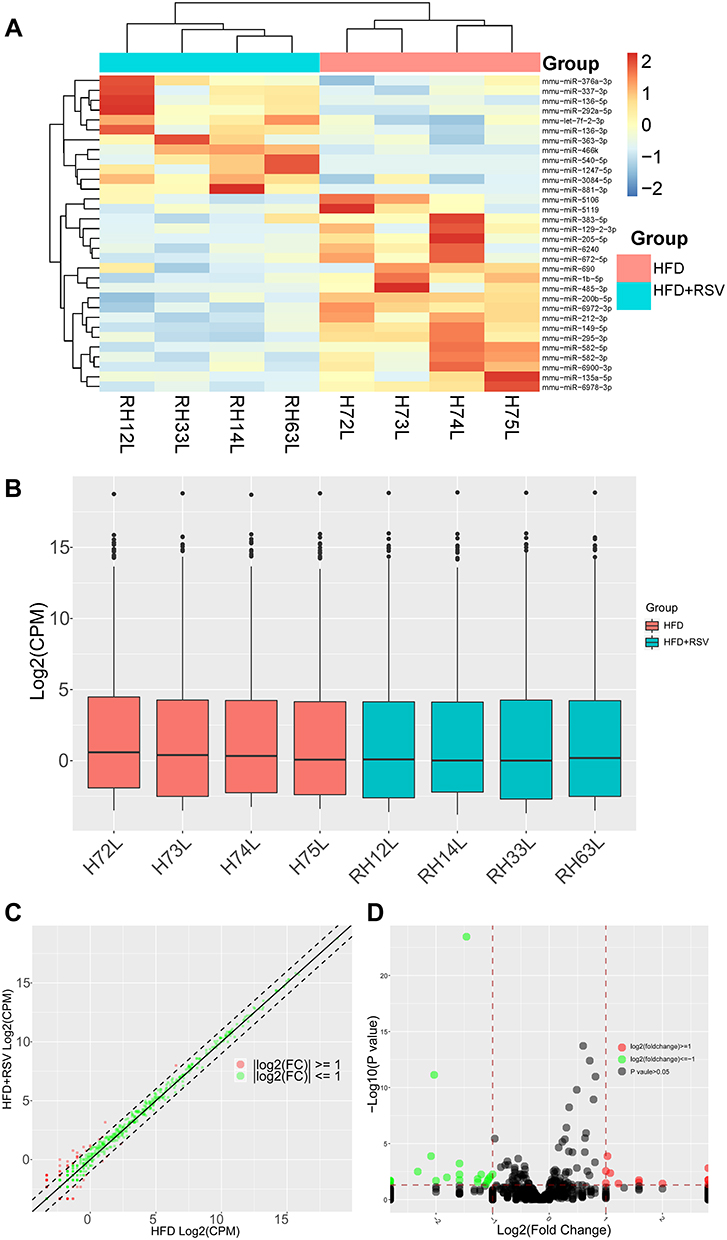 |
Figure 1 Differential miRNA expression between HFD+RSV and HFD mice. (A) Clustering heat map of differentially expressed miRNAs. (B) Box plot of signal intensity distribution of miRNAs in all samples. (C) Scatter plot of miRNA variation. (D) Volcano plot of miRNA variation. |
GO and KEGG Pathway Analyses
In order to clarify the biological functions and involved signaling pathways of genes in vivo or in cells, we can make annotations based on Gene Ontology and KEGG databases for each gene. GO analysis revealed that differentially expressed miRNAs were mainly enriched in the biological processes small GTPase-mediated signal transduction, Ras protein signal transduction, and positive regulation of neuron differentiation, the cellular components cell leading edge, cell-cell junction, and synaptic membrane, and the molecular functions core promoter proximal region sequence-specific DNA binding, transcription factor activity, and RNA polymerase II core promoter proximal region sequence-specific binding (Figure 2A). Pathway analysis revealed that the differential miRNAs were mainly involved in the MAPK, ErbB, Ras, Hippo, Wnt, and PI3K-Akt signalling pathways (Figure 2B). PI3K-Akt is a key pathway in insulin signalling and is associated with insulin resistance animal model studied here.
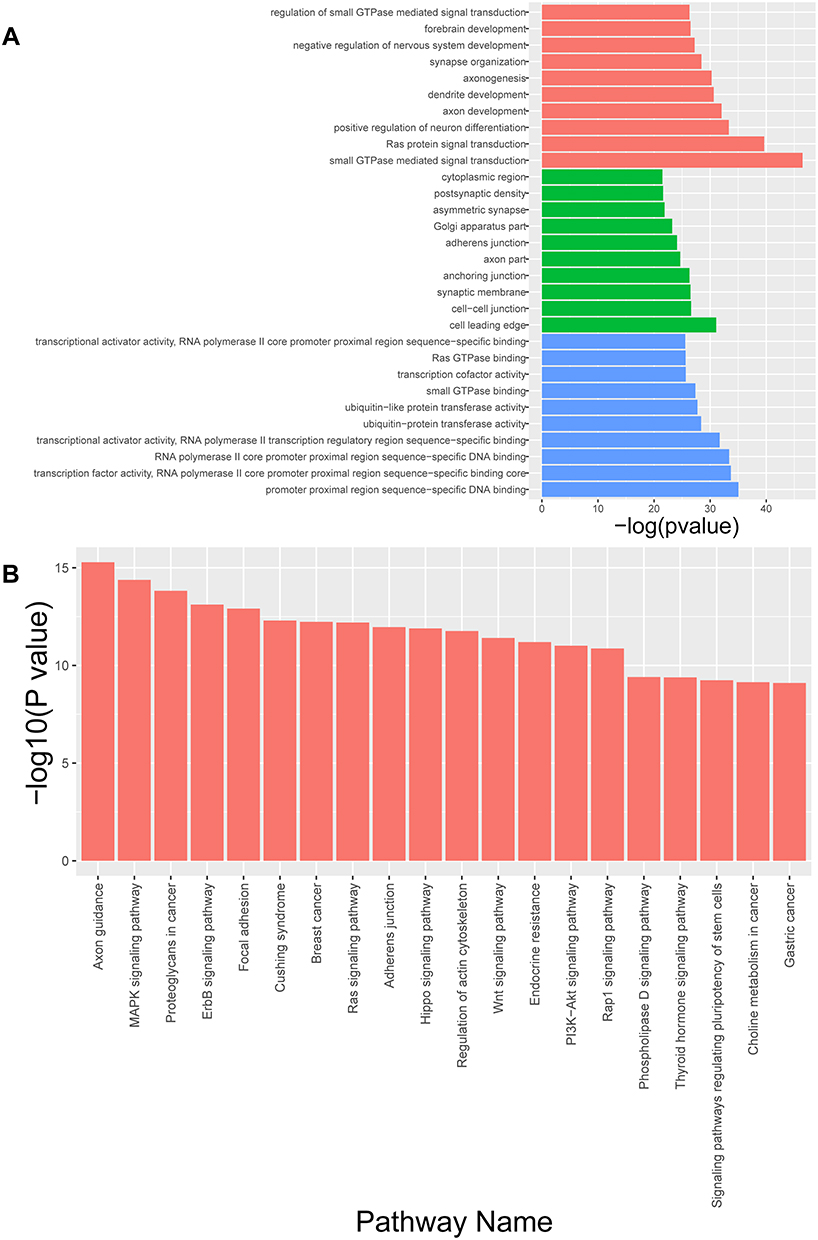 |
Figure 2 GO and KEGG pathway analysis of differentially expressed mRNAs. (A) The top 10 GO terms in biological process, cellular component, and molecular function are shown, ranked by enrichment score. (B) Top 20 pathways enriched among differentially regulated mRNAs. |
RT-qPCR-Based Verification of mRNA Expression
Three resveratrol-up-regulated miRNAs (mmu-miR-363-3p, mmu-miR-136-5p, and mmu-miR-337-3p) (Figure 3A–C) and three resveratrol-downregulated miRNAs (mmu-miR-149-5p, mmu-miR-205-5p, and mmu-miR-295-3p) (Figure 3D–F) were randomly selected from the 32 differentially expressed miRNAs for confirmation of the sequencing results by RT-qPCR. Except for mmu-miR-295-3p, the expression levels of all miRNAs were consistent with those in the sequencing analysis. mmu-miR-295-3p was downregulated, in line with the sequencing results, but not significantly. Among the six miRNAs differentially expressed in the HFD+RSV and HFD groups and confirmed by RT-qPCR, only mmu-miR-363-3p differed in expression between the HFD group and the CON group. mmu-miR-363-3p showed relatively high expression upon resveratrol treatment. mmu-miR-363-3p expression was significantly down-regulated in the HFD group compared to the CON group and significantly up-regulated in the HFD+RSV group compared with the HFD group. This is consistent with the fact that our study of RSV can improve HFD-induced insulin resistance.
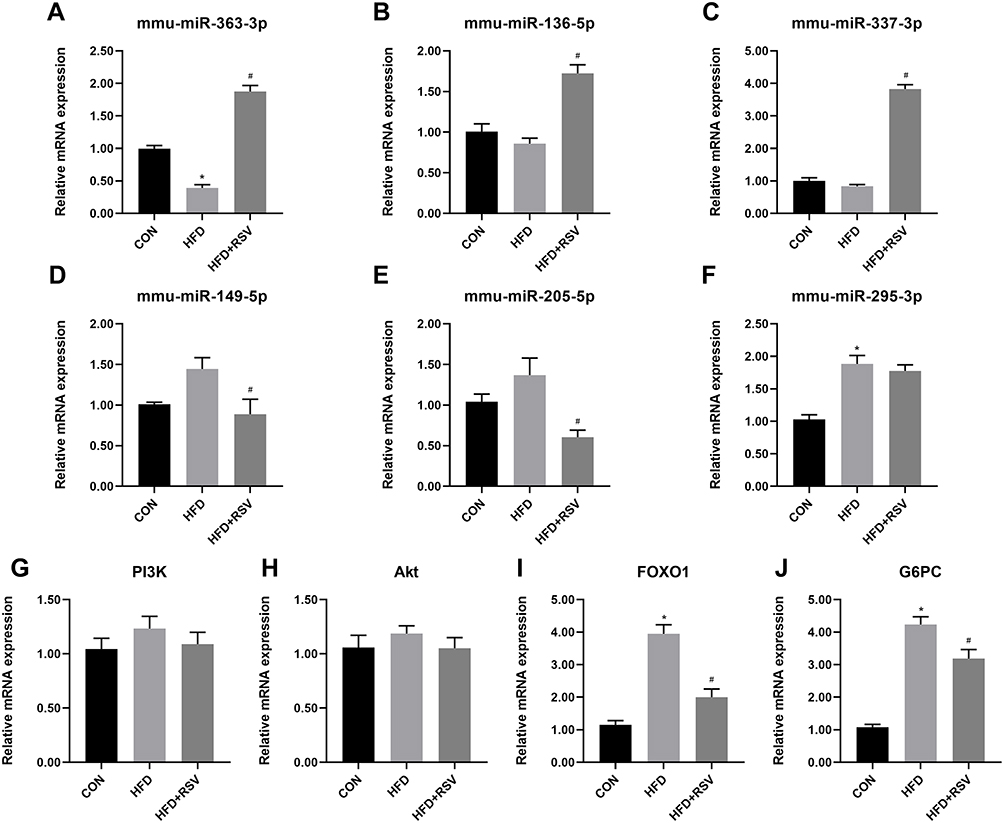 |
Figure 3 Relative mRNA expression of PI3K-Akt signaling pathway genes in resveratrol-treated insulin resistance model mice. Three up- (A–C) and three downregulated (D–F) miRNAs, four PI3K-Akt signaling pathway genes (G–J) in the livers of CON, HFD, and HFD+RSV mice. Data are the mean ± SD (n = 3). *P < 0.05 vs CON, #P < 0.05 vs HFD (one-way ANOVA with LSD or Tamhane’s test). |
RT-qPCR-Based Verification of PI3K-Akt Signalling Pathway-Related Genes
To verify whether the PI3K-Akt signaling pathway is related to the animal model we studied. We compared the mRNA expression of several key genes in the PI3K-Akt signalling pathway (PI3K, Akt, FOXO1, and G6PC) in the livers of CON, HFD, and HFD+RSV mice. PI3K and Akt mRNA levels did not differ between the three groups (Figure 3G and H). The FOXO1 and G6PC mRNA levels were significantly increased in the HFD group compared with the CON group, and significantly suppressed in the HFD+RSV group compared with the HFD group (Figure 3I and J).
Western Blot Verification of PI3K-Akt Signalling Pathway-Related Genes
Several key molecules in the PI3K-Akt signaling pathway were selected for Western blot verification in three groups of mouse liver tissues to compare protein levels (Figure 4A). Compared with the CON group, the levels of p-PI3K and p-Akt in the HFD group decreased significantly (Figure 4C and F), and the expression levels of FOXO1 and G6PC increased significantly (Figure 4D and G). Compared with HFD group, the levels of p-PI3K and p-Akt in HFD + RSV group were significantly increased (Figure 4C and F), and the expression levels of FOXO1 and G6PC were significantly decreased (Figure 4D and G). There was no difference in total PI3K and Akt expression levels among the three groups (Figure 4B and E).
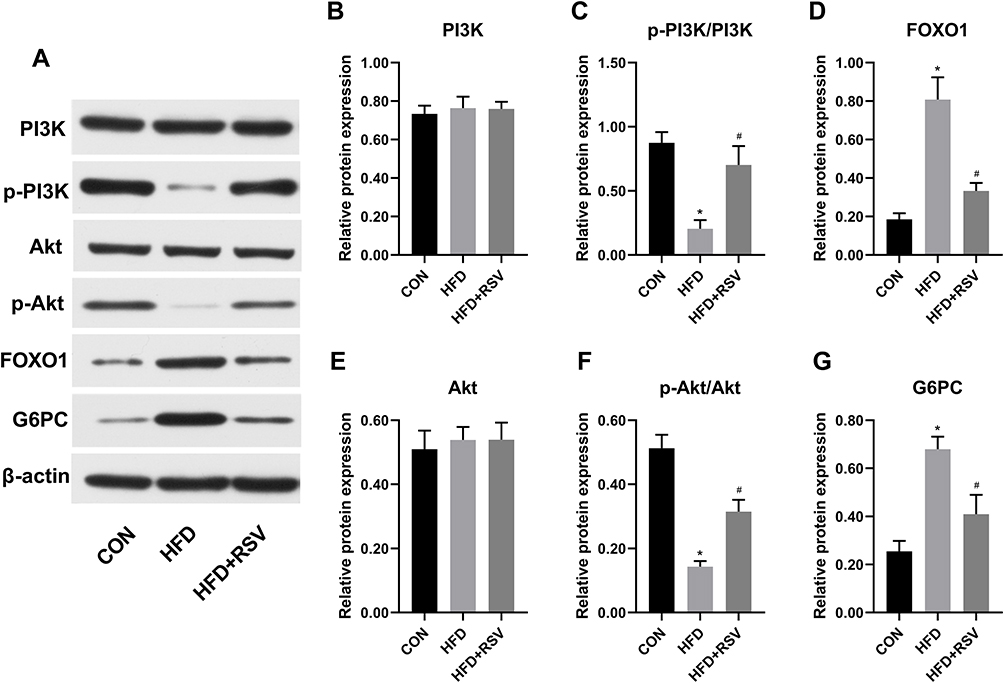 |
Figure 4 Relative protein expression of PI3K-Akt signal pathway proteins in the liver in resveratrol-treated insulin resistance model mice. (A) Western blot of PI3K-Akt signal pathway molecules. Quantitative data for PI3K (B), p-PI3K/PI3k (C), FOXO1 (D), Akt (E), p-Akt/Akt (F), G6PC (G). Data are the mean ± SD (n = 3). *P < 0.05 vs CON, #P < 0.05 vs HFD (one-way ANOVA with LSD or Tamhane’s test). |
Establishment of an Insulin Resistance Cell Model
HepG2 cells were treated with palmitic acid to induce insulin resistance, and glucose concentrations in the medium were measured at 0, 12, and 24 h. There were no significant differences in the glucose concentration between the CON and PA groups at 0 and 12 h. At 24 h, the glucose concentration in the PA group was significantly higher than that in the CON group, indicating successful model establishment10 (Figure 5A).
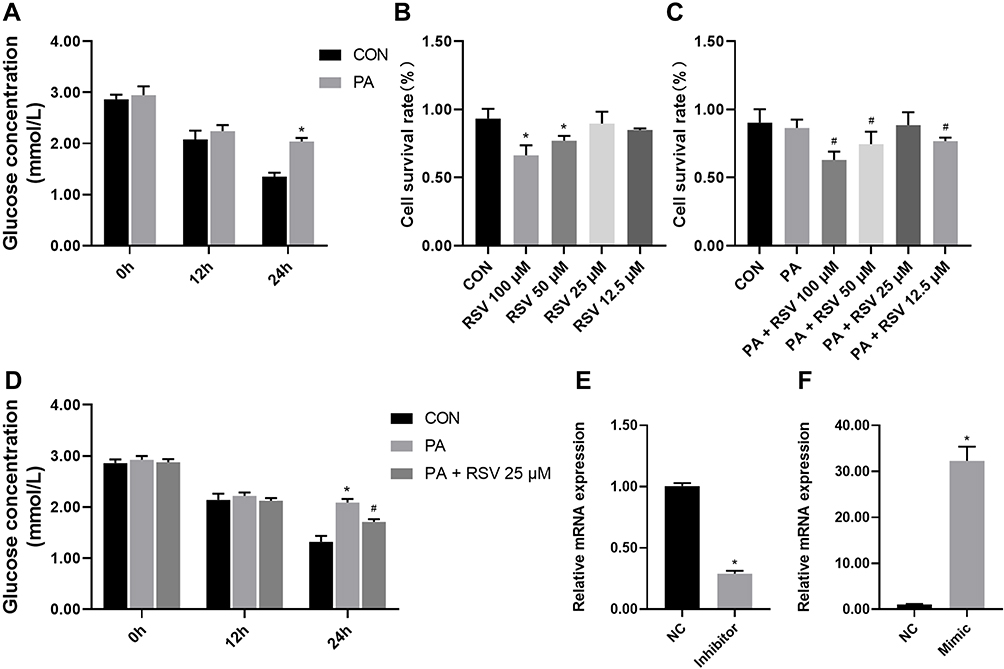 |
Figure 5 Establishment of an insulin resistance model in HepG2 cells, and mmu-miR-363-3p knockdown and overexpression efficiency. (A) Glucose concentrations in the culture medium of HepG2 cells after 0.25 mM PA treatment for 0, 12, and 24 h. (B) Cell survival rates after 24 h of treatment with the indicated concentrations of resveratrol as determined by CCK-8 assay. (C) Cell survival rates after PA and resveratrol treatments as determined by CCK-8 assay. (D) Glucose concentrations in the culture medium of HepG2 cells after 0.25 mM PA and 25 μM RSV treatments. (E) Relative mmu-miR-363-3p level after treatment with a mimic. F. Relative mmu-miR-363-3p level after treatment with an inhibitor. Data are the mean ± SD (n = 6). *P < 0.05 vs CON, #P < 0.05 vs PA (one-way ANOVA with LSD or Tamhane’s test). |
Effects of Resveratrol on Cell Viability
HepG2 cells were treated with resveratrol at 0, 12.5, 25, 50, or 100 μM for 24 h, and cell viability was evaluated by CCK-8 assay. Resveratrol at 50 μM and 100 μM significantly reduced cell viability compared with the control treatment, whereas it had no significant effect at 12.5 μM and 25 μM, although the suppressive effect at 12.5 μM was slightly less than that at 25 μM. The cell survival rate in PA-treated HepG2 cells (86.5%) was slightly, but not significantly lower than that in control cells (90.3%). Cell viability was significantly lower in cells treated with PA + 100, 50, or 12.5 μM RSV than in cells treated with PA alone. However, there were no significant differences between the PA + 25 μM RSV group and the PA and CON groups (Figure 5B and C).
Resveratrol Reduces the Glucose Concentration in HepG2 Cells
Glucose concentrations in the medium at 0, 12, and 24 h after RSV and PA treatment of HepG2 cells were measured. There were no significant differences in glucose concentration between these groups at 0 and 12 h. At 24 h, the glucose concentration in the PA group was significantly increased compared that in the CON group, and 25 μM resveratrol suppressed this increase (Figure 5D).
Effect of Resveratrol on the PI3K-Akt Signalling Pathway After Knockdown or Overexpression of mmu-miR-363-3p
To investigate the involvement of mmu-miR-363-3p in the effect of resveratrol on the regulation of PI3K-Akt signalling in the cell model of insulin resistance, we knocked down or overexpressed the miRNA using inhibitor or mimic, respectively (Figure 6A and H). The mmu-miR-363-3p level was significantly decreased in knockdown compared to control cells (Figure 5E). PA-stimulated mmu-miR-363-3p-knockdown HepG2 cells were treated with 25 μM RSV. Compared with the CON group, FOXO1 and G6PC protein levels were significantly increased in the PA group (Figure 6D and G), whereas p-Akt and p-PI3K levels were significantly decreased (Figure 6C and F). Compared with the PA+RSV group, p-Akt and p-PI3K levels were significantly decreased in PA+RSV+knockdown group (Figure 6C and F), whereas FOXO1 and G6PC expression was significantly increased (Figure 6D and G). There was no difference in total PI3K and Akt expression levels among the five groups (Figure 6B and E).
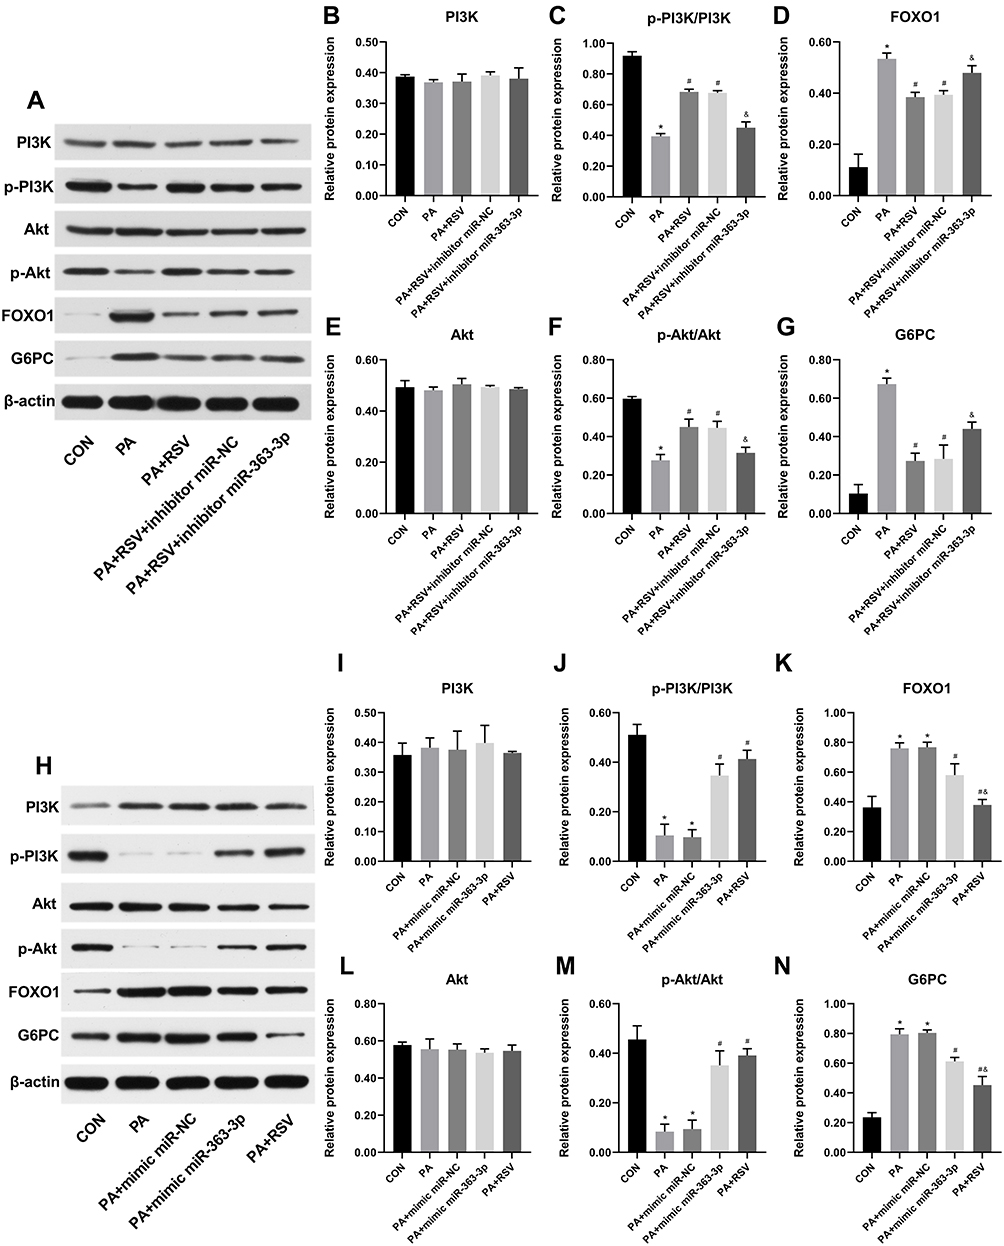 |
Figure 6 Effect of resveratrol on the PI3K-Akt signalling pathway after knockdown or overexpression of mmu-miR-363-3p. Knockdown of mmu-miR-363-3p Western blot (A) of the indicated PI3K-Akt signalling pathway molecules and quantitative data (B–G). Overexpression of mmu-miR-363-3p Western blot (H) of the indicated PI3K-Akt signalling pathway molecules and quantitative data (I–N). Data are the mean ± SD (n = 3). *P < 0.05 vs CON, #P < 0.05 vs PA, &P < 0.05 vs PA +RSV (one-way ANOVA with LSD or Tamhane’s test). |
The mmu-miR-363-3p level was significantly increased in overexpression compared with control cells (Figure 5F). Compared with the CON group, FOXO1 and G6PC levels were increased in the PA group (Figure 6K and N), whereas p-Akt and p-PI3K levels were decreased, and the differences were significant (Figure 6J and M). After overexpression of mmu-miR-363-3p, p-Akt and p-PI3K levels were significantly increased compared with those in the PA group (Figure 6J and M), whereas FOXO1 and G6PC expression was significantly decreased (Figure 6K and N). Compared with the PA group, FOXO1 and G6PC levels were significantly decreased after RSV intervention (Figure 6K and N), whereas p-Akt and p-PI3K were significantly increased (Figure 6J and M). There was no difference in total PI3K and Akt expression levels among the five groups (Figure 6I and L).
Discussion
The most prominent feature of type 2 diabetes is the inhibition of insulin signaling, which leads to insulin resistance.11 Resveratrol is a polyphenolic compound found in a wide variety of plants; it has been detected in more than 70 species.12,13 Numerous studies have shown that resveratrol can improve insulin resistance.14 Resveratrol increases glucose uptake in the absence of insulin via the PI3K/Akt signaling pathway in an Akt phosphorylation-dependent manner.15
miRNAs are involved in the development and progression of type 2 diabetes.16 miRNAs can affect numerous targets in the liver insulin signaling pathway and can thus improve or induce hepatic insulin resistance.17 For example, upregulation of miR-29 expression in the liver reduces the blood glucose level and improves insulin resistance in the liver by inhibiting glucose-6-phosphatase.18 miR-143 upregulation in the livers of HFD-fed model mice resulted in inhibition of PI3K expression and Akt activation, and induced insulin resistance.19 However, although resveratrol and miRNAs are important in the treatment of type 2 diabetes, to our knowledge, it is unknown whether resveratrol can improve liver insulin resistance in HFD-fed mice by regulating miRNAs. In this study, we investigated the regulation of miRNAs in the PI3K-Akt signaling pathway in a HFD-induced insulin resistance mouse model upon resveratrol intervention.
Using high-throughput sequencing, we identified 32 differentially expressed miRNAs in the HFD+RSV group compared with the HFD group. Of these, 6 miRNAs were selected for verification of the sequencing results by RT-qPCR; except for mmu-miR-295-3p, the RT-qPCR results were consistent with the sequencing results, indicating that the sequencing data were reliable. The sequencing results indicated that resveratrol can reverse insulin-induced hyperlipidaemia by regulating miRNAs. However, the roles of these miRNAs in increasing insulin sensitivity are not known. We used GO and KEGG pathway enrichment analyses to functionally assess the 32 differentially expressed genes and found that the PI3K-Akt signalling pathway was significantly enriched. We found that mmu-miR-363-3p was up-regulated by resveratrol under HFD, indicating that resveratrol reversed the adverse effects of HFD on this miRNA. This further indicated that resveratrol may play an important role in improving insulin resistance by regulating the effect of mmu-miR-363-3p on the PI3K-Akt signalling pathway. PI3K-Akt is one of the important signalling pathways involved in the regulation of cell proliferation, differentiation, and apoptosis.20 It is also involved in the onset and development of various diseases, such as type 2 diabetes and metabolic and cardiovascular diseases.21 PI3K/Akt pathway activation also plays an important role in increasing insulin sensitivity and regulating glycolipid metabolism.22 PI3K is a family of lipid kinases that catalyse the phosphorylation of inositol and phosphatidylinositol, and have serine/threonine (Ser/Thr) kinase as well as phosphatidylinositol kinase activities. Phosphatidylinositol 3,4,5-triphosphate, a product of PI3K, binds to Akt and promotes membrane recruitment of Akt.23 The main function of Akt in the liver is to synthesize glycogen and transport glucose. Phosphorylated Akt can inhibit the expression of FOXO1. FOXO1 promotes the expression of G6PC, which is the rate-limiting enzyme of the gluconeogenesis pathway, thus promoting glucose production. PI3K inhibits FOXO1 by activating Akt, which decreases the expression of G6PC, thus lowering blood glucose and improving insulin resistance.24
We treated HepG2 cells with 0.25 mmol/L palmitic acid to establish a hepatocyte insulin resistance model in vitro.25 This is the most widely used in-vitro model of insulin resistance or type 2 diabetes.26 Based on our findings in the animal model, we selected mmu-miR-363-3p as a miRNA potentially associated with the positive effect of resveratrol in improving insulin resistance for further analysis. There were no reports on its relationship with resveratrol. On the basis of cell viability experiments, we found that 25 μM resveratrol had no significant effect on PA-treated HepG2 cell viability, whereas resveratrol at 12.5, 50, and 100 μM reduced cell viability. This is in line with findings in our previous study.27 As there was no significant difference in cell viability between non-treated control cells and cells treated with 25 μM resveratrol, this concentration was appropriate for cell treatments.
Numerous studies have shown that mmu-miR-363-3p expression is closely related to cancer onset and development, and that mmu-miR-363-3p functions as a tumour suppressor in liver cancer, gastric cancer, and lung adenocarcinoma.28 However, its relationship with resveratrol in improving HFD-induced insulin resistance has not been reported. Therefore, we studied the effects of resveratrol on the expression of PI3K-Akt signalling molecules upon mmu-miR-363-3p knockdown or overexpression. We found that p-Akt and p-PI3K levels were significantly increased after mmu-miR-363-3p knockdown, whereas FOXO1 and G6PC expression was significantly decreased, suggesting increased insulin resistance and gluconeogenesis. After overexpression of mmu-miR-363-3p, FOXO1 and G6PC expression was lower than that after resveratrol treatment, but insulin resistance was improved. These findings indicated that resveratrol improved insulin resistance more strongly than did mmu-miR-363-3p overexpression. However, there were no significant differences in p-Akt and p-PI3K levels upon mmu-miR-363-3p overexpression when compared to those under resveratrol treatment. This indicated that the effects of resveratrol on these two indicators were similar to those of mmu-miR-363-3p overexpression. Together, these results indicate that resveratrol may play a beneficial role in improving insulin resistance by up-regulating mmu-miR-363-3p.
In conclusion, this study for the first time revealed that resveratrol may improve hyperlipidaemia-induced hepatic insulin resistance by up-regulating the miRNA mmu-miR-363-3p. This study provided new insights into the mechanism of resveratrol in the treatment of diabetes. mmu-miR-363-3p may serve as a potential therapeutic target for insulin resistance and type 2 diabetes mellitus.
Disclosure
The authors report no conflicts of interest in this work.
References
1. Guariguata L, Whiting DR, Hambleton I, et al. Global estimates of diabetes prevalence for 2013 and projections for 2035. Diabetes Res Clin Pract. 2014;103:137–149. doi:10.1016/j.diabres.2013.11.002
2. Akash MSH, Rehman K, Liaqat A. Tumor necrosis factor-alpha: role in development of insulin resistance and pathogenesis of type 2 diabetes mellitus. J Cell Biochem. 2018;119:105–110. doi:10.1002/jcb.26174
3. Zhao H, Chen S, Gao K, et al. Resveratrol protects against spinal cord injury by activating autophagy and inhibiting apoptosis mediated by the SIRT1/AMPK signaling pathway. Neuroscience. 2017;348:241–251. doi:10.1016/j.neuroscience.2017.02.027
4. Liu Y, Gao G, Yang C, et al. The role of circulating microRNA-126 (miR-126): a novel biomarker for screening prediabetes and newly diagnosed type 2 diabetes mellitus. Int J Mol Sci. 2014;15:10567–10577. doi:10.3390/ijms150610567
5. Lee RC, Feinbaum RL, Ambros V. The C. elegans heterochronic gene lin-4 encodes small RNAs with antisense complementarity to lin-14. Cell. 1993;75:843–854. doi:10.1016/0092-8674(93)90529-Y
6. Thiel G, Rössler OG. Resveratrol regulates gene transcription via activation of stimulus-responsive transcription factors. Pharmacol Res. 2017;117:166–176. doi:10.1016/j.phrs.2016.12.029
7. Bhatt JK, Thomas S, Nanjan MJ. Resveratrol supplementation improves glycemic control in type 2 diabetes mellitus. Nutr Res. 2012;32:537–541. doi:10.1016/j.nutres.2012.06.003
8. Livak KJ, Schmittgen TD. Analysis of relative gene expression data using real-time quantitative PCR and the 2–ΔΔCT method. Methods. 2001;25:402–408. doi:10.1006/meth.2001.1262
9. Zou Q, Mao Y, Hu L, Wu Y, Ji Z. miRClassify: an advanced web server for miRNA family classification and annotation. Comput Biol Med. 2014;45:157–160. doi:10.1016/j.compbiomed.2013.12.007
10. Gao D, Nong S, Huang X, et al. The effects of palmitate on hepatic insulin resistance are mediated by NADPH oxidase 3-derived reactive oxygen species through JNK and p38 MAPK pathways. J Biol Chem. 2010;285:29965–29973. doi:10.1074/jbc.M110.128694
11. Kim J, Bilder D, Neufeld TP. Mechanical stress regulates insulin sensitivity through integrin-dependent control of insulin receptor localization. Genes Dev. 2018;32:156–164. doi:10.1101/gad.305870.117
12. Biasutto L, Mattarei A, Azzolini M, et al. Resveratrol derivatives as a pharmacological tool. Ann N Y Acad Sci. 2017;1403:27–37. doi:10.1111/nyas.13401
13. Weiskirchen S, Weiskirchen R. Resveratrol: how much wine do you have to drink to stay healthy? Adv Nutr. 2016;4:706–718. doi:10.3945/an.115.011627
14. Abbasi Oshaghi E, Goodarzi MT, Higgins V, et al. Role of resveratrol in the management of insulin resistance and related conditions: mechanism of action. Crit Rev Clin Lab Sci. 2017;54:267–293. doi:10.1080/10408363.2017.1343274
15. Li J, Huang W, Tu R, Zhong G, Luo B, He Y. Resveratrol rescues hyperglycemia-induced endothelial dysfunction via activation of Akt. Acta Pharmacol Sin. 2017;38:182–191. doi:10.1038/aps.2016.109
16. Roggli E, Gattesco S, Caille D, et al. Changes in microRNA expression contribute to pancreatic β-cell dysfunction in prediabetic NOD mice. Diabetes. 2012;61:1742. doi:10.2337/db11-1086
17. Pogribny IP, Beland FA. Role of microRNAs in the regulation of drug metabolism and disposition genes in diabetes and liver disease. Expert Opin Drug Met. 2013;9:713–724. doi:10.1517/17425255.2013.783817
18. Liang J, Liu C, Qiao A, et al. MicroRNA-29a-c decrease fasting blood glucose levels by negatively regulating hepatic gluconeogenesis. J Hepatol. 2013;58:535. doi:10.1016/j.jhep.2012.10.024
19. Jordan SD, Krüger M, Willmes DM, et al. Obesity-induced overexpression of miRNA-143 inhibits insulin-stimulated AKT activation and impairs glucose metabolism. Nat Cell Biol. 2011;13:434–446. doi:10.1038/ncb2211
20. Pan LY, Zhang XH, Yin XH. Advance of mechanisms of diabetic cardiomyopathy. Chin J Cardiovasc Med. 2017;122:143–146.
21. Very N, Vercoutter-Edouart AS, Lefebvre T, et al. Cross-dysregulation of O-GlcNAcylation and PI3K/AKT/mTOR axis in human chronic diseases. Front Endocrinol. 2018;9:
22. Sun XH, Wang Y, Mu YL. Alteration of PI3K/Akt/mTOR signaling during development of diabetic cardiomyopathy and regulation of sirt1. Chin Pharmacol Bull. 2017;33:793–798.
23. Guo LP, Zhang ZJ, Li RT, et al. Influences of LncNA SNHG20 on proliferation and apoptosis of glioma cells through regulating the PTEN/PI3K/AKT signaling pathway. Eur Rev Med Pharmacol Sci. 2019;23:253–261. doi:10.26355/eurrev_201901_16771
24. Lin X, Shi H, Cui Y, et al. Dendrobium mixture regulates hepatic gluconeogenesis in diabetic rats via the phosphoinositide-3-kinase/protein kinase B signaling pathway. Exp Ther Med. 2018;16:204–212. doi:10.3892/etm.2018.6194
25. Zhang H, Ge Z, Tang S, Meng R, Bi Y, Zhu D. Erythropoietin ameliorates PA-induced insulin resistance through the IRS/AKT/FOXO1 and GSK-3β signaling pathway, and inhibits the inflammatory response in HepG2 cells. Mol Med Rep. 2017;16:2295–2301. doi:10.3892/mmr.2017.6810
26. Chiara V, Giuliana M, Cinzia G, et al. Gluconeogenic signals regulate iron homeostasis via hepcidin in mice. Gastroenterology. 2014;146:1060–1069. doi:10.1053/j.gastro.2013.12.016
27. Zhao H, Shu L, Huang W, et al. Resveratrol affects hepatic gluconeogenesis via histone deacetylase 4. Diabetes Metab Syndr Obes. 2019;12:401–411. doi:10.2147/DMSO.S198830
28. Wang Y, Chen T, Huang H, et al. miR-363-3p inhibits tumor growth by targeting PCNA in lung adenocarcinoma. Oncotarget. 2017;8:20133–20144. doi:10.18632/oncotarget.15448
 © 2020 The Author(s). This work is published and licensed by Dove Medical Press Limited. The full terms of this license are available at https://www.dovepress.com/terms.php and incorporate the Creative Commons Attribution - Non Commercial (unported, v3.0) License.
By accessing the work you hereby accept the Terms. Non-commercial uses of the work are permitted without any further permission from Dove Medical Press Limited, provided the work is properly attributed. For permission for commercial use of this work, please see paragraphs 4.2 and 5 of our Terms.
© 2020 The Author(s). This work is published and licensed by Dove Medical Press Limited. The full terms of this license are available at https://www.dovepress.com/terms.php and incorporate the Creative Commons Attribution - Non Commercial (unported, v3.0) License.
By accessing the work you hereby accept the Terms. Non-commercial uses of the work are permitted without any further permission from Dove Medical Press Limited, provided the work is properly attributed. For permission for commercial use of this work, please see paragraphs 4.2 and 5 of our Terms.