")
Back to Journals » Drug Design, Development and Therapy » Volume 13
Resveratrol reduces liver endoplasmic reticulum stress and improves insulin sensitivity in vivo and in vitro
Authors Zhao H, Zhang Y, Shu L , Song G, Ma H
Received 1 February 2019
Accepted for publication 4 March 2019
Published 2 May 2019 Volume 2019:13 Pages 1473—1485
DOI https://doi.org/10.2147/DDDT.S203833
Checked for plagiarism Yes
Review by Single anonymous peer review
Peer reviewer comments 2
Editor who approved publication: Professor Anastasios Lymperopoulos
Hang Zhao,1,2 Yunjia Zhang,1 Linyi Shu,1,2 Guangyao Song,1,2 Huijuan Ma1–3
1Department of Internal Medicine, Hebei Medical University, Shijiazhuang, Hebei 050017, People’s Republic of China; 2Endocrinology Department, Hebei General Hospital, Shijiazhuang, Hebei 050051, People’s Republic of China; 3Hebei Key Laboratory of Metabolic Diseases, Hebei General Hospital, Shijiazhuang, Hebei 050051, People’s Republic of China
Purpose: The aim of the study was to examine the effects of resveratrol upon hepatic endoplasmic reticulum stress (ERS) and insulin sensitivity in vivo and in vitro.
Material and methods: C57BL/6J mice were fed a high-fat diet (HFD) for 8 weeks, and insulin resistance was evaluated by the intraperitoneal glucose tolerance test (IPGTT). Mice were then treated with resveratrol for 12 weeks and blood and liver samples collected. Blood biochemical indicators were determined by kits, liver protein expression was determined by western blot, and morphological changes were observed by histological staining. Palmitic acid (PA)-induced insulin-resistant HepG2 cells were established. Cells were exposed to 100, 50 or 20 μM resveratrol for 24 hrs, and proliferation/cytotoxicity was determined. Cells were divided into five groups: control, PA, PA + Rev (100 μM), PA + Rev (50 μM) and PA + Rev (20 μM) groups. After 24 hrs of treatment, cellular proteins were analyzed the same way as animal tissues.
Results: The IPGTT confirmed that the insulin resistance model was established successfully. After resveratrol treatment, fasting blood glucose and cholesterol levels declined and the quantitative insulin sensitivity check index increased. Western-blot results showed that resveratrol-treated HFD mice had reduced hepatic levels of p-PERK, ATF-4 and TRIB3, and increased the levels of ATF-6, p-AKT and p-GSK3β. In the cell model, resveratrol with 100 and 50 μM enhanced ERS and insulin resistance, whereas 20 μM had beneficial effects, similar to the animal model.
Conclusion: Resveratrol reduced hepatic ERS, thereby improving insulin sensitivity and glucose levels. However, high doses of resveratrol had harmful effects on cells, elevating ERS and insulin resistance. The safe dose of resveratrol needs further investigation.
Keywords: blood glucose, insulin resistance, endoplasmic reticulum stress, resveratrol
Introduction
In recent years, the incidence of type 2 diabetes mellitus has increased dramatically with associated systemic complications, such as heart, kidney and blood vessels diseases, posing a serious threat to patients’ health.1 Insulin resistance is the basis of the onset and development of type 2 diabetes.2
The liver is an insulin-sensitive organ and plays an important role in glucose and lipid metabolism. Evidence suggests that insulin resistance in the liver is closely related to the occurrence and progress of type 2 diabetes.3 Endoplasmic reticulum stress (ERS) may be a key factor causing decreased insulin sensitivity in the liver.4 Previous studies showed that ERS mediates the development of insulin resistance and type 2 diabetes.5 Studies have shown that ERS promotes adipokine production, and induces adipose tissue inflammation and dysfunction.6 Islet cell ERS leads to decreased β cell apoptosis and insulin secretion.7 Liver ERS interferes with hepatic gluconeogenesis and impairs insulin sensitivity.8 Inhibition of ERS can alleviate insulin resistance, diabetes and related complications.
At present, oral medications and insulin are used to control blood glucose in the treatment of type 2 diabetes. Due to their contraindications and side effects, especially hypoglycemia and weight gain,9 coupled with poor compliance with long-term medication, the use and efficacy of oral drugs and insulin are limited. In addition, lifestyle changes, including exercise and nutrition interventions, are difficult to achieve in some populations. Muraki et al,10 found that increased grape intake was significantly associated with a reduced risk of type 2 diabetes. Resveratrol is a natural polyphenolic compound found in grape skins. It is also rich in various plants and fruits such as peanuts, soybeans, pomegranates and knotweed.11 Because of the convenience and low cost of resveratrol, as well as potential therapeutic actions, such as anti-platelet aggregation, anti-cancer, cartilage protection and improved endothelial function,12 resveratrol has been the focus of many studies. Several previous studies have shown controversial effects of resveratrol with regard to lowering blood glucose levels and improving insulin resistance, but most studies have confirmed the beneficial effects of resveratrol.13,14 Whether resveratrol can affect ERS, thus improving insulin sensitivity lacks sufficient experimental evidence.
This study aimed to use insulin-resistant animal and cell models to examine the effects of resveratrol upon hepatic ERS and insulin signaling pathway. In addition, it was aimed to examine the effect of resveratrol at different concentrations.
Material and methods
Animal experiment
Animals
Thirty-six-week-old specific pathogen free male C57BL/6J mice (body weight 22.0–25.0 g), were purchased from Beijing Vital River Laboratory Animal Technology Co., Ltd. Mice were housed in an animal barrier system at the Clinical Research Center of Hebei General Hospital, with the room temperature controlled at 23–25°C and relative humidity about 60% in a 12-h light/dark cycle. The animal experiment was approved by the Animal Ethics Committee of Hebei General Hospital and complied with the International Laboratory Animal Management Regulations.
Animal feed
Ordinary feed D12450J: 3.85 kcal/g, calorie composition: 20% protein, 70% carbohydrate, 10% fat.
High-fat feed D12492: 5.24 kcal/g, calorie composition: 20% protein, 20% carbohydrate, 60% fat.
All feed was purchased from Beijing Huafukang Biotechnology Co., Ltd.
Establishment of animal model
After 1 week of adaptive feeding, C57BL/6J mice were randomly divided into two groups: control group (Con) and high-fat diet (HFD) group. The Con group was given an ordinary diet, and the HFD group was given a HFD. Weekly body weights and food intake were recorded. After 8 weeks of feeding, the mice were fasted for 12 hrs then examined by an intraperitoneal glucose tolerance test (IPGTT). Blood was taken from the tail vein at 0, 15, 30, 60 and 120 mins to test glucose levels by an Accuchek Active Meter (ACCU-CHEK Roche, Germany).
Resveratrol treatment
Mice in the HFD group were randomly divided into HFD and high-fat diet + resveratrol (HFD + Rev) groups. Resveratrol powder (Sigma, USA) was dissolved in dimethyl sulfoxide (DMSO, Sigma, USA) at the ratio of 30 mg: 1 mL, then diluted with 0.9% sodium chloride solution. The HFD + Rev group was given resveratrol (60 mg/kg) by daily gavage, and Con and HFD groups were given 0.1% DMSO in 0.9% sodium chloride solution by daily gavage. The previous studies used resveratrol with different doses from 515 to 20016 mg/kg, we used 60 mg/kg/day in our pre-experiment, and this dose showed a beneficial effect on insulin sensitivity.
Serum and tissue specimens
After 12 weeks of resveratrol treatment, mice have fasted for 12 hrs overnight. Three mice were randomly selected from each group to receive an intraperitoneal insulin (Sigma, USA) injection of 1.5 IU/40 g body weight 20 mins before anesthesia, and the other mice had no insulin injection. All mice were euthanized via cervical dislocation, and blood was collected by cardiac puncture. The liver was quickly dissected, rinsed with normal saline, and a small piece (the same lobe every time) was fixed in 4% paraformaldehyde, and the remaining tissue placed in a cryotube, frozen in liquid nitrogen and stored at −80°C. The blood was centrifuged at 5,000 rpm for 15 mins, and serum was collected and stored at a −80°C.
Determination of blood indicators
Total cholesterol (TC), triglyceride (TG), high-density lipoprotein (HDL), low-density lipoprotein (LDL) were detected using a kit (Nanjing Jiancheng Bioengineering Institute). Serum insulin was measured using a mouse ultrasensitive insulin ELISA kit (80-INSMSU-E01, ALPCO Diagnostics, USA).
Hematoxylin-eosin (H&E) staining
The fixed liver samples were dehydrated with a conventional alcohol gradient and then, xylene, embedded in paraffin, and serially sliced for 5 μm thick sections. Sections were dewaxed, hydrated and stained with hematoxylin for 5 mins, stored in 70% ethanol and washed with distilled water. After staining with eosin, sections were dehydrated and mounted in neutral balsam. Morphological characteristics of the liver sections were observed by light microscopy.
Hepatic TG content
Approximately 0.3 g liver tissue was added to 2.7 mL of 0.9% sodium chloride at a ratio of 1:9. The tissue was then homogenized on ice. The homogenate was centrifuged at 2,500 rpm for 10 mins and the supernatant recovered. Hepatic TG content was determined according to the manufacturer’s instructions (Nanjing Jiancheng Bioengineering Institute).
Liver protein extraction and sample preparation
Liver specimens were removed from the −80°C and approximately 50 mg of each sample was added to 0.5 mL RIPA lysis buffer and protease inhibitor (Solarbio, China) pre-cooled at 4°C. Liver samples were minced in a tissue homogenizer (60 Hz, 60 s) then stored at 4°C overnight. The next day, liver samples were centrifugated for at 13,000 rpm for 15 mins at 4°C. Supernatants were collected and protein concentrations measured by BCA Protein Assay Kit. Supernatant samples were mixed with 5×SDS loading buffer at a ratio of 4:1, boiled, and then stored at −80°C.
Western blotting
Different concentrations of SDS-PAGE separation gel (8%, 10%, 12%) were prepared according to different molecular weights of the target proteins. After electrophoresis, proteins were transferred to PVDF membranes and then blocked with 5% skim milk for 3 hrs. Primary antibodies were diluted with the blocking solution as follows: β-actin mouse antibody; 1:1000, t-Akt: rabbit antibody; 1:2000, p-Akt (Ser 473): rabbit antibody; 1:1000, t-GSK: rabbit antibody; 1:1000, p-GSK (Ser 9): rabbit antibody; 1:1000, ATF-6: rabbit antibody; 1:1000, ATF-4: rabbit antibody; 1:1000, PERK: rabbit antibody; 1:1000 all purchased from Cell Signaling Technology (USA), p-PERK (Thr 980) rabbit antibody; 1:1000 purchased from Invitrogen (USA), TRIB3 mouse antibody; 1:1000 purchased from Proteintech (USA). Membranes were incubated overnight at 4°C. After washing, HRP-labeled goat anti-rabbit IgG antibody (1:8,000) or goat anti-mouse IgG antibody (1:3,000), all purchased from Signalway Antibody (USA) was incubated for approximately 50 mins at room temperature, then the membrane washed three times for 10 mins, and specific protein bands visualized with a gel imager. Protein expression was quantified by densitometry using Image-J software. Normalization was performed by incubating the same membrane with an antibody against β-actin.
Cell model
Establishing an insulin-resistant in vitro model
The human liver tumor cell line HepG2 was purchased from the National Infrastructure of Cell Line Resource of China and maintained at the Clinical Medical Research Center of Hebei Provincial People’s Hospital. HepG2 cells were cultured in MEM (Hyclone, USA) containing 10% fetal bovine serum (Hyclone, USA), 1% non-essential amino acid (Gibco, USA), 1% streptomycin mixture (Hyclone, USA) at 37°C with CO2. When the cells grew to approximately 80%, they were incubated with serum-free common medium (Con group) and medium containing 0.25 mmol/L palmitic acid (PA group) as described above.17 Glucose levels in the media were determined by the glucose oxidase method at 0, 12 and 24 hrs.
Proliferation/cytotoxicity test
After HepG2 cells were digested, cell suspensions were prepared and placed into 96-well plates. When the cells grew to 80%, different resveratrol concentrations (high concentration; 100 μM, medium concentration; 50 μM, low concentration; 20 μM) were added to investigate cell viability in the presence of resveratrol. After 24 hrs, 10 µL of CCK-8 reagent (DOJINDO, Japan) was added per well (protected from light), cultured for 30 mins, and the absorbance measured at 450 nm.
Cell treatment groups
HepG2 cells were divided into five groups: control, PA group, PA + Rev (100 μM), PA + Rev (50 μM) and PA + Rev (20 μM) groups. After 24 hrs, some cells were stimulated with insulin, and after 40 mins, cell proteins were extracted.
Western blotting
Same as described above for the animal model samples.
Statistical analysis
All data were processed using SPSS 22.0 software and results were expressed as mean ± standard deviation (Mean ± SD). Two-sample comparisons were analyzed using Student’s t-test, and multi-sample comparisons were analyzed using one-way ANOVA followed by a post hoc least significant difference test or Tamhane’s multiple comparison test if data satisfied normal distribution criteria. Otherwise, a non-parametric test was applied. P<0.05 was considered statistically significant.
Results
Insulin-resistant animal model
Body weight and caloric intake
Before the HFD intervention (at baseline), there was no difference in body weight between the two groups. After 8 weeks of HFD, the body weights of the HFD group increased significantly compared with the Con group. In the second week of the HFD, the body weight in the HFD group was significantly higher than the Con group (Figure 1A). There was no statistically significant difference in the daily caloric intake between the two groups (Figure 1B).
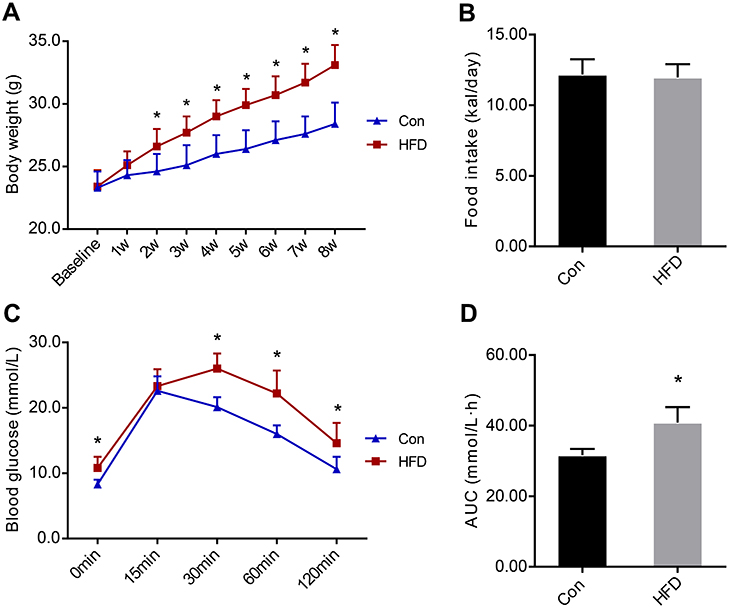 | Figure 1 Body weights and food intake of C57BL/6J mice before and after the high-fat diet (HFD) and IPGTT experiment result. (A). Body weights of the two groups during the HFD. (B). Daily food intake of the two groups during HFD. (C). Blood glucose levels at 0, 15, 30, 60 and 120 mins after intraperitoneal injection of glucose. (D). The area under the curve of glucose levels. Data are presented as the mean ± SD (n=10 in Con and n=20 in HFD group). Student’s t-test was used for statistical analysis. *P<0.05 vs Con group. Abbreviations: AUC, area under the curve; Con, control group; HFD, high-fat diet group; IPGTT, intraperitoneal glucose tolerance test. |
IPGTT
The IPGTT was performed after 8 weeks of the HFD. The blood glucose level in the HFD group was significantly higher than in the Con group at 0, 30, 60 and 120 mins (Figure 1C). Compared with the Con group, the area under the curve of glucose level in the HFD group was significantly increased (Figure 1D), demonstrating insulin resistance in the animal model (Table 1).
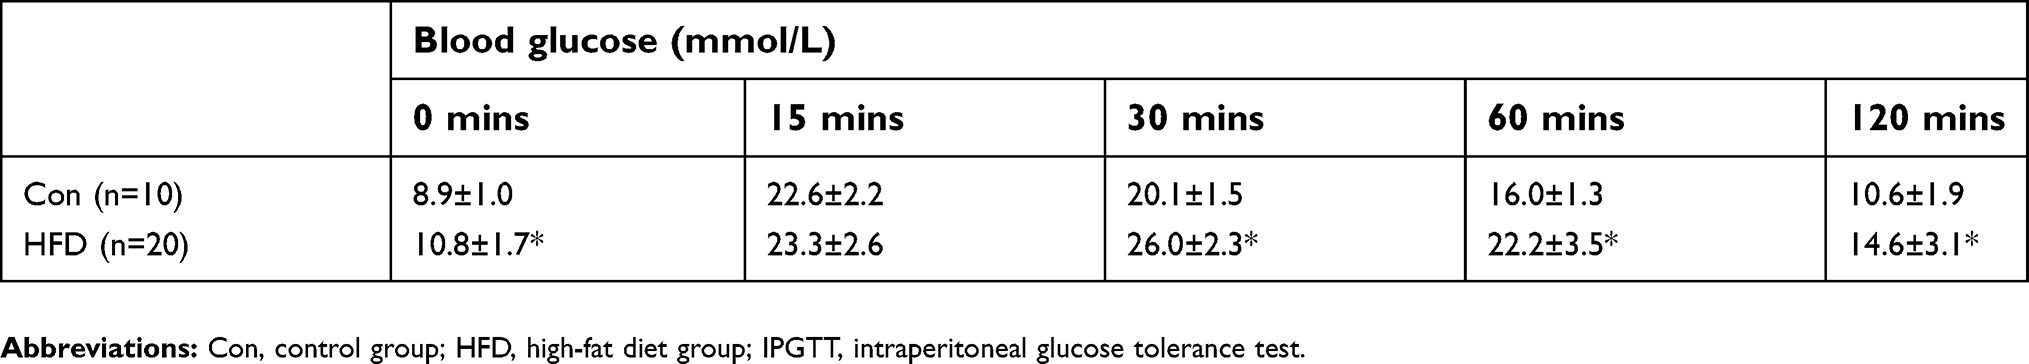 | Table 1 Blood glucose at each time point of IPGTT at the eighth week |
General indicators after resveratrol treatment
Body weight and food intake
Body weights in the HFD group were significantly higher than in the Con group, and were not altered by resveratrol treatment (Figure 2A). There was no difference in caloric intake between the three groups (Figure 2B).
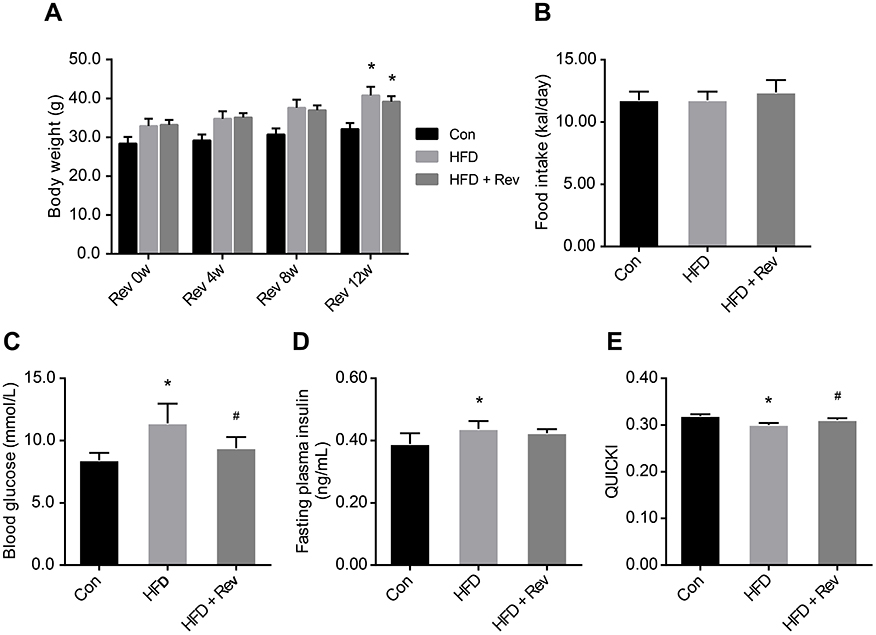 | Figure 2 Body weight and insulin sensitivity indicators after resveratrol treatment. (A). Body weights in control, high-fat diet and resveratrol-treated groups. (B). Daily caloric intake. (C). Fasting blood glucose level in three groups. (D). Fasting plasma insulin levels. (E). Quantitative insulin sensitivity check index. Data are presented as the mean ± SD, (n=10). One-way ANOVA was used for statistical analysis followed by a post hoc least significant difference test or Tamhane’s multiple comparison test. *P<0.05 vs Con group. #P<0.05 vs HFD group. Abbreviations: Con, control group; HFD, high-fat diet group; HFD + Rev, high-fat diet + resveratrol group; QUICKI, quantitative insulin sensitivity check index. |
Blood glucose and insulin levels, and quantitative insulin sensitivity check index (QUICKI)
Fasting blood glucose levels of the HFD group were significantly higher compared with the control group, and after resveratrol treatment, fasting blood glucose levels were significantly reduced in the HFD + Rev group (Figure 2C). Insulin levels in HFD mice were significantly higher than that of the control group. Resveratrol had no significant effect on insulin levels (Figure 2D). The QUICKI (QUICKI=1/[log(I0)+log(G0)])18 result for the HFD group was significantly lower than that of the control group, and was significantly increased in the resveratrol group (Figure 2E), indicating resveratrol reduced the insulin resistance of HFD mice (Table 2).
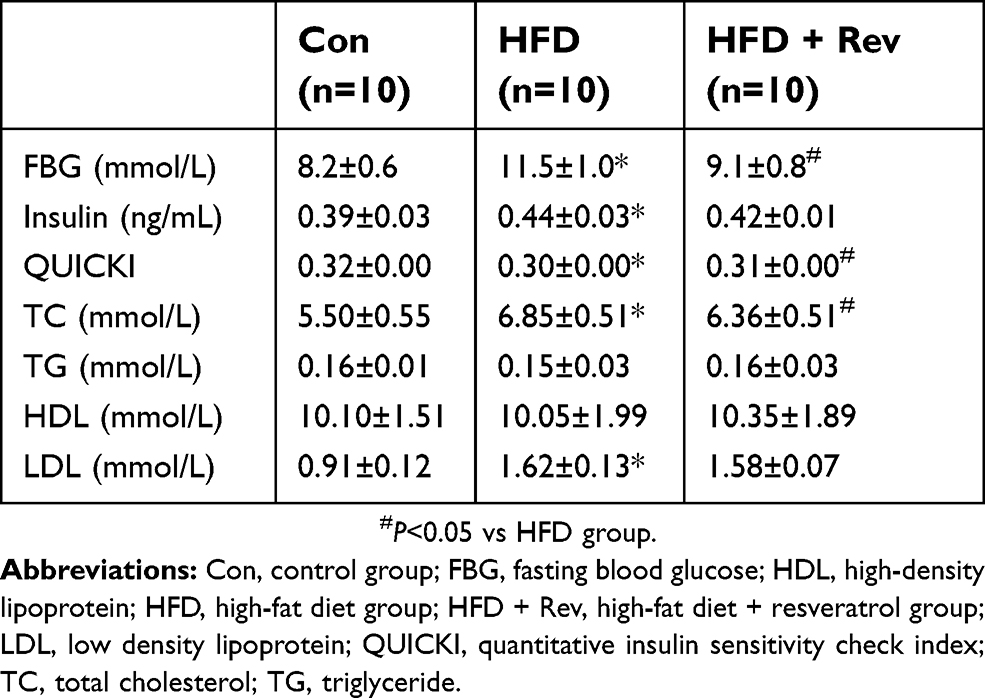 | Table 2 General indicators after resveratrol treatment |
Serum lipid profiles
Cholesterol and LDL levels were significantly higher in the HFD group compared with the control group, and 12 weeks of resveratrol reduced cholesterol (Figure 3A), but not LDL levels (Figure 3C). There were no differences between the three groups for TG and HDL levels (Figure 3B and D). This result indicated that resveratrol reduced blood lipid levels to some extent (Table 2).
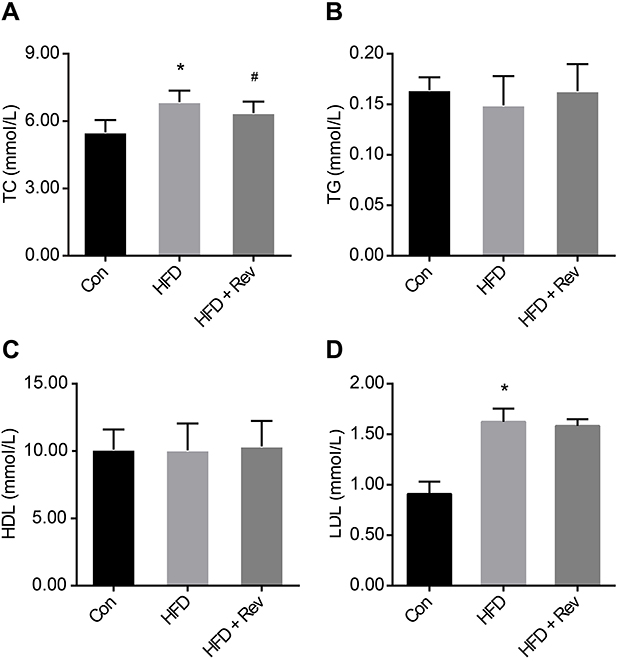 | Figure 3 Lipid profiles after resveratrol treatment. (A). Total cholesterol. (B). Triglyceride. (C). High-density lipoprotein. (D). Low-density lipoprotein. Data are presented as the mean ± SD (n=10). One-way ANOVA was used for statistical analysis followed by a post hoc least significant difference test or Tamhane’s multiple comparison test. *P<0.05 vs Con group. #P<0.05 vs HFD group.Abbreviations: Con, control group; HDL, high-density lipoprotein; HFD, high-fat diet group; HFD + Rev, high-fat diet + resveratrol group; LDL, low-density lipoprotein; TC, total cholesterol; TG, triglyceride. |
Hepatic lipid deposition
H&E staining
In the Con group, liver cells were structurally intact with a uniformly red-stained cytoplasm, and no lipid droplets were observed. In contrast, hepatocytes of the HFD group had a disordered and swollen structure, and cytoplasmic lipid droplets of different sizes. After resveratrol treatment, liver cell morphology was improved and lipid droplets were reduced (Figure 4A–C).
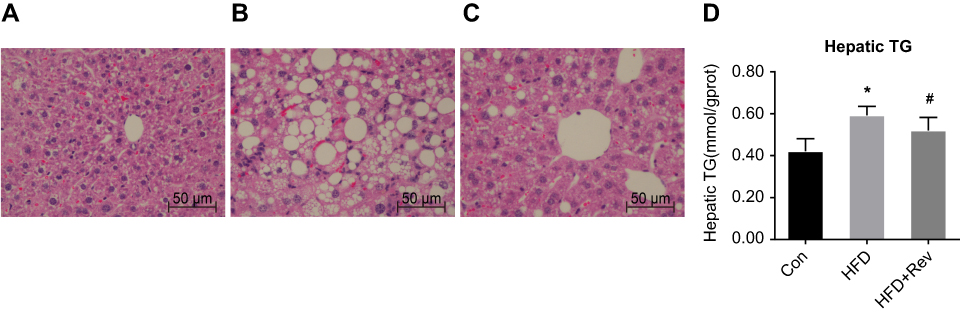 | Figure 4 Hepatic lipid deposition after resveratrol group. (A–C). H&E staining of liver tissue after resveratrol treatment. (A) Con group had normal liver morphology. (B). HFD group had a large number of lipid droplet vacuoles. (C). Group had less vacuoles compared with HFD alone. (D) Hepatic TG content after resveratrol treatment. One-way ANOVA was used for statistical analysis followed by a post hoc least significant difference test. *P<0.05 vs Con group. #P<0.05 vs HFD group.Abbreviations: Con, control group; HFD, high-fat diet group; HFD + Rev, high-fat diet + resveratrol group. |
Hepatic TG content
Compared with the Con group, the liver TG content in the HFD group was significantly increased, while the TG content was decreased after resveratrol intervention (Figure 4D). This was consistent with H&E staining results. This indicated that resveratrol reduces hepatic lipid deposition under insulin-resistant conditions.
Hepatic expression of insulin signaling pathway proteins in mice
There was no difference in the total expression of Akt (Figure 5A and B) and GSK-3β (Figure 5A and D) proteins between the three groups. However, the hepatic phosphorylation levels of Akt and GSK-3β in HFD mice were significantly decreased. After 12 weeks of resveratrol treatment, hepatic levels of p-Akt (Ser473) (Figure 5A and C) and p-GSK-3β (Ser9) (Figure 5A and E) (these two phosphorylation forms are active forms) were significantly increased, indicating resveratrol improved insulin resistance and increased glucose utilization.
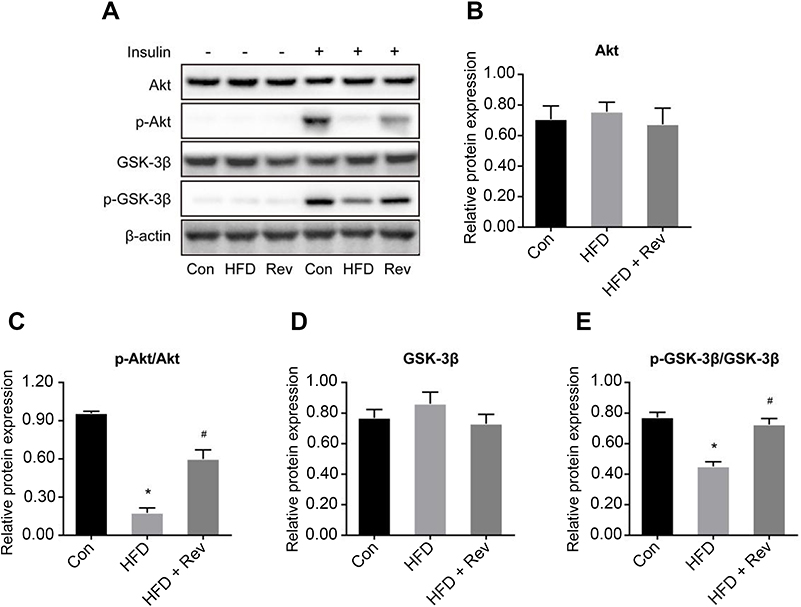 | Figure 5 Relative proteins expression of insulin signaling pathway after resveratrol treatment. (A). Protein bands of insulin signaling pathway molecules. (B–E). Densitometric analysis of protein expression. (B). Akt. (C). p-Akt. (D). GSK-3β. (E). p-GSK-3β. Data are presented as the mean ± SD (n=3). One-way ANOVA was used for statistical analysis followed by a post hoc least significant difference test or Tamhane’s multiple comparison test. *P<0.05 vs Con group. #P<0.05 vs HFD group. Abbreviations: Akt, protein kinase B; Con, control group; GSK-3β, glycogen synthase kinase 3 beta; HFD, high-fat diet group; HFD + Rev, high-fat diet + resveratrol group. |
Protein expression related to hepatic ERS in mice
Hepatic expression levels of TRIB3 (Figure 6A and B) and ATF-4 (Figure 6A and C) were significantly increased in the HFD group compared with the control group, and resveratrol reduced the expression levels of these two proteins. There was no difference in total PERK protein expression between the three groups (Figure 6A and D). The phosphorylation level of PERK was higher in the HFD group than in the control group, and the level was reduced after resveratrol treatment (Figure 6A and E). Hepatic expression of ATF-6 was significantly lower in HFD mice compared with the control group, and the resveratrol group had increased expression levels of this protein (Figure 6A and F). These findings suggested that the HFD enhanced ERS, which was reduced by resveratrol.
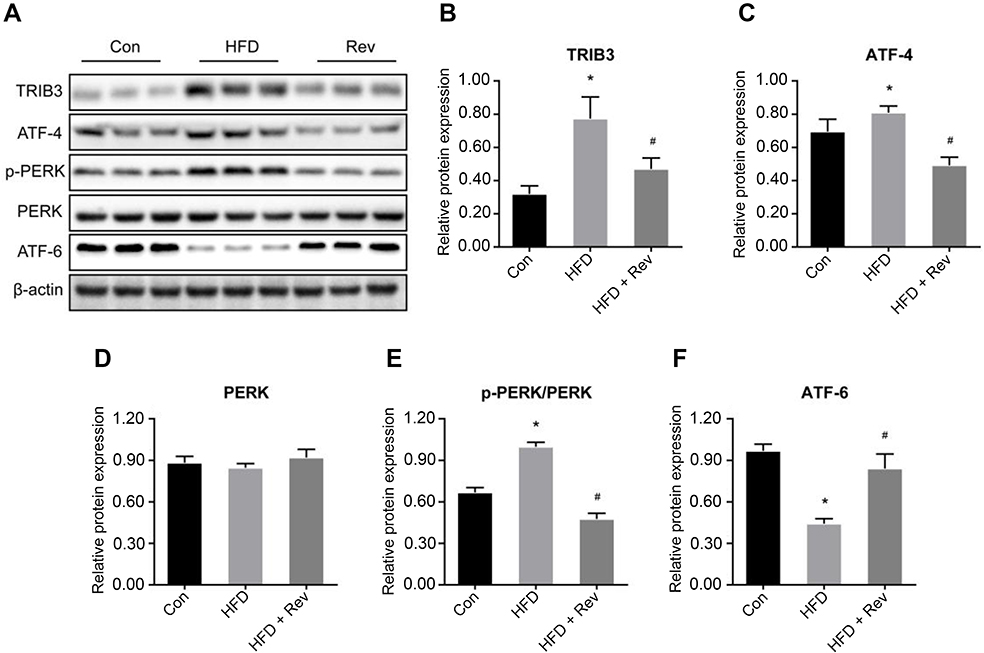 | Figure 6 Relative proteins expression of endoplasmic reticulum stress pathway after resveratrol treatment. (A). Protein bands of endoplasmic reticulum stress pathway molecules. (B–E). Densitometric analysis of protein expression. (B). TRIB3. (C). ATF-4. (D). PERK. (E). p-PERK. (F). ATF6. Data are presented as the mean ± SD (n=3). One-way ANOVA was used for statistical analysis followed by a post hoc least significant difference test or Tamhane’s multiple comparison test. *P<0.05 vs Con group. #P<0.05 vs HFD group.Abbreviations: ATF-4, activating transcription factor 4; ATF-6, activating transcription factor 6; Con, control group; HFD, high-fat diet group; HFD + Rev, high-fat diet + resveratrol group; PERK, protein kinase-like endoplasmic reticulum kinase; TRIB3, tribbles homolog 3. |
Insulin resistant HepG2 cells
The glucose concentration in the medium was measured at 0, 12 and 24 hrs after administration of PA. At 0 and 12 hrs, there were no differences in the glucose concentrations between the two groups. At 24 hrs, the glucose concentration was significantly higher in the PA group than in the control group (Figure 7A), suggesting that insulin resistance was established in vitro.
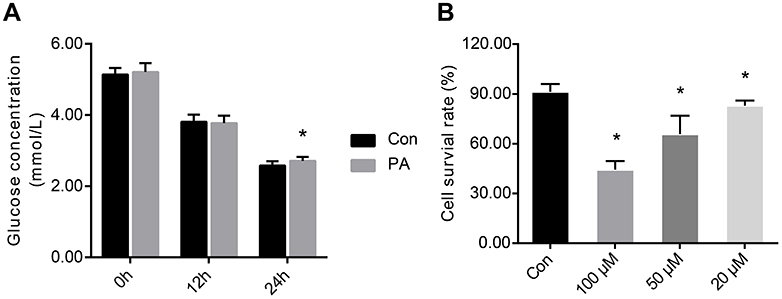 | Figure 7 Establishment of insulin-resistant cell model and cell viability. (A). Establishment of insulin resistant of HepG2 cells. (B). Cell survival rate after 24 hrs of treatment with different concentrations of resveratrol. One-way ANOVA was used for statistical analysis followed by a post hoc least significant difference test or Tamhane’s multiple comparison test. Data are presented as the mean ± SD (n=12). *P<0.05 vs Con group.Abbreviations: Con, control group; PA, palmitic acid group; 100 μM, resveratrol 100 μM group; 50 μM, resveratrol 50 μM group; 20 μM, resveratrol 20 μM group. |
Resveratrol proliferation/cytotoxicity test
The survival rate of the control group of cells was 91.34%. After 24 hrs of treatment with 100, 50 and 20 μM resveratrol, the cell viability was 44.32%, 65.83% and 83.01%, respectively (Figure 7B). These results suggested that high concentrations of resveratrol had a cytotoxic effect on cells.
Insulin signaling pathway protein expression in HepG2 cells
After 24 hrs of PA treatment, there was no significant difference in Akt (Figure 8A and B) and GSK-3β (Figure 8A and D) among groups. The phosphorylation levels of Akt (Figure 8A and C) and GSK-3β (Figure 8A and E) were significantly decreased in HepG2 cells. The phosphorylation level of Akt was not significantly increased in the 100 and 50 μM resveratrol treated compared with untreated PA group. Treatment with at 20 μM resveratrol increased the p-Akt/total Akt ratio value (Ser473). Compared with the PA group, the p-GSK-3β/total GSK-3β ratio value was not significantly increased in the 100 μM resveratrol group and p-GSK-3β (Ser9) was increased after 50 and 20 μM resveratrol treatment. The results suggest that low, rather than higher concentrations of resveratrol had beneficial effects on insulin signaling pathways.
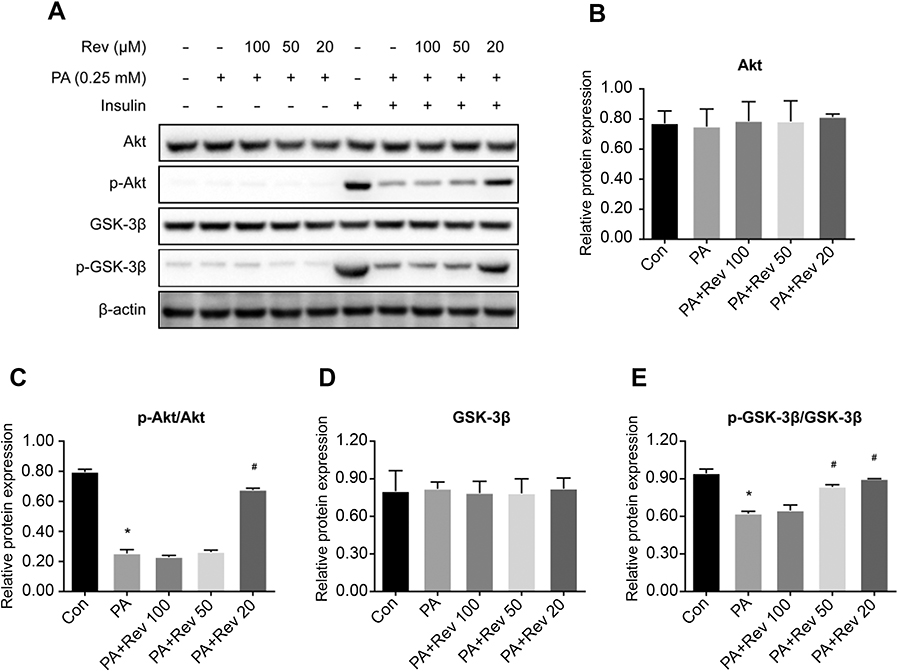 | Figure 8 Relative protein expression of insulin signaling pathway in control, palmitic acid and different concentrations of resveratrol groups. (A). Protein bands of insulin signaling pathway molecules. (B–E). Densitometric analysis of protein expression. (B). Akt. (C). p-Akt. (D). GSK-3β. (E). p-GSK-3β. Data are presented as the mean ± SD (n=3). One-way ANOVA was used for statistical analysis followed by a post hoc least significant difference test or Tamhane’s multiple comparison test. *P<0.05 vs Con group. #P<0.05 vs PA group.Abbreviations: Akt, protein kinase B; Con, control group; GSK-3β, glycogen synthase kinase 3 beta; PA, palmitic acid group; PA + Rev 100, palmitic acid + resveratrol 100 μM group; PA + Rev 50, palmitic acid + resveratrol 50 μM group; PA + Rev 20, palmitic acid + resveratrol 20 μM group. |
ERS pathway protein expression in HepG2 cells
Similar to findings from the animal model, the expression of ERS-related proteins was elevated in the PA group compared with the control group, suggesting that PA increased ERS. Different concentrations of resveratrol had different effects on ERS-related indicators. No significant difference in PERK existed among three groups (Figure 9A and D). Compared with the PA group, 100 μM resveratrol increased the expression levels of p-PERK (Figure 9A and E) and ATF-4 (Figure 9A and C), and decreased the expression of ATF-6 (Figure 9A and F), while the expression of TRIB3 (Figure 9A and B) did not change. Likewise, 50 μM resveratrol increased PERK phosphorylation and ATF-4 levels in PA-treated cells. The expression of other ERS indicators was not significantly different in the PA groups with or without resveratrol treatment. Compared with PA group with no resveratrol (or high concentrations of resveratrol), the expressions levels of p-PERK, ATF-4 and TRIB3 were significantly decreased, and ATF-6 was significantly increased after 20 μM treatment, suggesting that lower concentrations of resveratrol reduced ERS and had beneficial effects on downstream pathways.
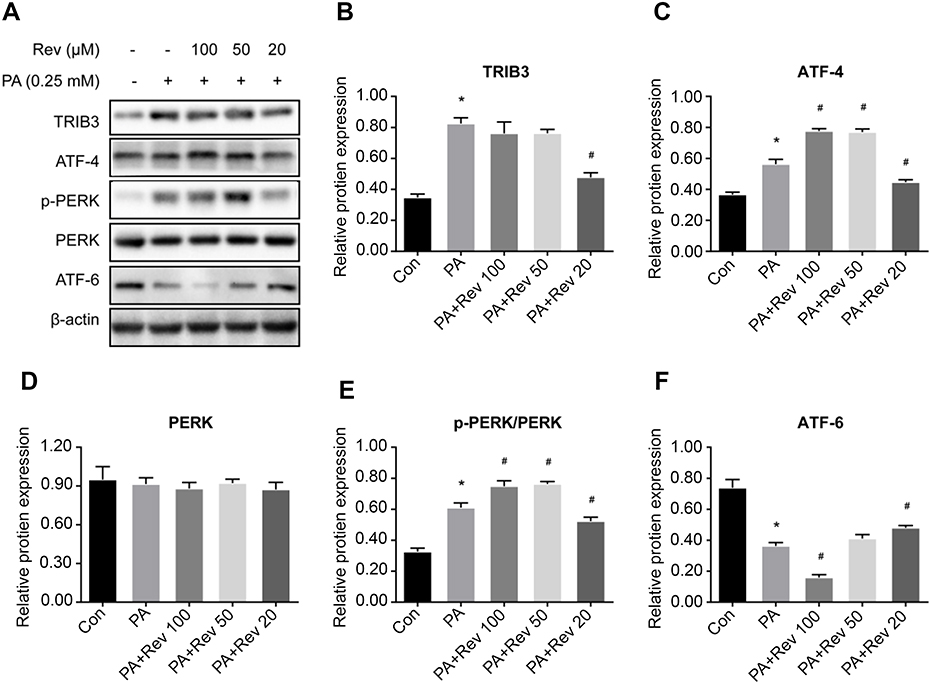 | Figure 9 Relative protein expression of endoplasmic reticulum stress pathway in control, palmitic acid and different concentrations of resveratrol groups. (A). Protein bands of endoplasmic reticulum stress pathway molecules. (B–F). Densitometric analysis of protein expression. (B). TRIB3. (C). ATF-4. (D). PERK. (E). p-PERK. (F). ATF6. Data are presented as the mean ± SD (n=3). One-way ANOVA was used for statistical analysis followed by a post hoc least significant difference test or Tamhane’s multiple comparison test. *P<0.05 vs Con group. #P<0.05 vs PA group.Abbreviations: ATF-4, activating transcription factor 4; ATF-6, activating transcription factor 6; Con, control group; PA, palmitic acid group; PA + Rev 100, palmitic acid + resveratrol 100 μM group; PA + Rev 50, palmitic acid + resveratrol 50 μM group; PA + Rev 20, palmitic acid + resveratrol 20 μM group; PERK, protein kinase-like endoplasmic reticulum kinase; TRIB3, tribbles homolog 3. |
Discussion
In this study, although resveratrol failed to reduce body weight and insulin levels of HFD fed mice, it lowered blood glucose levels, and increased the QUICKI index (used to assess insulin resistance), suggesting an improvement in overall insulin sensitivity. There are several mechanisms by which resveratrol regulates blood glucose levels and improves insulin sensitivity. First, resveratrol can activate the expression of Sirt1 in vivo, which acts downstream of energy deprivation and exerts beneficial effects on glycemic control.19,20 Second, glucose uptake can be stimulated by resveratrol increasing the expression level of glucose transporter 4.21 Third, resveratrol can activate Akt expression, a well-known factor in the insulin signaling.22 Fourth, resveratrol can activate AMP-dependent protein kinase.23
In this study, resveratrol reduced serum cholesterol levels in insulin-resistant mice, but did not significantly affect other lipid profiles. There were some reported differences in the effects of resveratrol on specific blood lipids, which may relate to the subjects (humans or animals), the dose of resveratrol and the duration of treatment, and whether other hypoglycemic or lipid-lowering drugs were used.24,25
The liver is an insulin-sensitive organ, and hepatic disorders of glucose and lipid metabolism may cause various metabolic syndromes. Enhanced phosphorylation of Akt, a central molecule for multiple signaling pathways, promotes glycogen synthesis and glucose transport, thereby enhancing the glucose pathway and lowering blood glucose levels. Phosphorylation of Akt inhibits the phosphorylation of GSK-3β (a direct substrate for Akt) and increases its activity, thereby activating GS and promoting glycogen synthesis. The relative hepatic expression levels of p-Akt and p-GSK-3β to a certain extent represent sensitivity. This study found increased hepatic Akt or GSK phosphorylation ratiosin mice fed a HFD compared with the normal group, suggesting insulin resistance. Resveratrol treatment for 12 weeks increased p-Akt activity and decreased p-GSK-3β activity, indicating increased in glucose utilization and an improvement in insulin sensitivity.
The endoplasmic reticulum acts as an intracellular membranous network structure, integrating cellular signaling and homeostasis. Under conditions that cause ERS, such as mutated or misfolded proteins, inhibited protein glycosylation, glucose and energy deprivation, hypoxia, the unfolded protein reaction (UPR) is activated.26 Physiologically, acute UPR can counteract the adverse effects of ERS to maintain protein homeostasis. When cellular homeostasis is not recovered in a short period of time, long-term chronic UPR can cause a series of pathological events and metabolic disorders through various pathways. The ERS may involve excess nutrients, lipid accumulation and insulin resistance and lead to long-term disturbances in glucose and lipid homeostasis.27 In this study, the expression of ATF-6 protein was significantly lower in the mouse model of insulin resistance than in the control group, while the ATF-4 and p-PERK protein levels were significantly increased. The later may be inhibited by ATF-6, triggering the PERK-ATF-4 pathway that causes stress in the endoplasmic reticulum. After 12 weeks of resveratrol treatment, hepatic ATF-6 expression increased, while ATF-4 expression and PERK phosphorylation were reduced in the insulin resistance model, indicating that resveratrol can relieve ERS to some extent.
The molecule that links ERS and insulin signaling pathway may be Tribble 3 (TRIB3), which is a serine/threonine protein kinase found in Drosophila.28 Studies have shown that TRIB3 inhibited Akt activity and caused elevated blood glucose.29 The ERS activates the ATF-4/CHOP pathway at the transcriptional level to induce TRIB3 expression, and TRIB3, in turn, acts as a negative feedback regulator to inhibit the transcriptional activity of CHOP.30 Our study showed that the expression level of TRIB3 was significantly increased after a HFD or palmitic acid treatment. Moreover, the expression level of TRIB3 decreased with resveratrol treatment, which increased phosphorylated Akt activity in the insulin signaling pathway to improve insulin sensitivity (Figure 10).
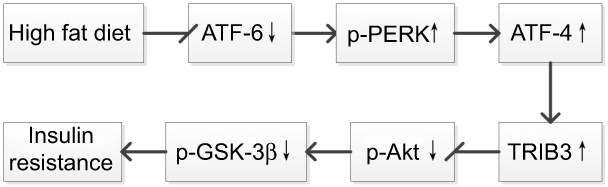 | Figure 10 A schematic diagram Endoplasmic reticulum stress and insulin signaling pathway in insulin resistance.Abbreviations: Akt, protein kinase B; ATF-6, activating transcription factor 6; ATF-4, activating transcription factor 4; GSK-3β, glycogen synthase kinase 3 beta; PERK, protein kinase-like endoplasmic reticulum kinase; TRIB3, tribbles homolog 3. |
HepG2 is one of the earliest isolated and widely used hepatic cell lines with a clear background and stable phenotype/traits, it has been widely used in metabolic diseases, such as insulin resistance or type 2 diabetes,31,32 so we used the HepG2 cell line for this study. In the HepG2 cell model, different concentrations of resveratrol had different effects on insulin sensitivity and ERS-related indicators. Higher concentrations (100 and 50 μM) of resveratrol enhanced insulin resistance and ERS.
A similar dose-dependent effect was observed with the proliferation/cytotoxicity test. The administration of 100 and 50 μM resveratrol reduced viability to 44.32% and 65.83%, respectively. Therefore, it is likely that these cellular cytotoxic effects will enhance both insulin resistance and ERS. In addition, there are many studies reporting the effects of resveratrol on cancer, which may be related to the cellular cytotoxicity of high doses. In our studies, low dose of resveratrol (20 μM) or an appropriate dose of resveratrol exerted a beneficial effect on cells. It is suggested that we should further explore the safe dose of resveratrol.
Conclusion
Resveratrol can reduce the degree of ERS to a certain extent, thereby improving insulin sensitivity in the liver and controlling glucose levels. However, the effective safe dose of resveratrol needs further investigation.
Abbreviation list
Akt, protein kinase B; ATF-4, activating transcription factor 4; ATF-6, activating transcription factor 6; GSK-3β, glycogen synthase kinase 3 beta; PERK, protein kinase-like endoplasmic reticulum kinase; TRIB3, tribbles homolog 3.
Ethics approval
The animal experiment was approved by the Animal Ethics Committee of Hebei General Hospital.
Data availability
The data can be obtained by email request.
Acknowledgments
We sincerely thank the teachers of Clinical Medical Research Centre of Hebei General Hospital who helped us during the experiment. We thank Linquan Yang for responding to reviewers’ and editor’s comments. We thank Charles Allan, Ph.D., from Liwen Bianji, Edanz Editing China (
Author contributions
Hang Zhao performed the experiments, analyzed data and wrote the manuscript. Yunjia Zhang performed experiments and prepared figures. Linyi Shu established the mouse model. Guangyao Song and Huijuan Ma designed the study and edited drafts of the manuscript. All authors contributed to data analysis, drafting or revising the article, gave final approval of the version to be published, and agree to be accountable for all aspects of the work.
Disclosure
The authors report no conflicts of interest in this work.
References
1. Maruthur NM. The growing prevalence of type 2 diabetes: increased incidence or improved survival? Curr Diab Rep. 2013;13(6):786–794. doi:10.1007/s11892-013-0426-4
2. Tangvarasittichai S. Oxidative stress, insulin resistance, dyslipidemia and type 2 diabetes mellitus. World J Diabetes. 2015;6(3):456–480. doi:10.4239/wjd.v6.i3.456
3. Hwa PM, Ji-Sook H. Padina arborescens ameliorates hyperglycemia and dyslipidemia in C57BL/KsJ-db/db mice, a model of type 2 diabetes mellitus. J Med Food. 2015;18(10):1088–1094. doi:10.1089/jmf.2014.3375
4. Chen H, Bai J, Dong F, et al. Hepatic DsbA-L protects mice from diet-induced hepatosteatosis and insulin resistance. FASEB J. 2017;31(6):2314–2326. doi:10.1096/fj.201600985R
5. Mondal AK, Das SK, Varma V, et al. Effect of endoplasmic reticulum stress on inflammation and adiponectin regulation in human adipocytes. Metab Syndr Relat Disord. 2012;10(4):297–306. doi:10.1089/met.2012.0002
6. Ding S, Jiang J, Wang Z, et al. Resveratrol reduces the inflammatory response in adipose tissue and improves adipose insulin signaling in high-fat diet-fed mice. Peerj. 2018;6(1):e5173. doi:10.7717/peerj.5173
7. Liu H, Cao D, Liu H, et al. The herbal medicine cordyceps sinensis protects pancreatic beta cells from streptozotocin-induced endoplasmic reticulum stress. Can J Diabetes. 2016;40(4):329–335. doi:10.1016/j.jcjd.2016.02.001
8. Latreille M, Laberge MK, Bourret G, Yamani L, Larose L. Deletion of Nck1 attenuates hepatic ER stress signaling and improves glucose tolerance and insulin signaling in liver of obese mice. Am J Physiol Endocrinol Metab. 2011;300(3):423–434. doi:10.1152/ajpendo.00088.2010
9. Bain SC, Feher M, Russelljones DL, Khunti K. Management of type 2 diabetes: the current situation and key opportunities to improve care in the UK. Diabetes Obes Metab. 2016;18(12):1157–1166. doi:10.1111/dom.12760
10. Muraki I, Imamura F, Manson JE, et al. Fruit consumption and risk of type 2 diabetes: results from three prospective longitudinal cohort studies. BMJ. 2013;347:f5001. doi:10.1136/bmj.f5001
11. Abbasi OE, Goodarzi MT, Higgins V, Adeli K. Role of resveratrol in the management of insulin resistance and related conditions: mechanism of action. Crit Rev Clin Lab Sci. 2017;54(6):2671–2693.
12. Oyenihi OR, Oyenihi AB, Adeyanju AA, Oguntibeju OO. Antidiabetic effects of resveratrol: the way forward in its clinical utility. J Diabetes Res. 2016;2016:9737483. doi:10.1155/2016/9737483
13. Zeng K, Wang Y, Yang N, et al. Resveratrol inhibits diabetic-induced müller cells apoptosis through MicroRNA-29b/specificity protein 1 pathway. Mol Neurobiol. 2017;54(6):4000–4014. doi:10.1007/s12035-016-9972-5
14. Lee EM, Park I, Lee YJ, et al. Effect of resveratrol treatment on graft revascularization after islet transplantation in streptozotocin-induced diabetic mice. Islets. 2018;10(1):25–39. doi:10.1080/19382014.2017.1414764
15. Zhang H, Ge Z, Tang S, Meng R, Bi Y, Zhu D. Erythropoietin ameliorates PA-induced insulin resistance through the IRS/AKT/FOXO1 and GSK-3β signaling pathway, and inhibits the inflammatory response in HepG2 cells. Mol Med Rep. 2017;16(2):2295–2301. doi:10.3892/mmr.2017.6810
16. Bhatt JK, Thomas S, Nanjan MJ. Resveratrol supplementation improves glycemic control in type 2 diabetes mellitus. Nutr Res. 2012;32(7):537–541. doi:10.1016/j.nutres.2012.06.003
17. Liu K, Zhou R, Wang B, Mi MT. Effect of resveratrol on glucose control and insulin sensitivity: a meta-analysis of 11 randomized controlled trials. Am J Clin Nutr. 2014;99(6):1510–1519. doi:10.3945/ajcn.113.082024
18. Katz A, Nambi SS, Mather K, et al. Quantitative insulin sensitivity check index: a simple, accurate method for assessing insulin sensitivity in humans. J Clin Endocrinol Metab. 2000;85(7):2402–2410. doi:10.1210/jcem.85.7.6661
19. Liu Z, Jiang C, Zhang J, Liu B, Du Q. Resveratrol inhibits inflammation and ameliorates insulin resistant endothelial dysfunction via regulation of AMP-activated protein kinase and sirtuin 1 activities. J Diabetes. 2016;8(3):324–335. doi:10.1111/1753-0407.12296
20. Chen S, Zhao Z, Ke L, et al. Resveratrol improves glucose uptake in insulin-resistant adipocytes via Sirt1. J Nutr Biochem. 2018;55:209–218. doi:10.1016/j.jnutbio.2018.02.007
21. Yonamine CY, Pinheiro-Machado E, Michalani ML, et al. Resveratrol improves glycemic control in type 2 diabetic obese mice by regulating glucose transporter expression in skeletal muscle and liver. Molecules. 2017;22:7.
22. Li J, Huang W, Tu R, Zhong G, Luo B, He Y. Resveratrol rescues hyperglycemia-induced endothelial dysfunction via activation of Akt. Acta Pharmacol Sin. 2017;38(2):182–191. doi:10.1038/aps.2016.109
23. Goh KP, Lee HY, Lau DP, Supaat W, Chan YH, Koh AFY. Effects of resveratrol in patients with type 2 diabetes mellitus on skeletal muscle SIRT1 expression and energy expenditure. Int J Sport Nutr Exerc Metab. 2014;24(1):2–13. doi:10.1123/ijsnem.2013-0045
24. Zhu X, Wu C, Qiu S, Yuan X, Li L. Effects of resveratrol on glucose control and insulin sensitivity in subjects with type 2 diabetes: systematic review and meta-analysis. Nutr Metab. 2017;14(1):60. doi:10.1186/s12986-017-0217-z
25. Haghighatdoost F, Hariri M. Effect of resveratrol on lipid profile: an updated systematic review and meta-analysis on randomized clinical trials. Pharmacol Res. 2018;129:141–150. doi:10.1016/j.phrs.2017.12.033
26. Hetz C. The unfolded protein response: controlling cell fate decisions under ER stress and beyond. Nat Rev Mol Cell Biol. 2012;13(2):89–102. doi:10.1038/nrm3270
27. Zhang XQ, Xu CF, Yu CH, Chen WX, Li YM. Role of endoplasmic reticulum stress in the pathogenesis of nonalcoholic fatty liver disease. World J Gastroenterol. 2014;30(7):1768–1776. doi:10.3748/wjg.v20.i7.1768
28. Großhans J, Wieschaus E. A genetic link between morphogenesis and cell division during formation of the ventral furrow in drosophila. Cell. 2000;101(5):523–531.
29. Fischer Z, Das R, Shipman A, et al. A drosophila model of insulin resistance associated with the human Trib3 Q/R polymorphism. Dis Model Mech. 2017;10(12):1453–1464. doi:10.1242/dmm.030619
30. Ozcan L, Ghorpade DS, Zheng Z, et al. Hepatocyte DACH1 is increased in obesity via nuclear exclusion of HDAC4 and promotes hepatic insulin resistance. Cell Rep. 2016;15(10):2214–2225. doi:10.1016/j.celrep.2016.05.006
31. Chiara V, Giuliana M, Cinzia G, et al. Gluconeogenic signals regulate iron homeostasis via hepcidin in mice. Gastroenterology. 2014;146(4):1060–1069. doi:10.1053/j.gastro.2013.12.016
32. Gong Q, Hu Z, Zhang F, et al. Fibroblast growth factor 21 improves hepatic insulin sensitivity by inhibiting mammalian target of rapamycin complex 1 in mice. Hepatology. 2016;64(2):425–438. doi:10.1002/hep.28523
 © 2019 The Author(s). This work is published and licensed by Dove Medical Press Limited. The full terms of this license are available at https://www.dovepress.com/terms.php and incorporate the Creative Commons Attribution - Non Commercial (unported, v3.0) License.
By accessing the work you hereby accept the Terms. Non-commercial uses of the work are permitted without any further permission from Dove Medical Press Limited, provided the work is properly attributed. For permission for commercial use of this work, please see paragraphs 4.2 and 5 of our Terms.
© 2019 The Author(s). This work is published and licensed by Dove Medical Press Limited. The full terms of this license are available at https://www.dovepress.com/terms.php and incorporate the Creative Commons Attribution - Non Commercial (unported, v3.0) License.
By accessing the work you hereby accept the Terms. Non-commercial uses of the work are permitted without any further permission from Dove Medical Press Limited, provided the work is properly attributed. For permission for commercial use of this work, please see paragraphs 4.2 and 5 of our Terms.