")
Back to Journals » Journal of Inflammation Research » Volume 14
Restraint Stress in Hypertensive Rats Activates the Intestinal Macrophages and Reduces Intestinal Barrier Accompanied by Intestinal Flora Dysbiosis
Authors Wang T , Gao L , Yang Z, Wang F , Guo Y , Wang B , Hua R , Shang H, Xu J
Received 22 December 2020
Accepted for publication 22 February 2021
Published 25 March 2021 Volume 2021:14 Pages 1085—1110
DOI https://doi.org/10.2147/JIR.S294630
Checked for plagiarism Yes
Review by Single anonymous peer review
Peer reviewer comments 3
Editor who approved publication: Professor Ning Quan
Tiantian Wang,1 Lei Gao,2 Zejun Yang,3 Feifei Wang,3 Yuexin Guo,4 Boya Wang,5 Rongxuan Hua,3 Hongwei Shang,6 Jingdong Xu1
1Department of Physiology and Pathophysiology, Basic Medical College, Capital Medical University, Beijing, 100069, People’s Republic of China; 2Department of Biomedical Informatics, School of Biomedical Engineering, Capital Medical University, Beijing, 100069, People’s Republic of China; 3Department of Clinical Medicine, Basic Medical College, Capital Medical University, Beijing, 100069, People’s Republic of China; 4Department of Oral Medicine, Basic Medical College, Capital Medical University, Beijing, 100069, People’s Republic of China; 5Eight Program of Clinical Medicine, Peking University Health Science Center, Beijing, 100081, People’s Republic of China; 6Experimental Center for Morphological Research Platform, Capital Medical University, Beijing, 100069, People’s Republic of China
Correspondence: Jingdong Xu Tel +86-10-83911469
Email [email protected]
Purpose: Hypertension (HTN) is a major risk factor for cardiovascular disease. In recent years, there were numerous studies on the function of stress in HTN. However, the gut dysbiosis linked to hypertension in animal models under stress is still incompletely understood. Purpose of this study is to use multiple determination method to determine the juvenile stage intestinal bacteria, cytokines and changes in hormone levels.
Methods: Four groups of juvenile male spontaneously hypertensive rats (SHRs) and age-matched male Wistar-Kyoto (WKY) rats were randomly selected as control and experimental groups. Rats in the two stress groups were exposed to restraint stress for 3 hours per day for 7 consecutive days. In one day three times in the method of non-invasive type tail-cuff monitoring blood pressure. The detailed mechanism was illuminated based on the intestinal change using immunohistochemical and immunofluorescence staining and the stress-related hormone and inflammation factors were analyzed via ELISA method. The integrity of the epithelial barrier was assessed using FITC/HRP and the expression levels of proteins associated with the tight junction was detected by Western blot. The alteration of stress-related intestinal flora from ileocecal junction and distal colon were also analyzed using its 16S rDNA sequencing.
Results: The results indicate that acute stress rapidly increases mean arterial pressure which is positive correlation to hormone concentration, especially in SHR-stress group. Meanwhile, stress promoted the enhancement of epithelial permeability accompanied with a reduced expression of the tight junction-related protein and the macrophages (M&phis;) aggregation to the lamina propria. There were remarkable significant increase of stress-related hormones and pro-inflammatory factor interleukin (IL)-6 along with a decrease in the diversity of intestinal flora and an imbalance in the F/B ratio.
Conclusion: Our results reveal that stress accompanied with HTN could significantly disrupt the domino effect between intestinal flora and homeostasis.
Keywords: hypertension, restraint stress, intestinal flora, juvenile rat, intestinal barrier, macrophages
Introduction
Hypertension (HTN) has become a global public health concern and is a main risk factor for multiple cerebrovascular, cardiovascular, and kidney diseases.1,2 It arises from the interaction between multiple environmental factors, as well as the latest evidence manifests that the causal relationship with intestinal flora imbalance.3–5 In the United States, the prevalence of HTN after age 20 is about 46%,6 and an approximate 13.7% of hypertensive patients are resistant or refractory to various treatment measures. Part of the neurogenic mechanisms may be a decrease in parasympathetic activity and an increase in sympathetic activity.7 Nevertheless, the mechanisms underlying the therapy-resistant HTN are still ill-informed. As a global health problem, multiple pathways are aware of the vital roles in the development of HTN. And common causes of HTN include high-salt diet, unhealthy lifestyle, genetic predisposition, obesity, and chronic mental stress.8 Despite some significant advances in habitual lifestyle changes and pharmacology, but the prevalence rate of HTN remains high. In recent years, the trend of younger HTN has gradually increased, which is mainly related to long-term stress. With an accelerating pace of life, stress has become the main cause of HTN in youth, which has aroused great concern among scientists.
Modern stressors that always sustained for a long time are closely related to psychological threats (social anxiety, work stress, natural disasters) in our daily life. It has been noted that the adaptive responses to stress prepare individuals for fight or flight mechanism, and stress resulted from current lifestyles could exert a negative influence on the response.3 This can lead to decreased immune functions and the occurrences of diseases such as diabetes, coronary heart disease, renal failure and HTN. Therefore, stress may also activate the sympathetic nervous system (SNS) and the hypothalamic-pituitary-adrenal (HPA) axis, which alternates with immune responses and systemic hormonal,9 thus adversely affecting health. Moreover, it initiates the release of adrenocorticotropic hormone (ACTH), which could stimulate the development of the adrenal cortex and the secretion of glucocorticosteroids and corticosterone (CORT). This also stimulates renal tubular water resorption and therefore increases blood volume and BP. Norepinephrine (NE) is also involved in the regulation of stress response, as it could increase the peripheral resistance to blood flow and consequently result in increased blood pressure.10 Besides the influence mentioned above, restraint stress could also improve the levels of interleukin (IL)-1β in the hippocampus, cerebral cortex, hypothalamus and serum.11
In general, both chronic stress and high basal levels of stress hormones lead to the development of peripheral disease such as intestinal inflammation,12 which was found to be more pronounced in hypertensive rats.13 But the relationship between HTN, bowel, and stress is only incompletely understood and a further understanding of it is the key to controlling HTN. The aim of the investigation is to explore the correlations between inflammatory response, intestinal pathological damage, and intestinal flora variation in rats with HTN along with stress.
Method
Animals and Housing
Four-week-old male spontaneously hypertensive rats (SHRs) and age-matched male Wistar-Kyoto (WKY) rats were purchased from (Laboratory Animal Services Center, Capital Medical University). Rats were cared for and handled in accordance with the National Institutes of Health Guide for the Care and Use of Laboratory Animals (AEEI-2018-086). The rats were acclimated for at least 3 days before the experiments started and were housed in a specific pathogen-free animal facility with 12 h light (7 AM–7 PM): 12 h dark (7 PM–7 AM) cycle and temperature (22 ± 1 °C) with filtered tap water and food pellets (Nutritional composition ratio of food see Supplementary Table S1).
Stress Exposure
All experiments involving rats were divided into four groups as non-stressed control (y-WKY and y-SHR), tube-restraint stress (y-WKY-S and y-SHR-S) in accordance with the regulations. Rat in the two stress groups was exposed to restraint stress for 3 hours per day for 7 days, and the stress sessions started from 2:00 pm to 5:00 pm. Rats in the tube-restraint stress group were exerted with immobilization for 3h stress session using an individual rodent restrainer device per day (14 cm long, 5.8 cm outer diameter; Nanjing Calvin Biotechnology Co., Ltd., China) in a non-traumatic manner. During the period of the stress training, restrained rats were placed in their home cages. BP was measured per 1 h according to the protocol and the tail of the rat was placed on an insulating board lasting 10 minutes in advance and keeps the tail temperature constant for caudal vein blood pressure measurement.14 Animals from the control group which receive no stress were isolated for the same time, but not immobilized when measuring BP, body weight every day and regular cage cleanings.
Blood Pressure Measurement
BP was monitored using a non-invasive tail-cuff method three times continuously one day (Non-Invasive Blood Pressure System, CODA, Kent Scientific Corp, Austin TX, USA). The restraint procedures involved in the tail-cuff method may cause stress to the animal due to prolonged repeated contact, rats were adapted to the blood pressure meter 3 days in advance during the specified treatment period, the restraint limit is 30 minutes per animal to reduce the stress.15 During the formal test, conscious rats were restrained in a warming chamber set at 35°C and allowed to stabilize for 10 minutes before applying tail-cuff and conditioning. Next, measure the mean arterial pressure (MAP), systolic blood pressure (SBP) and diastolic blood pressure (DBP).
Immunohistochemical and Immunofluorescence Staining
After isolation or immobilization, all animals were anesthetized with chloral hydrate (10%, 0.04mL/g, intraperitoneal injection), and 4.0 mL of blood were immediately collected via aortaventralis puncture (See Supplementary Materials for detailed steps). Distal colons collected were fixed with 4% paraformaldehyde for 12 h before embedded in paraffin and sectioned into 5 µm thick slices that were stained with hematoxylin and eosin (H&E, Wuhan Servicebio Technology Co., Ltd., Wuhan, China), Sirius Red staining or Masson’s trichrome staining (Beijing Solarbio Science & Technology Co., Ltd., Beijing, China) respectively. Morphological features of these sections were observed by light microscopy and the number of goblet cells and length of the crypt as well as the thickness of mucosa, muscle and flat luminal surface and collagen fibers were measured using fully automatic digital slice scanning system (3DHISTECH Ltd. Budapest, Hungary and CaseViewer, 3DHISTECH’s advanced slide viewing software). We further observed the collagen fibers through transmission electron microscopy (TEM, HT7700, 80 kV, Hitachi, Tokyo, Japan). The Sirius Red staining sections were mounted and viewed under a polarized light microscope (Olympus BX51, Japan) and dark field images were obtained. The three different sites in the distal colon of each group of six rats were evaluated and the morphological characteristics of the stained colon sections were witnessed by light microscopy. CD68 and CD163 in colon were identified by immunofluorescence using mouse anti-rat CD68 mAb (Abcam, 1:200, Cambridge, UK) and rabbit anti-rat CD163 mAb (GeneTex, 1:200, CA, USA). The tissue sections were incubated with a fluorescein-isothiocyanate-conjugated secondary antibody (1:1000, Invitrogen, Carlsbad, CA, USA) at 4°C refrigerator overnight. Positive cells were blindly observed in 10 HPF/section (×200) and analyzed by the “Image-Pro Plus 6.0” software (IPP, Media Cybernetics Inc., Rockville, MD, USA). The sets of measurements were obtained are area, density and IOD data represent the mean±SEM from three replicates.
Transmission Electron Microscopy of Collagen Fibers
Colon tissue samples were separated and fixed immediately with 2% glutaraldehyde for 2 hours at 4°C, post-fixed with 1% osmium tetroxide, and then dehydrated by ethanol through the following steps: 30% for 10 min, 50% for 10 min, 70% to overnight, 80% 20 min, 90% for 20 min, then the samples were washed three times in 100% ethanol at 20 min/each and two times in acetone at 30 min/each. Infiltration was done by the ratio of resin: acetone at 1:1 for the first hour, ratio of resin: acetone at 2:1 for the second hour, pure resin for another hour, and finally pure resin overnight. The colon samples were embedded in a 70°C oven overnight. Ultrathin sections were cut and stained with uranyl acetate and lead citrate. Epithelial tissue ultrastructure was determined with a transmission electron microscope (Hitachi HT7700, Hitachi Technologies, Tokyo, Japan).
ELISA Analysis
The plasma and tissue level of the stress-associated hormones and cytokines, such as NE, CORT, ACTH, Angiotensin II (Ang II), IL-10, IL-1β, tissue inhibitor of metalloproteinases (TIMP)-1, IL-6, IL-17, and tumor necrosis factor-α (TNF-α), were detected using commercial ELISA Kit (Beijing Ruigebo Biotechnology Co., Ltd., Beijing, China) for simultaneous quantitative measurement. The OD value was measured at 450 nm using a microplate reader (BioTek Instruments, Inc., Winooski, VT, USA) and samples were tested according to the manufacturer’s instructions. An array was run to optimize the plasma dilutions at which the hormones and cytokines would be quantified within the array’s limit of detection (LOD). All plasma samples were diluted 1:1 with sample diluent, then 50 μL of each of diluted samples and prepared standards were gently shaken on the arrays and incubated overnight at 4°C. After washing several times, the antibody mixture was added and the array was gently shaken at room temperature and incubated for 2 hours. Analysis of raw fluorescence data from the Q-Analyzer software for the QAH-INF-3 arrays using Q-Analyzer software (Beijing Ruigebo Biotechnology Co., Ltd., Beijing, China) which was widely used to calculate the concentrations of cytokine in pg/mL based on a seven-point linear regression of the standard curves.16
Western Blot Analysis
The 2-cm distal colon was homogenized with a hand-held homogenizer in the prepared tissue lysis buffer. Total protein was extracted from the colon tissue and analyzed through Pierce BCA assay (Applygen, Beijing, China) to determine its concentration. They were then loaded on polyacrylamide gels and transferred to PVDF membrane (Millipore, MA, USA). The following antibodies were used for immunodetection: anti-claudin-5, anti-occludin and anti-zonula occludens-1 (ZO-1) (1:500, Invitrogen, Carlsbad, CA, USA and the protein bands were visualized with Odyssey imaging system (LI-COR Biosciences, USA)).
Fecal 16S rDNA Sequencing
After one week of restraint stress, fecal samples were collected and subjected to DNA isolation using BioFastspin Soil/Genomic DNA/RNA Extraction Kit (BSC68S1, Bioer Technology Co., Ltd., Hangzhou, China). The amount of DNA was determined by NanoDrop2000 (Thermo Scientific, USA) and stool samples were maintained frozen at −80°C until further analysis was performed. DNA was then followed by PCR amplification and sequenced using MiSeq System (Illumina, Genewiz, LTD, Suzhou, China). The V3-V4 region of the bacteria 16S rDNA gene in each sample were amplified using the bacterial universal primer 338F 5′-barcode-ACTCCTACGGGAGGCAGCA-3′ and 806R 5′-barcode-GGACTACHVGGGTWTCTAAT-3′30, in which the barcode is a six to eight-base sequence unique to each sample. Pyrosequencing was then performed and Bioinformatics Analysis, Operational taxonomic units (OTUs) were clustered with 97% similarity cutoff using UPARSE (version 7.1 http://drive5.com/uparse/). UCHIME is employed to identify and remove the Mosaic sequence, and the classification of each 16S rDNA gene sequence is analyzed using the SILVA 119 16S rDNA database through the RDP classifier (http://rdp.cme.msu.edu/), with a confidence threshold of 70%. OTUs that reached 97% similarity were used for alpha diversity estimation, including richness (Chao I), diversity (Shannon) and Good’s coverage and rarefaction curve analysis using Mothur (Version 1.30.2; www.mothur.org/). The Bray-Curtis distance matrix calculated according to the OTU information of each sample was used for PCoA. LEfSe analysis is a metagenomic analysis method that performs linear discriminant analysis to assess the effect size of each variation-rich taxon or OTU.17
Colonic Barrier Function Assessment
Colonic tissue was opened along the mesenteric border and mounted in Ussing chambers (Physiologic Instruments, San Diego, CA) with an 0.5 cm2 exposing area of the tissue surface to 5 mL of V O2/V CO2 95:5 Krebs-glucose (10 mM) at 37°C. After adapted for 20 minutes, tetrodotoxin (TTX, 0.1 μM, Shanghai Aladdin Biochemical Technology Co., Ltd., Shanghai, China) and indomethacin (Indo, 1μM, Sigma-Aldrich Corp., St. Louis, MO, USA) were added to the basal side, respectively, to inhibit enteric neurons and prostaglandin synthase and sections let they reached a steady-state level for at least 30 minutes before each experiment began.
The paracellular pathway and transcellular pathway were measured as the flux of 4-kDa FITC-dextran (FD-4; 0.5 mg/mL; Sigma-Aldrich Corp., St. Louis, MO, USA) and horseradish peroxidase (HRP; 0.5 mg/mL; Beijing Solarbio Science & Technology Co., Ltd., Beijing, China), respectively. FD-4 and HRP were added to the luminal side, and the samples of 400 μL were collected from the basolateral per 20 min for 2 h and replaced by an equal volume of the corresponding buffer. The concentration of FD-4 was measured using fluorescence at emission 528 nm and excitation 485 nm. 3.3′,5,5′-Tetramethylbenzidine (TMB) was used to detect HRP at absorbance 405 nm.18
Statistical Analysis
Data were expressed as mean±SEM using Prism 8.0, and nonparametric Wilcoxon (two-group comparisons) or Kruskal–Wallis test (multi-group comparisons) was used to determine the significance between different treatment groups. N was the number of animals in each experiment. The statistical differences between control and treatment groups were analyzed using Student’s paired or unpaired t-test when appropriate.
The correlation among plasma cytokine and hormone concentrations for all y-WKY, y-WKY-S, y-SHR, and y-SHR-S animals were determined using Pearson correlation coefficients and p-values were compared between groups with paired Mann-Whitney’ test. Correlation matrices also were displayed as schematic correlograms.19,20 Because each of these cytokines and hormone measurement range widely, the multiple change of its level relative to the reference level was used for the following dynamic analysis, which the dynamics were fitted on the change folds along the time line through locally weighted scatter plot smoothing (LOWESS). The bandwidth (the most important parameter) determined by trial and error is 0.3. All statistical analyses were performed in Stata/SE 12 and open source procedure R 3.2 (https://www.r-project.org/).21
Results
Restraint Stress Leads to Increased Blood Pressure and Decreased Body Weight in Stress Hypertensive Rat Models
To elucidate the co-relationship between the MAP and body weight, the MAP was recorded utilizing non-invasive tail-cuff method undergoing sustained restraint stress for 7 days in a row at the same time point just as the following description in Figure 1A (a,b and c). As shown in Figure 1B, there is a gradual increase in trend accompanied by fluctuations in the MAP, which notably was observed during the process of restraint stress with no significant difference either in the stress group (y-SHR-S, y-WKY-S, p>0.05) and the non-stressed group (y-SHR, y-WKY, p>0.05) of the 4-week old. As it is known that weight loss is generally due to increased metabolism during persistent stress, just as Figure 1C shows, for there is obviously the reduction in weight gain in both groups of y-SHR-S about 16.90% (p<0.01, n=6) and y-WKY-S about 15.70% (p<0.05, n=8) compared to their control groups, respectively. To confirm the co-relationship between MAP and body weight, as shown in Figure 1D, linear regression is adopted, it was found that there was no obvious correlation either the weight of rats and MAP in y-WKY or in y-SHR-S, while there was a positive correlation both body weight and MAP in the y-WKY-S and y-SHR group. The guess is related to its physiological characteristics.
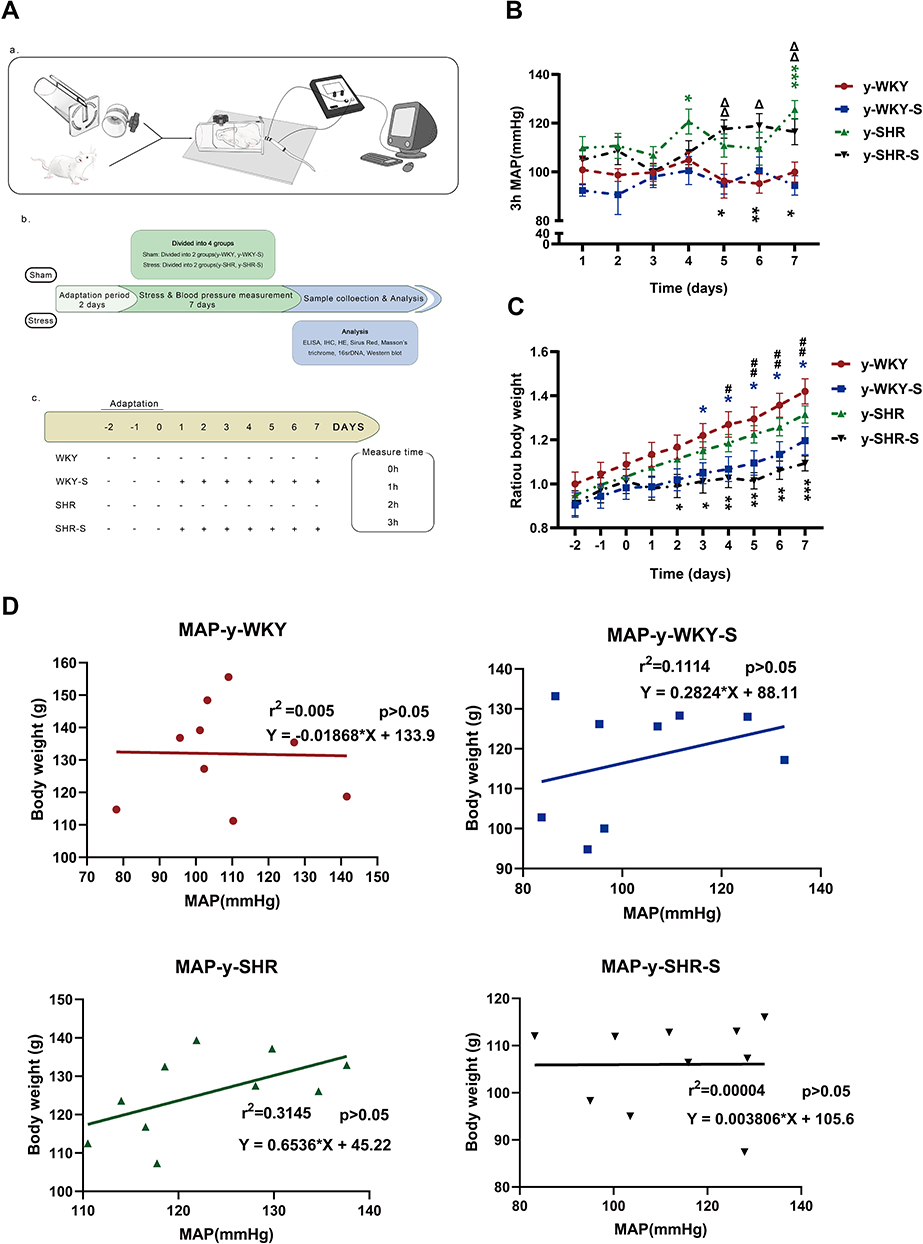 |
Figure 1 Chart showing the changes in MAP, weight and its correlation under restraint stress. (A) Experimental design flow chart: (a) schematic diagram of structural device for measuring blood pressure in caudal vein. (b) Test design and flow chart of test content. (c) Experimental grouping and experimental stress flow pattern diagram. (B) Alone with y-WKY-S rats, y-SHR-S received restraint stress at 3 h per day lasting 7 days were subject to MAP measurement every hour. (C) Representative body weight changes recording at indicated time points are shown. (D) Co-relationship between the MAP and body weight. Data were expressed as mean ± SEM. (n = 6–8 per group). *p < 0.05, **p < 0.01, ***p < 0.001 (Black y-SHR-S vs y-WKY, Blue y-WKY-S vs y-WKY, Green y-SHR vs y-WKY); #p < 0.05, ##p < 0.01 (y-SHR-S vs y-SHR); Δp < 0.05, ΔΔp < 0.01 (y-SHR-S vs y-WKY-S). |
Stress Disrupted the Homeostasis of the Hypothalamic-Pituitary-Adrenal Axis and Causes Systemic Inflammation
In Figure 1B, although restraint stress does not seem to have a significant regulatory effect on changes in MAP in HTN rats, it is obscure what changes in the plasma factor associated with regulating BP.22 As seen in Figure 2A–D, compared with y-WKY, the plasma concentration of ACTH, CORT, NE and Ang II were significantly enhanced in the y-WKY-S rat group from 8.75±0.62 pg/mL to 10.79±0.71 pg/mL by 23% (p<0.05, n=7), from 29.18±1.82 ng/mL to 39.21±4.69 ng/mL by 34% (p<0.05, n=7), from 371.17±54.59 ng/mL to 556.35±53.62 ng/mL by 50% (p<0.05, n=7), and from 159.16±11.97 ng/mL to 243.16±13.25 ng/mL by 53% (p<0.001, n=7) respectively. In particular, the plasma concentrations of ACTH, CORT, NE and Ang II were noteworthy enhanced in the y-SHR-S rat group, from 17.07±0.81 pg/mL to 20.29±0.81 pg/mL by 19% (p<0.05, n=7), from 57.47±5.68 ng/mL to 68.87±7.34 ng/mL by 20% (p>0.05, n=6), from 736.94±89.72 ng/mL to 957.3±15.68 ng/mL by 30% (p<0.05, n=6), and from 240.58±19.69 ng/mL to 339±29.21ng/mL by 41% (p<0.05, n=6), respectively. Strangely, these results seem to indicate that the concentration of plasma factor associated with regulating BP has notably improved in the restraint stress model both in y-WKY and y-SHR without significant enhancement in MAP.
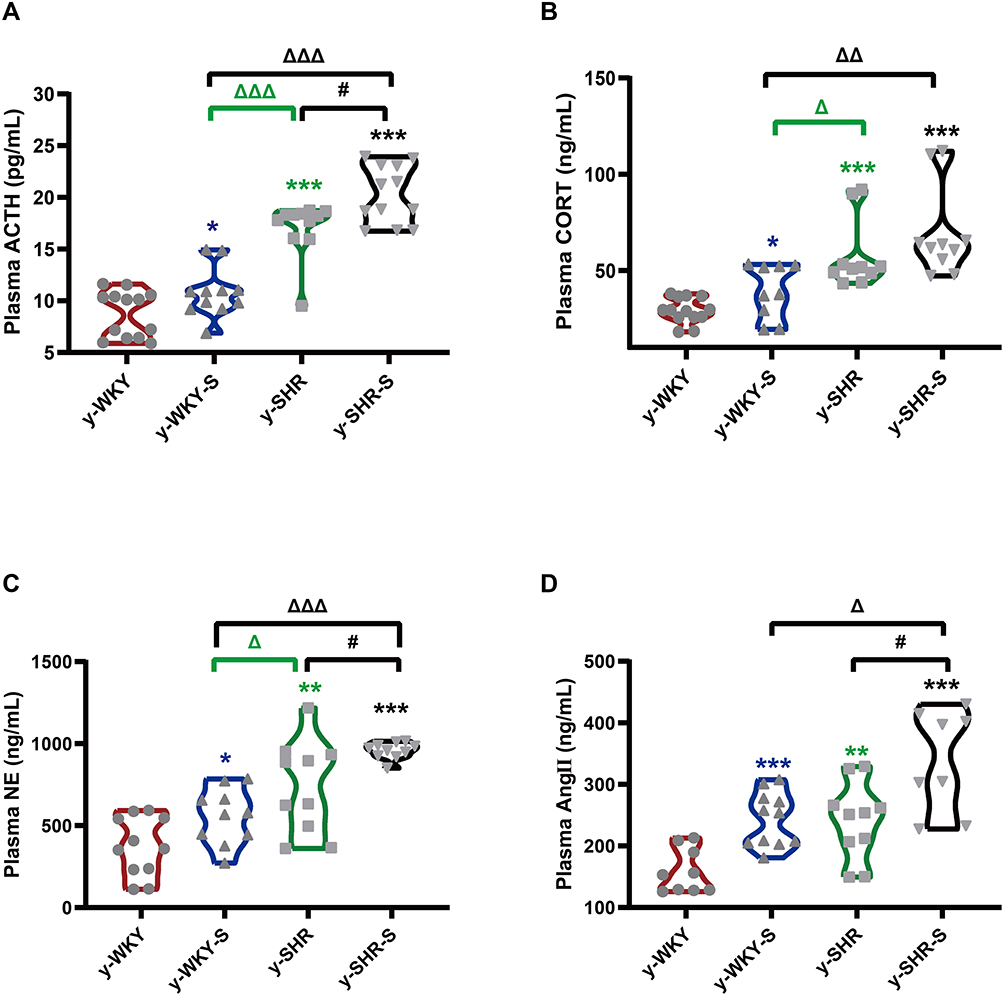 |
Figure 2 Stress-related changes in hormone levels in the plasm. (A–D) The concentrations of ACTH, CORT, NE and Ang II was notable enhancement in the stress-condition than its control group, respectively. *p < 0.05, **p < 0.01, ***p < 0.001 (Black y-SHR-S vs y-WKY, Blue y-WKY-S vs y-WKY, Green y-SHR vs y-WKY); #p < 0.05 (y-SHR-S vs y-SHR); Δp < 0.05, ΔΔp < 0.01, ΔΔΔp < 0.001 (Black y-SHR-S vs y-WKY-S, Green y-SHR vs y-WKY-S). |
Chronic Stress Accelerates the Production of Pro-Inflammatory Cytokines
A tremendous investigation suggested that several pro/anti-inflammatory cytokines are implicated in stress pathogenesis. However, the change in the juvenile rat stress is still vague. These results prompted us to investigate the effect of stress on the production of pro-inflammatory cytokines such as IL-1β, TNF-α, IL-6, IL-10, IL-17 and TIMP-1 using these animals, we analyzed cytokine levels in plasma (Figure 3A–F). Compared with the control group, IL-10, TNF-α and TIMP-1 production levels in the stress-induced group significantly increased in the y-WKY-S from 80.77±5.58 ng/mL to 104.03±7.96 ng/mL by 29% (p<0.05, n=7), from 79.67±4.84 ng/mL to 107.99±5.47 ng/mL by 36% (p<0.01, n=7) and TIMP-1 from 11.85±0.67 ng/mL to 15.90±1.31 ng/mL by 34% (p<0.01, n=7) respectively, except IL-1β and IL-17 (p>0.05, n=7). Meanwhile, all inflammatory-related cytokines mentioned above, except TNF-α, IL-1β and IL-6 (p>0.05, n=6) were sharp enhanced in the y-SHR-S, from 138.13±12.18 ng/mL to 174.43±6.73 ng/mL by 26% (p<0.05, n=6) of IL-10, IL-17 from 60.56±1.18 ng/L to 75.92±3.62 ng/L by 25% (p<0.001, n=6) of IL-17, and from 18.46±0.51 ng/mL to 26.36±1.67 ng/mL by 43% (p<0.001, n=6) of TIMP-1, respectively. Pearson’s correlation coefficient was used to evaluate correspondence between the cytokines and the quantitative trait being examined hormone from four groups. Just as Figure 3G shows, the correlations between cytokine levels and quantitative evaluation indicate that stress can lead to excessive activation of the HPA axis of hypertensive rats and aggravate the systemic inflammatory response. HTN accompanied with stress progression bring about a substantial conversion of the interdependences between cytokines and hormone belonging to functionally diverse classes: the median (0.245 vs 0.267), were considerably different in y-WKY-S and y-WKY (p<0.001). Similarly, there are significant differences between y-SHR-S and y-SHR (0.386 vs 0.228, p<0.05) (Figure 3G). Furthermore, in y-WKY-S, there were 18 (40%) statistically significant correlations between the levels of cytokines and hormone. In section, in y-SHR-S, there were 24 (53.33%) such as correlations.21
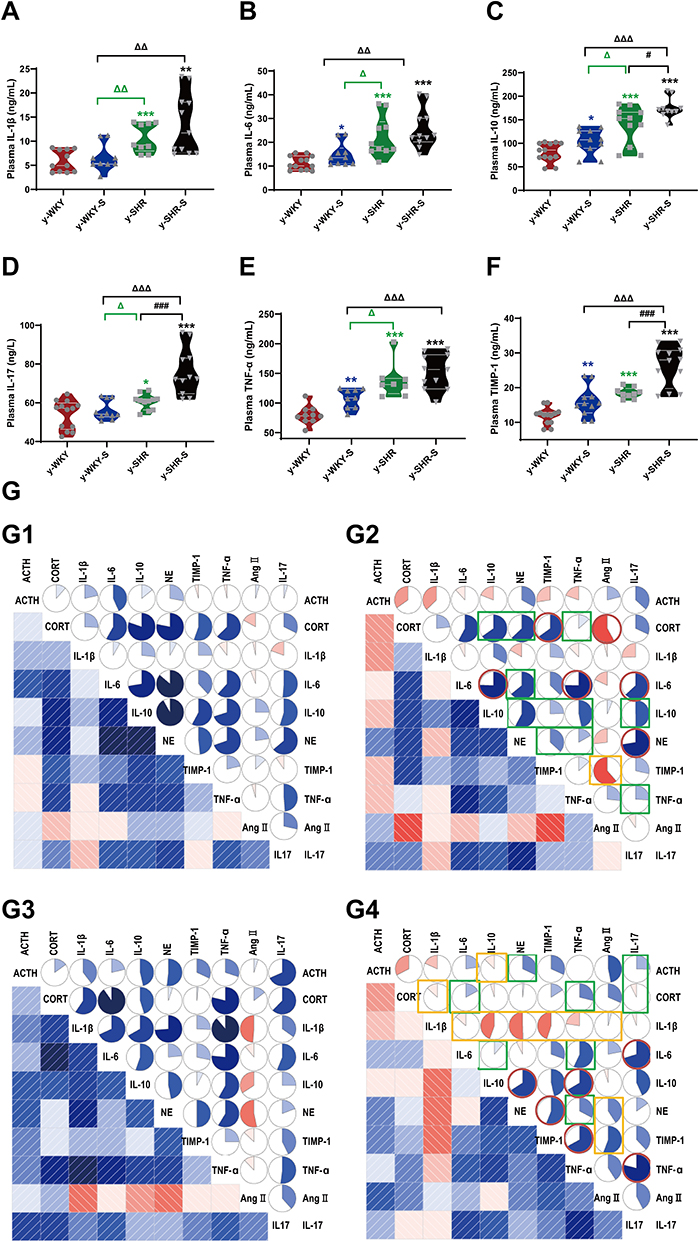 |
Figure 3 Stress-related changes in cytokine levels in plasma and its correlation with the hormone in different group. (A–F) Comparison of plasma cytokine levels in y-WKY, y-WKY-S, y-SHR and y-SHR-S. All data was shown as means ± SEM for each cytokine. Unpaired t-test. (G) Correlograms of the correlations among 10 plasma hormone and cytokine concentrations for (G1) y-WKY, (G2) y-WKY-S, (G3) y-SHR and (G4) y-SHR-S using Pearson correlation coefficients. A blue and red color represent a positive and negative correlation between the two plasma cytokine concentrations that meet at that cell, respectively. The darker and more saturated the color, the greater the magnitude of the correlation. *p < 0.05, **p < 0.01, ***p < 0.001 (Black y-SHR-S vs y-WKY, Blue y-WKY-S vs y-WKY, Green y-SHR vs y-WKY); #p < 0.05, ###p < 0.001 (y-SHR-S vs y-SHR); Δp < 0.05, ΔΔp < 0.01, ΔΔΔp < 0.001 (Black y-SHR-S vs y-WKY-S, Green y-SHR vs y-WKY-S). |
In y-WKY-S compared with y-WKY as Figure 3G1 and G2 shown for CORT, the positive correlation with IL-10, NE and TNF-α were reduced, for NE, the positive correlation with IL-6, IL-10, TIMP-1 and TNF-α were reduced. For IL-10, the positive correlation with IL-17, TNF-α and TIMP-1were decreased. For IL-17, the positive correlation with TNF-α was decreased. But Ang II was significantly negatively correlated with CORT and TIMP-1. However, IL-6 increased positively with IL-10, TNF-α and IL-17, NE increased positively with IL-17, and CORT increased positively with TIMP-1.
Compared with y-SHR (Figure 3G3 and G4), y-SHR-S ACTH has a positive correlation between IL-17 with NE; CORT has a positive correlation with IL-17, TNF-α and IL-6; IL-6 has a positive correlation with TNF-α and IL-10. NE has a positive correlation with TNF-α positive correlation decreases after stress. IL-17 was positively correlated with IL-6 and TNF-α after stress, as was IL-10 with TNF- and NE, and TIMP-1 with NE and TNF-α. And compared with y-WKY-S, there have been a lot of positive and negative correlation changes, such as IL-1β with IL-6, IL-10, NE, TIMP-1, TNF-α and CORT, as well as IL-10 with ACTH, positive correlation becomes negative correlation, but Ang II with IL-1β, NE and TIMP-1 have negative correlation and become positive correlation.
Many organs and tissues have a RAS that acts locally. It has been proven that Ang II can be produced not only from the kidneys, liver, lungs, but also other organs and tissues (such as heart, colon and spleen, et al),23–25 and regulates local blood flow and cell functions through autocrine and paracrine. Cardiovascular Ang II comes from the cardiovascular system itself and is involved in the regulation of vascular tension and local function.26 It is known that cardiovascular-derived Ang II may be involved in the diseases such as hypertension and heart failure during exercise stress, which leads to pathological myocardial hypertrophy. Another investigation showed that chronic restraint stress has an effect on the vasoconstriction response induced by Ang II in the carotid artery of rats.27 In order to further confirm the source of Ang II in our research, the concentration of Ang II from different organs is analyzed by means of ELISA respectively. As seen in Figure S2A–E, the concentration of Ang II was significantly increased in the stress group compared to the control group from the heart, kidney, spleen, liver and colon (p<0.05 or p<0.01). The variation trend of Ang II was consistent with that in plasma.
Histological Alterations Intestinal Tract in Stress Hypertensive Rat Model
Though the revelation of striking investigation, it is certainly believed that stress is closely related to intestinal inflammation and mucosal barrier damage. However, the histological changes in the gut with hypertension accompanied by stress are poorly understood. To verify the potential role of stress on pathology of gut inflammation, the histopathological examination of the distal colon was performed. As shown in Figure 4A1 and A2, after staining with H&E, it is clearly observed that y-WKY-S and y-SHR-S rats had significantly shorter colon length than that of the control group as y-WKY and y-SHR from 160.30±1.78 mm to 150.80±3.96 mm by 5.9% (p<0.05, n=6) and from 148.20±3.38 mm to 135.00±4.47 mm by 8.9% (p<0.05, n=5) respectively. Of particular note, the colonic length in the y-SHR group rats is obviously shorter than that in the y-WKY.
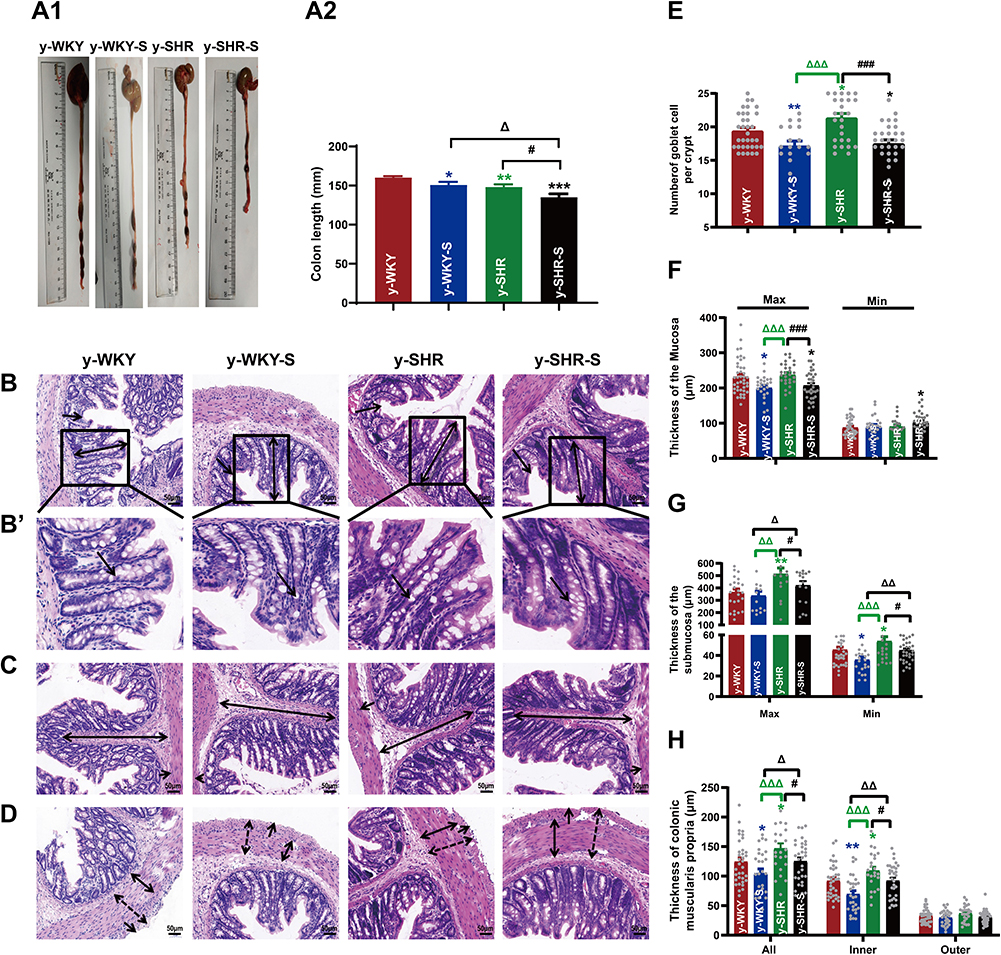 |
Figure 4 Alteration of histopathological structure in the colon of younger restraint stress hypertensive rats from the y-WKY and y-SHR groups. (A1 and A2) Colon was measured the length with a ruler to quantify the effect of restraint stress in different groups. (B–D) Cross-sections of the distal colon were observed at 200× magnification using a light microscope. The length of the mucosa layer and muscle thickness in each tissue were measured using Leica Application Suite. (B and F) were stained with hematoxylin-eosin (HE) to measure the thickness of mucosa layer (Max: double arrows; Min: single arrows), Obtain B’ by zooming in part of B (black frame). (B’and E) The number of goblet cells (arrow) in each intact crypt was decreased in different groups. (C and G) The thickness of submucosa layer (Max: double arrows; Min: single arrows). (D and H) The thickness of muscularis propria layer (All: dotted double arrows; Inner: double arrows; Outer single arrows). Data are mean ± SEM. Unpaired t-test (n = 5–8 per group, choose 8 fields per rat) Scale bar: 50 μm. *p < 0.05, **p < 0.01, ***p < 0.001 (Black y-SHR-S vs y-WKY, Blue y-WKY-S vs y-WKY, Green y-SHR vs y-WKY); #p < 0.05, ###p < 0.001 (y-SHR-S vs y-SHR); Δp < 0.05, ΔΔp < 0.01, ΔΔΔp < 0.001 (Black y-SHR-S vs y-WKY-S, Green y-SHR vs y-WKY-S). |
Stress along with giving restraint, the pathological changes in the distal colon in y-SHR-s and y-WKY-S have overtly aggravated. Just as Figure 4B and E shows, the number of goblet cells substantive attenuation was observed in the colon of y-WKY-S to17.16±0.73/crypt from 19.41±0.48/crypt about 11.59% (p<0.01, n=8) and y-SHR-S to 17.48±0.58/crypt from 21.36±0.65/crypt about 18.16% (p<0.001, n=8), which was observed in the age-matched control y-SHR and y-WKY. Histological parameters of the H&E stained transverse colon of y-WKY and y-SHR were also measured after treatment with restraint stress. In spite of there were a few deviations in the statistical significance of each group, histopathological changes were scrutinized in all groups. As seen in Figure 4C, D, F, G and H shows, the muscle, mucosa and submucosa layer thickness was considerably shorter in the y-WKY-S (p<0.05 or p<0.01, n=5) and y-SHR-S (p<0.05 or p<0.001, n=5) treated in restraint stress hypertensive rat subgroup than that in the y-WKY and y-SHR subgroup respective. Moreover, the highest levels of muscle length were disclosed in the distal colon of y-SHR (Figure 4H) is to 125.25±6.21 μm about 14.78% (p<0.05, n=5) from 146.98±8.58 μm in that of the y-SHR-S, and the muscle length of y-WKY-S is much shorter than that in the y-WKY from 24.41±6.28 μm to 104.81±7.40 μm by 15.75%. Hence, the above-mentioned results indicate that the histopathological structure of colon was resoundingly induced by restraint stress treatment.
To confirm whether fibrotic changes in the colon were involved in the restraint stress condition, all the colonic tissue section was examined by Masson’s trichrome staining, the results from the Figure 5A and E show that the colon manifested marked shrinking stromal collagen deposition in the serosal and subepithelial areas in the y-WKY-S group by 2.48% (p<0.05, n=5) compared with that in the y-WKY group. Intriguing, the Masson’s trichrome positive stromal collagen deposition has a notable enhancement in the y-SHR-S by 3.17% (p<0.05, n=5) compared with that in the y-SHR group. To further reconfirm the phenomenon just as Figure 5B–D shows, the Sirius Red staining with the light microscope and a polarized light microscope and TEM were employed to analyze the Sirius Red positive fibrotic area statistics. Coincidentally, just as Figure 5E and F shows, the Masson’s trichrome and Sirius Red positive fibrosis area shows increased significantly in the y-SHR-S group compared with the y-SHR group, while the collagen fiber area was substantially reduced in the Y-WKY-S group compared with the y-WKY group. To confer further specificity to Sirius red staining, we viewed sections under polarized light, a method of viewing Sirius Red stained thick collagen I, the area of collagen I (Figure 5F) was observed in the colon of y-WKY-S from 9.79% to 6.12% by 3.67% (p<0.05, n=5) and y-SHR-S from 6.06% to 8.79% by 2.73% (p<0.01, n=5). All the variety was authenticated by TEM, as Figure 5D and D’ shows, the collagen fibers of the stressed rats became thicker in the y-SHR-S and thinner in the y-WKY-S. From all above, we can make a speculation that restraint stress could accelerate HTN-associated gut pathological transformation.
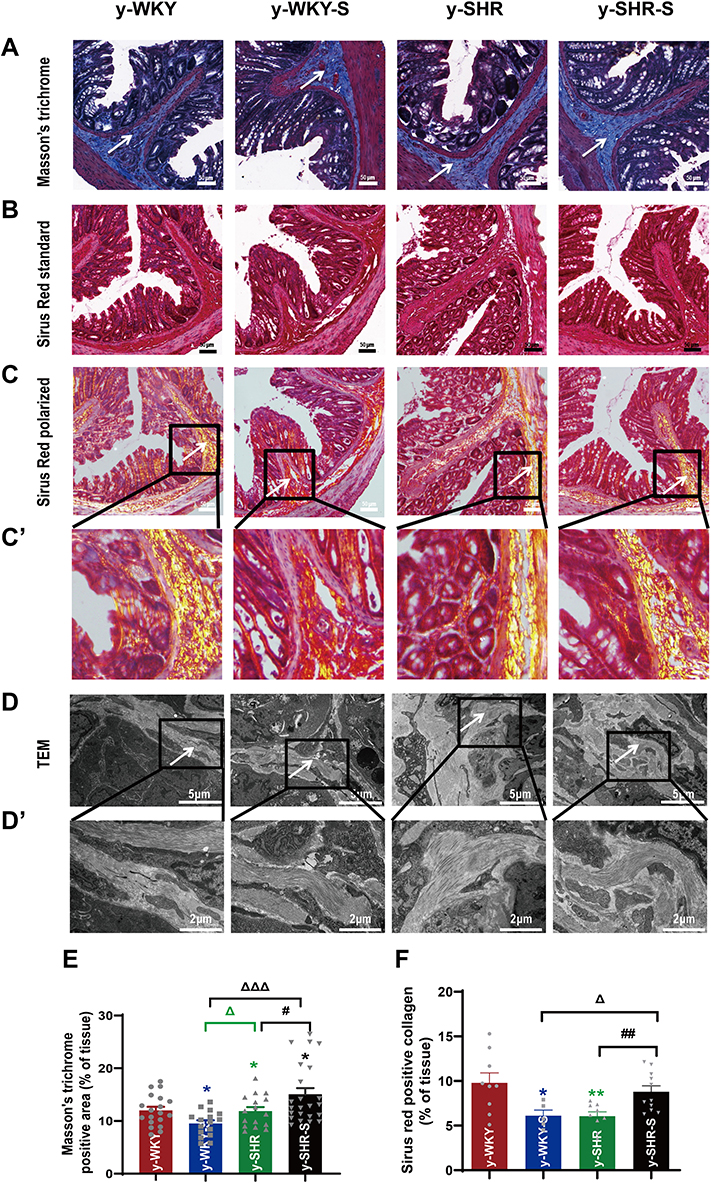 |
Figure 5 Histological evaluation and TEM images of tissues collected from rats in the y-WKY and y-SHR groups alone and their subgroups of y-WKY-S and y-SHR-S. Restraint stress treatment unaltered the fibrosis (white arrow) in the distal colon of the SHRs. (A) Masson’s trichrome staining was performed to evaluate the fibrotic changes in the distal colon of different groups. (B) Sirius Red staining was performed to evaluate the fibrotic changes in the distal colon of different groups with the optical microscope. (C and C’) Observation of Sirius Red staining with polarized light microscope, magnify the part of C to get C’ for further observation of details (black frame). (D and D’) Collagen fiber ultrastructure of a colonic tissues in the four groups, magnify the part of D to get D’ for further observation of details (black frame). (E and F) Scatter plots show the percentage of positive pixel area of collagen in the colon sections from different groups was quantified by the software (IPP). Scale bar: 50 μm. Data were expressed as mean ± SEM, Unpaired t-test (n = 5 per group; choose 5 fields per rat). *p < 0.05, **p < 0.01 (Black y-SHR-S vs y-WKY, Blue y-WKY-S vs y-WKY, Green y-SHR vs y-WKY); #p < 0.05, ##p < 0.01 (y-SHR-S vs y-SHR); Δp < 0.05, ΔΔΔp < 0.001 (Black y-SHR-S vs y-WKY-S, Green y-SHR vs y-WKY-S). |
Restrain Stress Treatment Changes HTN Gut Permeability
Numerous investigations have verified that the stress displayed discontinuation of the maintenance of epithelium integrity. However, the mechanism by which tight junction protein achieves such a homeostasis function in vivo remains obscure. To address this question, we investigated whether the permeability of the colonic mucosa is altered in the restraint stress HTN model using two different reagents like FD-4 and HRP for epithelial permeability of paracellular permeability and transcellular permeability, respectively. As shown in Figure 6A, stress increased paracellular permeability in a time-dependent manner with Ussing chamber incubation. The results indicate that there is some difference between the two groups of y-WKY and y-SHR groups and their subgroup as y-WKY-S and y-SHR-S. Unexpectedly, what is also a worth noticing point is of obvious difference (p<0.05, n=5-8) between the y-WKY-S and y-SHR-S. To test transcellular permeability in a time-dependent manner in all the groups, the results in Figure 6B indicate that there is no difference among all the four groups. From all the results above, HTN may attenuate the tight junctions of cells.
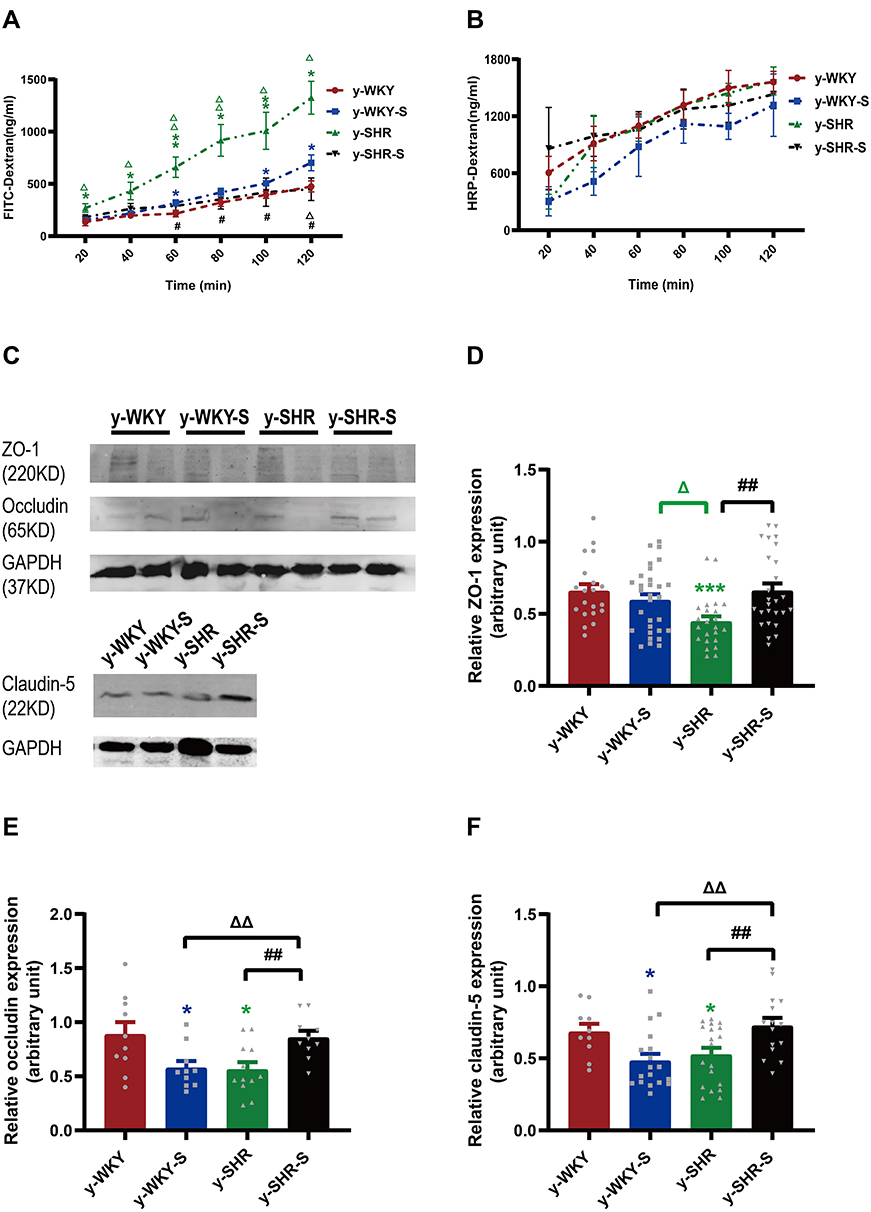 |
Figure 6 Effect of a restrain stress on the barrier function in the colon. (A) Time-dependent changes in FITC-dextran 4000 (FD-4) flux through all subgroups as paracellular pathway for 120 mins. (B) Horseradish peroxidase (HRP) flux (=transcellular pathway) was measured ex vivo. (C) Western blot for TJ proteins. Distal colon was subjected to immunoblotting for ZO-1, occludin, claudin-5 and GAPDH. Representative results of one experiment are shown. Similar results were obtained in three independent experiments: y-WKY group, y-WKY-S group, y-SHR group, y-SHR-S group. (D–F) The intensity of the bands was quantified by scanning densitometry, standardized with respect to ZO-1, occludin, claudin-5 and GAPDH protein and expressed as mean ± SEM. Unpaired t-test, *p < 0.05, ***p < 0.001 (Blue y-WKY-S vs y-WKY, Green y-SHR vs y-WKY); #p < 0.05, ##p < 0.01 (y-SHR-S vs y-SHR); Δp < 0.05, ΔΔp < 0.01 (Black y-SHR-S vs y-WKY-S, Green y-SHR vs y-WKY-S). |
To evaluate the impact of tight junction (TJ) protein on intestinal permeability of hypertensive rats, the Western blot results proved that the proteins expression of claudin-5, occludin and ZO-1 were all drastically reduced in the y-SHR (p<0.05 or p<0.01) compared to the y-WKY; whereas, the expression of these TJ proteins as the occludin and claudin-5 had significantly enhanced colonic tissue of the y-SHR-S group (p<0.01, n=7) compared to the y-SHR. Notably, the TJ protein of y-WKY-S was decreased significantly (p<0.05, n=7) compared to the y-WKY (Figure 6C–F). These results present evidence to fortify the recommendation that moderate restraint stress with established HTN has less effect of colonic permeability. In contrast, non-HTN stress may evince a decrease in TJ proteins and an increase in gut permeability.
Gut Microbiota Alterations in Restraint Stress Rat Model of HTN
Recent studies have shown that the gut microbiota can be strengthened to the pathogenesis of HTN. However, the relationship between the juveniles and stress in the gut microbiota are still blurry. To obtain the testimony, we compared the gut microbiota alterations from colon and ileocecum in the four groups, just as Figures 7 and 8 were shown. The fecal DNA was isolated from 4-week rats, and bacterial loads were expressed as fecal biomass DNA per mg of feces. Compared with y-WKY (y-ic-WKY), the bacterial load in y-SHR (y-ic-SHR) was not significantly reduced in Figures 7A and 8A). And the V3 and V4 hyper-variable regions of the 16S rDNA gene were amplified and analyzed using high-throughput sequencing technology. The compositions of bacterial communities were assessed by calculating two crucial ecological parameters, including Shannon diversity (the combined parameter of richness and evenness) and Chao richness (an estimate of a total number of OTU present in the given community). In the colon and ileocecum, noteworthy fecal microbial variations were identified in the y-SHR when compared with the y-WKY. Microbial richness in Chao index was found to be increased in the y-SHR group compared with the y-WKY control from 344.12±10.82 to 378.98±4.98 by 10.13% (p<0.05, n=4) (Figure 7B), and the microbial richness of y-SHR-S decreases sharply after stress compared with y-SHR from 378.98±4.98 to 354.45±3.87 by 6.5% (p<0.01, n=4). But diversity as the Shannon index has no obviously changed (Figure 7C). In ileocecum, more increase of the microbial richness and diversity were found in the y-ic-SHR group which compared with the y-ic-WKY group as control from 175.04±12.34 to 293.8±5.22 by 67.84% (p<0.01, n=4) and from 1.32±0.37 to 5.20±0.53 by 293.93% (p<0.01, n=4) as shown in Figure 8B and C. As shown in Figure 8B and C the microbial richness and diversity of y-ic-WKY-S increased sharply after stress compares with y-ic-WKY from 175.04±12.34 to 273.69±1.81 by 56.36% (p<0.01, n=4) and from 1.32±0.37 to 5.44±0.41 by 312.12% (p<0.01, n=4).
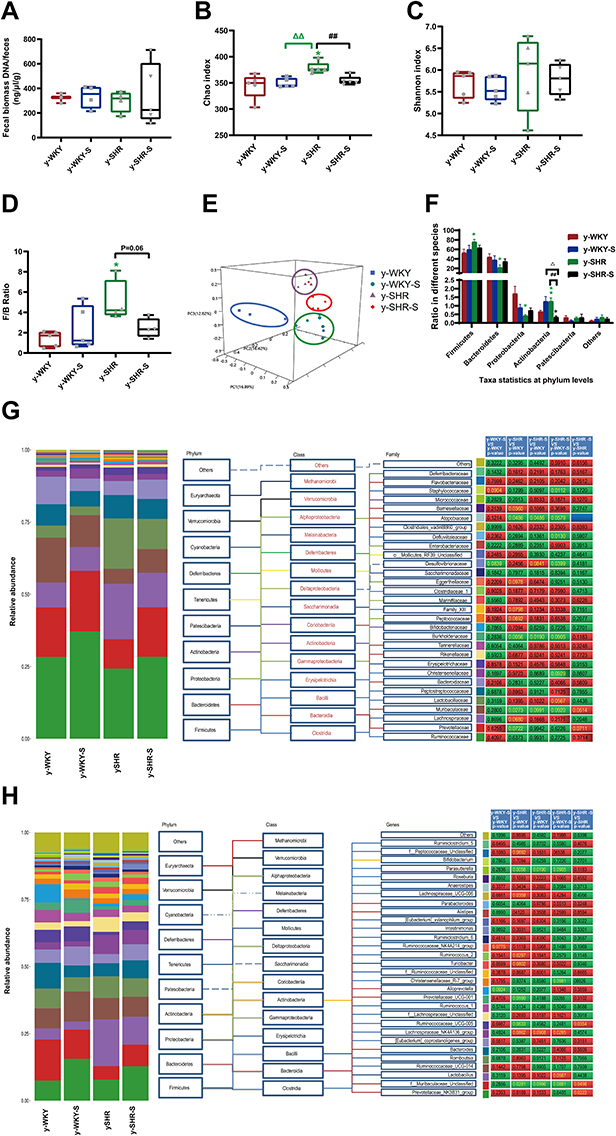 |
Figure 7 Fecal bacterial diversity in colon. Gut microbiota communities in difference groups fecal samples were collected from colon of y-WKY (n=4), y-WKY-S (n=5), y-SHR (n=5) and y-SHR-S (n=5) rats and bacterial 16S rDNA were amplified and sequenced to analyze the compositions of microbial communities. (A–C) Fecal biomass and microbial richness and diversity of different groups were evaluated. (D)The Firmicutes to Bacteroidetes ratio (F/B ratio) was observed between the four clusters. (E) Principal coordinate analysis of different groups. Weighted uniFrac analyses were used to calculate the distances between fecal samples among different groups. Each axis percentage describes how much variation that 1-dimension accounts for. By comparing the samples in a 3-dimensional figure, a clear separation was observed between the four clusters. (F) Phylum breakdown of the five most abundant bacterial communities in the difference groups fecal samples. An increase of Firmicutes along with a decrease of Bacteroidetes resulted in a dysbiosis signature of colon microbiota in y-SHR rats. A significant increment changes of the Actinobacteria phylum correlated with a higher diversity value. (G and H) Differences of the top 30 bacteria between different groups at the level of family and genes, red means increase, green means decrease, blue means no difference. Results were compared by Unpaired t-test; *p < 0.05, **p < 0.01 (Black y-SHR-S vs y-WKY, Green y-SHR vs y-WKY); ##p < 0.01 (y-SHR-S vs y-SHR); Δp < 0.05, ΔΔp < 0.01 (Black y-SHR-S vs y-WKY-S, Green y-SHR vs y-WKY-S). |
 |
Figure 8 Fecal bacterial diversity in ileocecum. Gut microbiota communities in difference groups fecal samples were collected from ileocecum of y-ic-WKY (n=4), y-ic-WKY-S (n=4), y-ic-SHR (n=5) and y-ic-SHR-S (n=5) rats and bacterial 16S rDNA were amplified and sequenced to analyze the compositions of microbial communities. (A–C) Fecal biomass and microbial richness and diversity of different groups were evaluated.(D)The Firmicutes to Bacteroidetes ratio (F/B ratio) was observed between the four clusters. (E) Principal coordinate analysis of different groups. Weighted uniFrac analyses were used to calculate the distances between fecal samples among different groups. Each axis percentage describes how much variation that 1-dimension accounts for. By comparing the samples in a 3-dimensional figure, a clear separation was observed between the four clusters. (F) Phylum breakdown of the five most abundant bacterial communities in the difference groups fecal samples. (G and H) Differences of the top 30 bacteria between different groups at the level of family and genes, Red means increase, green means decrease, blue means no difference. Results were compared by Unpaired t-test; *p < 0.05, **p < 0.01, ***p<0.001 (Black y-ic-SHR-S vs y-ic-WKY, Blue y-ic-WKY-S vs y-ic-WKY, Green y-ic-SHR vs y-ic-WKY); Δp < 0.05 (y-ic-SHR vs y-ic-WKY-S). |
In addition, weighted UniFrac analyses were handled to calculate the distance between the fecal microbial from all four groups, as well as 3-dimensional scatterplots were performed by principal coordinates analysis (PCoA) to examine the difference of microbial communities between different groups. This method provides us to present dissimilarities of the data in the light of distance17 with each PC axis percentage describing how much one dimension could account for, PC1, PC2, and PC3 (colon 16.89%, 16.42%, and 12.62%), (ileocecus 34.51%, 13.24%, and 9.6%). The composition of the fecal microbial communities in different groups was found to be distinct, as presented in Figures 7E and 8E. A significant dissociation was observed in the PCoA between the four clusters, representing the composition of each microbe and indicating four very different intestinal environments.
An augmented F/B ratio stem from an increase of Firmicutes and/or a decrease of Bacteroidetes has been widely recognized as a marker of intestinal malnutrition. As Oyama et al28 have proved that the hypertensive rat model could confer a similar intestinal flora pattern, we analyzed the scales of 16S rDNA reads assigned to each phylum. In colon, as shown in Figure 7D, the F/B ratio in the y-SHR was about 3-fold higher compared with y-WKY (p<0.05, n=4), the F/B ratio of y-SHR-S decreased. In ileocecum shown in Figure 8D, the F/B ratio in the y-ic-SHR was not higher compared with y-ic-WKY, while in the stress group, the F/B ratio of y-ic-SHR-S decreased without statistically significant. Just as shown in Figures 7F and 8F respectively, fecal samples from four groups were dominated by Firmicutes and Bacteroidetes with smaller ratios of Proteobacteria, Actinobacteria and patescibacteria. Nevertheless, dramatic differences were dedicated between the groups in accordance with the relative abundances of Proteobacteria, Actinobacteria, Bacteroidetes and Firmicutes. The enhancement of Actinobacteria proportion means a more varied microbiota in the y-SHR (p<0.05 or p<0.01, n=5), and the proportion decreases in y-SHR-S is in line with the change in Chao richness and Shannon diversity (p<0.01, n=5).
In the process of 16S rDNA sequencing analysis of colon fecal, the first 30 types were compared and analyzed at the family and genus level (Figure 7G and H). It can be seen that the main differences at the family level are Atopobiaceae (Alphaproteobacteria class, Proteobacteria phylum), Desulfovibrionaceae (Deltaproteobacteria class, Proteobacteria phylum), Burkholderiaceae (Gammaproteobacteria class, Proteobacteria phylum) and Muribaculaceae (Bacteroidia class, Bacteroidetes phylum). The main difference at the level of the genus is Parasutterella (Clostridia class, Firmicutes phylum), Lachnospiraceae_NK4A136_group (Clostridia class, Firmicutes phylum) and f_Muribaculaceae_Unclassified (Bacteroidia class, Bacteroidia phylum). However, the fecal sequencing in the ileocecum (Figure 8G and H) can see the main difference at the family level are Family_XIII, Eggerthellaceae, Lachnospiraceae, Ruminococcaceae and Peptostreptococcaceae. The main difference at the genus level is Ruminococcaceae_NK4A214_group, f_Lachnospiraceae_Unclassified, Ruminococcaceae_UCG-014 and Romboutsia, this family and genes belong to Firmicutes phylum Clostridia class. To further discover the changes in the intestinal flora of the colon and ileocecum, we performed Diff_Comparison analysis.
It has become clear that HTN and restraint stress are associated with intestinal flora disruption,4,28–30 and bacterial metabolites play an important part in BP regulation. Using observational data from hypertensive rodents31,32 and humans,33 it was found that compared with their normotensive counterparts, gut dysbiosis because of microbial abundance, richness, diversity and clear taxonomical distinction were reduced. The influence of gut dysbiosis on intestinal microecology is harmful, as it could reshape the intestinal mucosa in rodent models by making it thinner and pathogens are more permeable, and thus bring about persistent low-grade inflammation34 (Figures 4 and 5). Several bacterial taxa were conformed different between normotensive and hypertensive group (Figures 9 and 10).
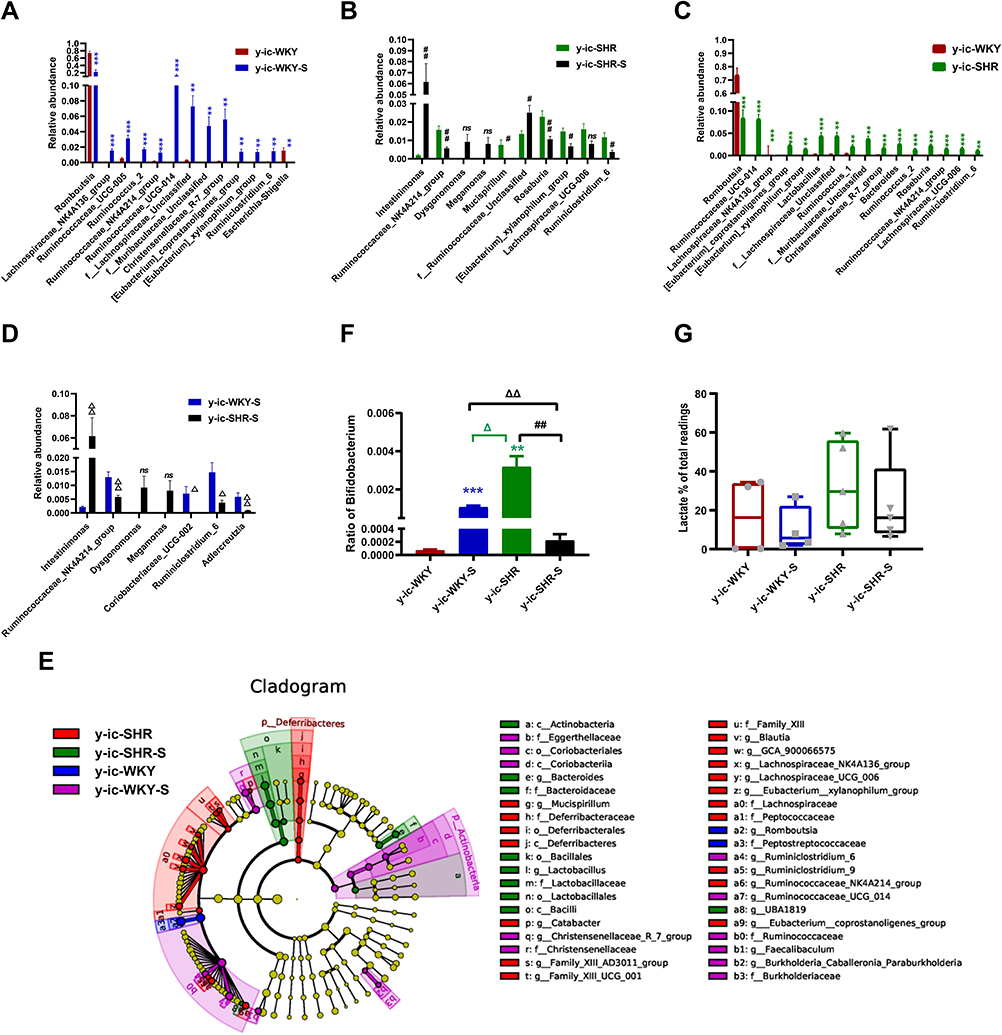 |
Figure 9 Relative abundance of different diversity in different groups from ileocecum (phylogenetic diversity index). (A–D) shown the genus significant differences at the genus level in the different groups (MetaStat). (E) Phylogenetic tree of the linear discriminant analysis (LDA) scores for differentially abundant genera. y-ic-WKY (blue), y-ic-WKY-S (purple), y-ic-SHR (red) and y-ic-SHR-S (green) (LefSe). (F) The relative proportion of Bifidobacterium between different groups. (G) The relative proportions of lactate-producing bacteria in the gut microbiota in difference groups. Sequence reads were classified according to the primary end product of the assigned bacterial genera. Genera were classified into more than one group correspondingly if they were defined as producers of multiple metabolites. Results were compared by Unpaired t-test; **p < 0.01, ***p<0.001 (Blue y-ic-WKY-S vs y-ic-WKY, Green y-ic-SHR vs y-ic-WKY); #p < 0.05, ##p < 0.01 (y-ic-SHR-S vs y-ic-SHR); Δp < 0.05, ΔΔp < 0.01 (Black y-ic-SHR-S vs y-ic-WKY-S, Green y-ic-SHR vs y-ic-WKY-S). |
In the colon, while the relative abundance in genus difference diversity (Phylogenetic Diversity index) is slightly higher in y-WKY than that of the y-SHR alone (Figure 10C, p<0.05), especially f_Muribaculaceae_Unclassified and Ruminococcaceae_UCG-005. The relative abundance of intestinal flora in the y-WKY-S is a slight increase compared to y-WKY (p<0.05 or p<0.01) (Figure 10A), but Alloprevotella was reduced (p<0.01). As Figure 10B shows, after stress treatment in the y-SHR-S rat, some intestinal flora relative abundance had visibly enhanced than that in y-SHR group (p<0.05 or p<0.01), but the relative abundance of Ruminococcus_2 was markedly increased (p<0.01). As Figure 10D shows, after stress treatment in the y-SHR-S rat, some intestinal flora relative abundance including Lactobacillus, Lachnospiraceae_NK4A136_group and Alloprevotella had visibly enhanced than that in y-WKY-S group (p<0.01 or p<0.001), but the relative abundance of was Christensenellaceae_R-7_group, Ruminococcaceae-NK4A214_group and f_Muribaculaceae_Unclassified markedly decreased (p<0.01). These results show that the diversity and composition of intestinal flora were different in different groups.
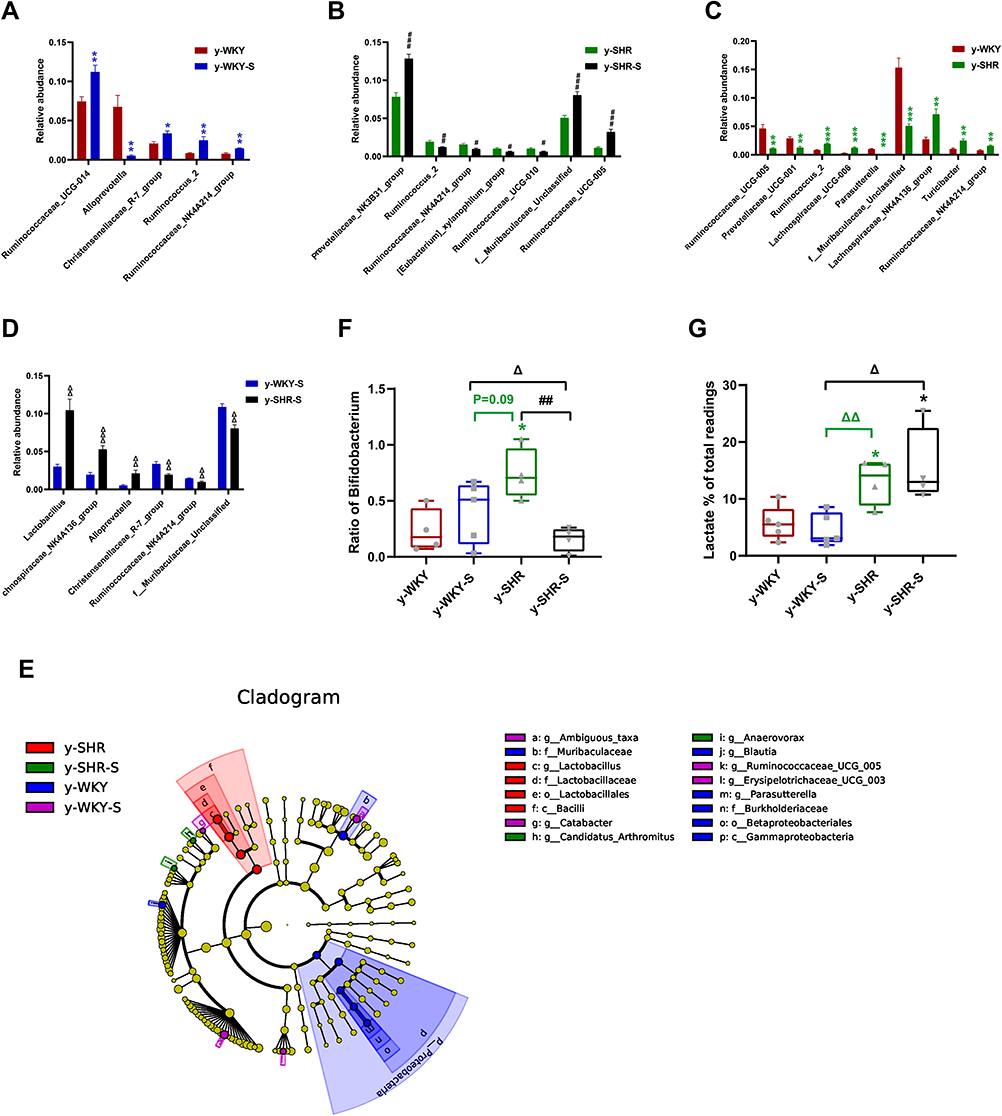 |
Figure 10 Relative abundance of different diversity between different groups in colon (phylogenetic diversity index). (A–D) The genera with significant differences at the genus level in the different groups (MetaStat). (E) Phylogenetic tree of the linear discriminant analysis (LDA) scores for differentially abundant genera. y-WKY (blue), y-WKY-S (purple), y-SHR (red) and y-SHR-S (green) (LefSe). (F) The relative proportion of Bifidobacterium between different groups. (G) The relative proportions of lactate-producing bacteria in the gut microbiota in difference groups. Sequence reads were classified according to the primary end product of the assigned bacterial genera. Genera were classified into more than one group correspondingly if they were defined as producers of multiple metabolites. Results were compared by Unpaired t-test; *p < 0.05, **p < 0.01, ***p < 0.001 (Black y-SHR-S vs y-WKY, Blue y-WKY-S vs y-WKY, Green y-SHR vs y-WKY); #p < 0.05, ##p < 0.01, ###p < 0.001 (y-SHR-S vs y-SHR); Δp < 0.05, ΔΔp < 0.01, ΔΔΔp < 0.001 (Black y-SHR-S vs y-WKY-S, Green y-SHR vs y-WKY-S). |
In ileocecum, the relative abundance in genus difference diversity (Phylogenetic Diversity index) is slightly higher in y-ic-WKY than that in the y-ic-SHR alone (Figure 9C, p<0.05), especial Lachnospiraceae_NK4A136_group, Ruminococcaceae_UCG-005, f_Lachnospiraceae_Unclassified, Ruminococcus_2, Ruminococcaceae_NK4A214_group, f_Muribaculaceae_Unclassified, Ruminococcaceae_UCG-014, Christensenellaceae_R-7_group, [Eubacterium]_xylanophilum_group and Ruminiclostridium_6. The relative abundance of intestinal flora in the y-ic-WKY-S is slight increase compare to y-ic-WKY (p<0.05 or p<0.01) (Figure 9A), but Romboutsia and Escherichia-Shigella were reduced (p<0.01 or p<0.001). As Figure 9B shows, after stress treatment in the y-ic-SHR-S rat, some intestinal flora relative abundance had visibly reduced than that in y-ic-SHR group (p<0.05 or p<0.01), but the relative abundance of Intestinimonas and f_Ruminococcaceae_Unclassified was greatly increased (p<0.05 or p<0.01). As Figure 9D shows, after stress treatment in the y-ic-SHR-S rat, some intestinal flora relative abundance including Ruminococcaceae_NK4A214_group, Coriobacteriaceae_UCG-002, Ruminiclostridium_6 and Adllercreutzia had visibly reduced than that in y-ic-WKY-S group (p<0.05 or p<0.01), but the relative abundance of Intestinimonas was significantly increased (p<0.05 or p<0.01).
To sum up, these researches indicate that gut microbiota could boost the rise in BP and lead to immune system activation in restraint stress surroundings. Despite the mechanisms have not been fully illustrated, one of the possible pathways perhaps via the provocation and increase of renin secretion in the kidney. We need further study to fortify these findings in rodents and were transcribed to humans.
Considering the imbalance of F/B ratio in SHR, we asked what precisely genera of bacteria lead to the microbiota composition modification towards dysbiosis. In colon, LEfSe performed at the genus level confirmed that were revealed to be highly accumulated in y-WKY, including Gammaproteobacteria, Betaproteobacteriales, Burkholderiaceae, Parasutterella and Desulfovibrionales, that all belonged to the Proteobacteria phylum, f_Muribaculaceae belonged Bacteroidetes phylum, g_Blautia belonged to Firmicutes phylum (Figure 10E).
In contrast, c_Bacilli, o_Lactobacillales, f_Lactobacillaceae and g_ Lactobacillus, were in higher quantities in the y-SHR, that they all belong to Firmicutes phylum. g_Ambiguous_taxa belonged to Bacteroidetes phylum, g_Catabacter, g_Ruminococcaceae_UCG-005, and g_Erysipelotrichaceae_UCG-003 was in higher quantities in the y-WKY-S, that belonged to the Firmicutes phylum. g_Candidatus_Arthromitus and g_Anaerovorax belonged to the Firmicutes phylum, were in higher quantities in the y-SHR-S. The abundance of Firmicutes genera were obviously upgraded in the y-SHR. All these changes were considered to be main reason for the enhancement F/B ratio in the y-SHR. Bifidobacterium pertains to the Actinobacteria phylum, which is usually considered a useful bacterial genus and has a pivotal role in the development, maturity and functional regulation of the immune system.35,36 And the depletion of it has been reported in dozens of disease conditions37 is seen as a characteristic of dysbiosis. Notably, a depletion of Bifidobacterium was discovered in the y-SHR-S compared with y-SHR (p<0.01, n=4) (Figure 10F), this immensely diminished proportion of Actinobacteria and thus the decrease of gut microbiota diversity. In contrast, the abundance of lactate-producing bacteria was meaningfully increased in the y-SHR and y-SHR-S (p<0.05, n=4) (Figure 10G). Thus, restraint stress with HTN-linked dysbiosis is considered as an amassing of lactate-producing bacteria and meanwhile a recession of Bifidobacterium.
LEfSe experiment conducted at the genus level in ileocecum showed that microorganisms were highly accumulated in y-ic-WKY, including g_Romboutsia and f_Peptostreptococcaceae are most belonged to the Firmicutes phylum (Figure 9E). In contrast, Deferribacteraceae and g_Mucispirillum etc pertained to Deferribacteres phylum and Family_XIII, f_Lachnospiraceae, g_[Eubacterium]_xylanophilum_group were in higher quantities in the y-ic-SHR, that they belong to Firmicutes phylum. p_Actinobacteria, c_Coriobacteriia, o_Coriobacteriales, f_Eggerthellaceae etc vest in Actinobacteria phylum, f_Burkholderiaceae, g_Burkholderia-Caballeronia belong to Proteobacteria phylum, others belonged to the Firmicutes phylum in the y-ic-WKY-S. c_Actinobacteria belong to Actinobacteria phylum, f_Bacteroidaceae belong to Bacteroidetes phylum, others belonged to the Firmicutes phylum, were in higher quantities in the y-ic-SHR-S. Similarly, consistent with colonic stool sequencing, ileocecum sequencing showed, high consumption of Bifidobacterium was discovered in the y-ic-SHR-S compare with y-ic-SHR (p<0.05, n=4, Figure 9F), and the abundance of lactate-producing bacteria was increased with no significant difference in the y-ic-SHR and y-ic-SHR-S (Figure 9G). Thus, restraint stress with HTN-linked dysbiosis is considered as an amassing of lactate-producing bacteria and meanwhile a recession of Bifidobacterium.
Changes of Intestinal Mφ and Hypertension During Restraint Stress
It is generally considered that high-stress patients are more prone to have HTN than healthy individuals probably because of their increased BP sensitivity to stress. However, recent animal-derived findings have proposed a causal role for disturbance of Mφ-mediated HTN, while its relevance for stress and HTN remains unknown. The present study aimed to assess responses of HTN to restraint stress concerning BP, M1Mφ (CD68+ Mφ). Also, Mφ expression of CD163+ as M2Mφ an anti-inflammatory marker was assessed. Just as shown in Figure 11, examination of y-WKY-S rat subjected showed a significant increase in Mφ cell recruitment in the lamina propria (p<0.001, n=5) as M1 positive cells CD68+ IOD (IOD=area × density) in colon tissues compared to the y-WKY, the IOD from 69.03 to 77.31 about 11.99%, however, the index of area (82.35 vs 75.92), density (0.832 vs 0.838) and IOD (66.33 vs 61.83) value of CD68+ was obvious decreased in y-SHR-S (p<0.01 or p<0.001, n=5) compared with the control group y-SHR (Figure 11A, B–D). Unexpectedly, we found that the IOD of CD163+ as M2 Mφ cells increased in y-WKY-S from 95.06 to 101.15 about 6.41% (p<0.01, n=5), and the indexes of the area (97.59 vs 80.88), density (0.955 vs 0.813) and IOD (116.31 vs 74.43) had sharply decreased in y-SHR-S (p<0.001, n=5) (Figure 11A, E–G). Mφ acted as powerful mediators to mediate inflammation and restrain stress in HTN arteries, and also played important roles in the pathogenesis of HTN and gut dysfunctions.38
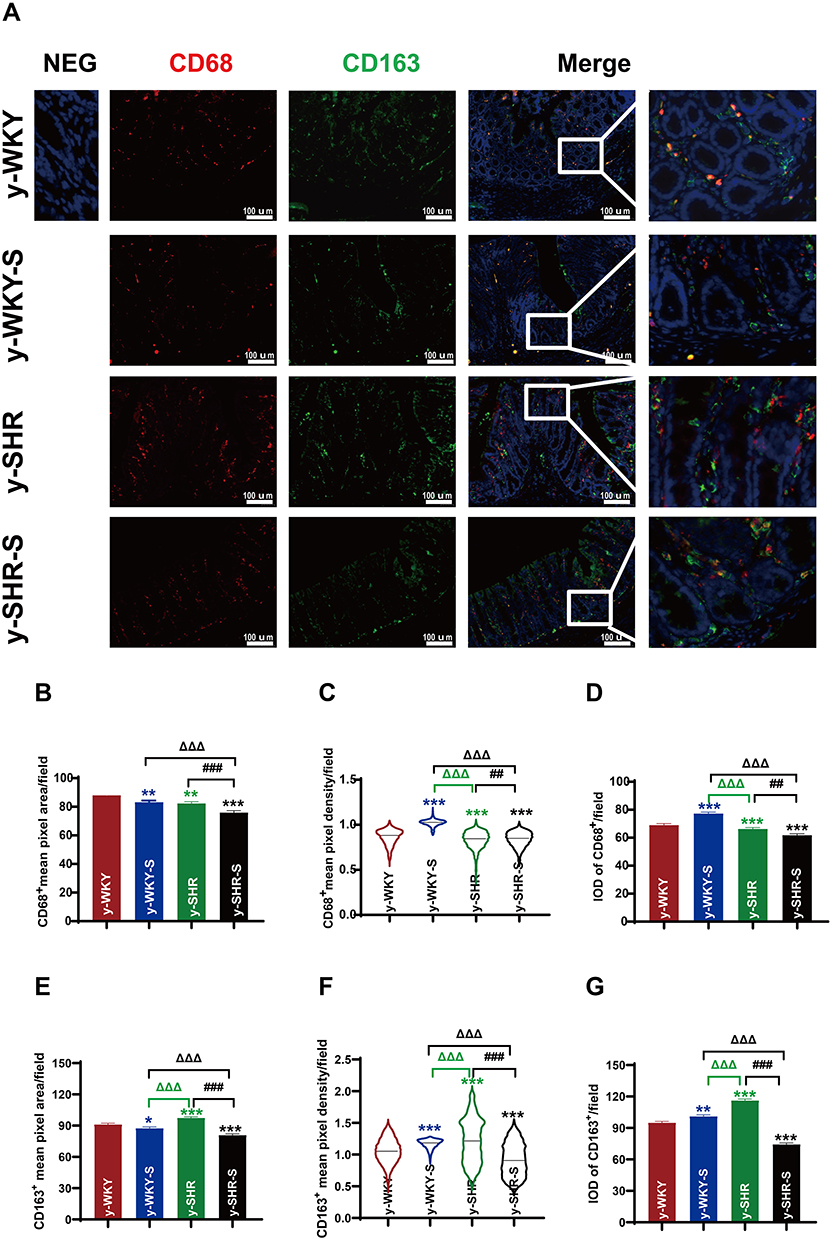 |
Figure 11 Accumulation of macrophages in colon tissues of stressed rat. (A) Immunofluorescence staining for the accumulation of M1Mφ and M2Mφ in colon tissue after 1 week of restraint pressure. The white box is a further enlargement of the partial picture, bar =100 µm. (B–G) Quantitative analysis of M1 and M2-positive cells relative to total nuclear number (IOD=area × density). Data are expressed as mean ± SEM. n = 5 rats expressing the number rats in each group. *p < 0.05, **p < 0.01, ***p < 0.001 (Black y-SHR-S vs y-WKY, Blue y-WKY-S vs y-WKY, Green y-SHR vs y-WKY); ##p < 0.01, ###p < 0.001 (y-SHR-S vs y-SHR); ΔΔΔp < 0.001 (Black y-SHR-S vs y-WKY-S, Green y-SHR vs y-WKY-S). |
Discussion
Essential HTN is strongly correlated with pressure, and strong mental stress is consistently involved in the development of these conditions.3,39 Therefore, we used the restraint stress rat model, that accelerates cardiovascular damage and HTN on account of bondage stress in our study. While mechanisms that regulate intestinal permeability have been widely studied, little is known on how the colon protects itself from restraint stress. In the present investigation, we describe how the restraint stress affects gut structure and microbial composition.
Formed in the 1960s by breeding WKY rats with high BP, the SHR line began developing HTN at the age of about 5-6 weeks.40 They generally arise cardiac failure at 18-24 months and are constantly applied to systemic hypertensive studies.41 With the multitudinous tissue staining and observation method, histological evaluation of the colon of y-WKY-S and y-SHR-S indicated significant differences in the colon compared to the age-matched control y-WKY and y-SHR rats. It can be seen that the content of collagen fibers is significantly reduced in y-WKY-S after stress, which is intriguing significantly increased in y-SHR-S. Due to the stress, the permeability changes y-WKY-S increased and the related proteins ZO-1, claudin-5 and occludin reduced significantly, per contra the permeability of y-SHR-S decreased after stress within the enhancement of content of ZO-1, claudin-5 and occludin. Research has shown that intestinal flora partially promotes Ang II induced vascular dysfunction and HTN partly through supporting a monocyte chemoattractant protein-1 (MCP‐1)/IL‐17 actuated vascular immune cell infiltration and the subsequent inflammation.42–47 Our research further confirmed that the concentrations of Ang II and IL-17 in plasma of y-SHR were higher than that of y-WKY, which aggravated the damage of HTN (Figures 2D and 3F). The results also indicate that the concentration of the TIMP-1 of y-SHR-S is increasing significantly during the stress process (Figure 3F) simultaneously. Beyond doubt that repeated epithelial injuries lead to a large amount of extracellular matrix deposition (ECM, mainly collagen I) to form fibrosis. Epithelial injuries can induce the accumulation and activation of mesenchymal cells (such as fibroblasts and myofibroblasts) accompanied by and the infiltration of inflammatory cell, such as Mφ.48–50 Mφ could secrete matrix metalloproteinases (MMPs) and TIMPs, which have a certain regulatory effect on ECM metabolism.51 Generally recognized as regulators of MMPs, TIMPs are pleiotropic extracellular proteins that affect the cell growth, differentiation, migration and angiogenesis independent of MMPs.52 TIMP-1 is an effective inhibitor of a variety of MMPs, and the decrease in the level of TIMP-1 inhibits fibrotic lesions in ulcerative colitis and Crohn’s disease.53 Similarly, an imbalance due to increased TIMP activity or reduced MMP activity could result in excessive accumulation of ECM with subsequent fibrosis. TIMP-1, mainly derived from fibroblasts, Mφ cells and fibroblasts, can be used as a potential target for tissue remodeling and fibrosis. Therefore, the regulation of the cells is essential for reducing colon fibrosis in patients with inflammatory bowel disease (IBD).54–56 The effect of restraint stress treatment on changes in colonic fibrosis was examined by Sirud Red staining and Masson’s trichrome staining with the observation method of light microscope, polarization microscope and TEM, it is found that there is a clear correlation between increased interstitial collagen and increased plasma concentration of TIMP-1 with morphological and biochemical evidence of ECM accumulation. All these indicate that dysregulated matrix remodeling may be one of the reasons for inhibiting stress and HTN-induced intestinal fibrosis pathology. The apparent characteristics for differences in susceptibility between animals are still unknown, but it would be an interesting topic for future treatment or as an index of HTN or stress-induced organ damage.
Numerous investigations have shown that the restraint stress can damage the intestinal tract through a variety of injuries, or increase intestinal permeability, and lead to intestinal disorders by changing intestinal flora. The mechanisms underlying their harmful effects also include increasing oxidative stress, aggravating fibrosis, enhancing inflammation, even more promoting apoptosis. Santisteban et al57,58 found that impaired intestinal barrier is related to HTN. Since one of the main functions of the intestinal barrier is to prevent systemic entry of pathogen lumen contents, intestinal barrier damage is considered to be one of the major factors in the occurrence of chronic low-grade inflammation and plays a key role in pathogenesis of the occurrence of target organ damage. Therefore, it is necessary to understand the role of intestinal flora in inhibiting stress-related intestinal changes in order to improve HTN control.
The rich microbial community living in the gastrointestinal tract (GI) is considered to be a dynamic organ essential for host metabolism. The latest research found that changes in gut microbiota could serve as an important mediator in the development of HTN in rodents.3,28,31 It was also found that at the phylum level, the majority of gut microbes are Firmicutes and Bacteroidetes, nevertheless, the abundance of Verrucomicrobia, Proteobacteria and Actinobacteria is relatively low.59 The gut microbiota also has close interactions with multiple organ systems and regulates numerous physiological functions. They stimulate the development of the immune system and gastrointestinal tissue in the gastrointestinal tract and are regulated by complex immune system mechanisms that monitor their abundance and diversity. The main microbiota remains similar among most individuals but there is also slight difference from person to person. Several factors, such as genetics,60 dietary patterns,61,62 mental stress39 and geographical region63 could account for the reason, making them both highly dynamic and susceptible to transient changes.57,62 Previous research has investigated the role of gut microbiota in autoimmune, multiple infectious and metabolic diseases, such as IBD, Clostridium difficile infection and diabetes. Thus, beneficial regulation of the gut microbiota is a promising clinical target for many endemic diseases.64,65 While more studies recently in rodents have confirmed that transformations of gut microbiota composition participated in the occurrence of HTN.31,57 The present investigation will research the effect of restraint stress suppression on gut microbiota in HTN.
Long-standing arterial HTN can cause myocardial fibrosis, which contributes to abnormalities of cardiovascular function and seriously affects the prognosis and cure of HTN. Stewart et al66 found that the intestinal muscle layer of SHR rats was thickened and collagen layer deposition was increased. MMP and TIMP are two important factors in the regulation of ECM synthesis and degradation. Among them, MMP-1 mainly degrades the main components of ECM collagen type I and III, and TIMP-1 can inhibit the activity of MMP-1. During intestinal fibrosis, MMP-1 activity decreases, while TIMP-1 activity continues to increase.67 The abnormal wound healing produces an excess of ECM, leading to fibrosis in some organs including the GI tract.68
Furthermore, it can be seen that moderate stress in the juvenile rats could promote the secretion of adrenal catecholamines and glucocorticoids,69 which stimulated TLR4 to produce inflammatory cytokines, including MCP-1, IL-6 and TNF-α, and exacerbate Mφ accumulation, giving rise to altered fecal microbiota.69 As the result in Figures 2,3 and 11 given the powerful evidence.55
IL-10, IL-1β, TIMP-1, IL-6, IL-17 and TNF-α are produced by numerous cells, including Mφ, monocytes, and T- and B-lymphocytes.70–74 Especially, IL-6 TNF-α and IL-1β are quickly produced from M1Mφ in response to infections (eg, microbial, virus) and wounds, for protecting the host by stimulating immune reactions,74 M2Mφ can quickly produce IL-10 and TIMP-1 repair tissue damage and fibrosis to protect the body.75 In our study, the expression of these inflammatory factors increased after hypertensive stress, while the expression of M1Mφ and M2Mφ decreased, which may indicate that other cells are involved.
Studies have shown that germ-free mice develop higher BP and are less responsive to Ang II when receiving fecal transplants from hypertensive patients than normotensive donors.5 We found a novel and significant correlation among HTN, stress and seven microbial taxa at the family and genus levels (Figure 7G and H; Figure 8G and H) where similar findings are relatively rare. Toral, M. and his colleagues4 reported the relationship of the abundance of systolic BP was positive for Turicibacter while negative for S24-7_g that. Wu, Q and his coagents3 indicated that the causal correlation of gut microbiota to stress-induced hypertension is partly regulated, by the HPA axis activity. Similarly, Kim, S and other scientists76 reported several bacterial taxa some correlating with BP. However, significantly, it is first time to report a clear correlation between BP and the abundance of specific bacteria’s relative in stress-linked HTN that a remarkable change in the whole family and genus was witnessed during the experimental process. After stress, more than half of the bacteria belonging to Clostridium at the genus level change.
At the family level of the colon, y-SHR-S after stress compared with y-SHR, Muribacucae (p=0.0514) and Prevotelaceae (p=0.0711) increased. At the genes level, Ruminococcaceae_UCG_005, f_Muribaculaceae_Unclassified and Prevotellaceae_NK3B31_group were increased (p<0.05) (Figure 7G and H). At the family level of ileocecum, y-ic-SHR-S have reduced Eggerthellaceae (p=0.0896) compared with y-ic-SHR after stress, and Ruminococcaceae_NK4A214_group (p=0.0686) at the genes level (Figure 8G and H).
Short-chain fatty acids (SCFAs) are derived from the fermentation or degradation of carbohydrates and proteins by intestinal flora, which are essential for intestinal health.77–79 The most abundant SCFAs in the gut include acetic acid, propionic acid, and butyric acid, while isobutyric acid, valeric acid, and iso-valeric acid are found in lower concentrations.80 Yanling Chang et al proved that the short-chain fatty acids associated with changes in the intestinal microbiome contribute to the development of hypertension in patients with preeclampsia, and butyrate affects (decreased) hypertension, but does not affect normal blood pressure.81 Notably, the changed gut genera Blautia, Eubacterium_group, Anaerostipes, Butyricicoccus,Coprococcus, Roseburia and Butyricimonas found in stress-HTN are mainly butyric acid-producing bacteria, they basically belong to the Firmicutes phylum (Figure S1A–D). It can be seen that the bacteria associated with butyric acid production in the colon and ileocecal feces are mainly Eubacterium_group and Roseburia bacteria, and they have different trends in the stress group and their respective control groups. It can be seen that the Eubacterium_group in the colon and its respective control group have an increasing trend after stress but not statistically significant (Figure S1A), while Eubacterium_group and Roseburia in the ileocecal area change after hypertension and non-hypertension. The trends are not consistent. The two bacteria of y-WKY-S have an increasing trend compared with the control group, but in y-SHR-S, these two bacteria are significantly reduced compared with the control group (p<0.05) (Figure S1C). Similarly, the total content of bacteria related to butyric acid production in the colon did not change significantly (Figure S1B), but the content of y-ic-WKY-S in the ileocecal area increased after stress (p<0.05), while the expression of y-ic-SHR-S decreased after stress (p<0.05) (Figure S1D). Our study, while able to explain microbial variation, has limitations, suggesting that larger groups are needed to capture more differences between test groups. In addition, we found a correlation between BP values and seven taxa under stress, but it failed to reveal the mechanisms by which these particular groups regulate BP, thus contributing to the maintenance of physiological homeostasis. Some investigations also provided other potential mechanisms-involving the immune regulation, gut leakage, as well as the migration of bacterial to kidneys, which may explain mechanistic correlation between stress, HTN, and microecological imbalance.
Conclusions
In this study, there is a direct evidence which is virtual association between HTN and the gut in a stress rat model. The obvious differences were seen in intestinal functions concomitant with an altered level of inflammatory factors and Mφ counts. Notably, HTN with moderate stress could enhance the colonic barrier functions by improving expression of ZO-1, occludin and claudin-5. And beyond that, the relative abundance of 7 taxa of intestinal flora in HTN rats was correlated with stress. The results from all above give us great suggestion that there is a certain correlation among stress, microbiome and BP. Furthermore, alterations in intestinal Mφ and IL-6 may accentuate another aspect of the intricate stress-BP-gut mutuality.
Abbreviations
ACTH, adrenocorticotropic hormone; AngII, Angiotensin II; BP, blood pressure; CORT, corticosterone; DBP, diastolic blood pressure; ECM, extracellular matrix; FD-4, 4-kDa FITC-dextran; GI, gastrointestinal; HPA, hypothalamic-pituitary-adrenal; HTN, hypertension; HRP, horseradish peroxidase; IBD, inflammatory bowel disease; IL-6, interleukin-6; IPP, Image-Pro Plus 6.0 software; LOD, limit of detection; LOWESS, locally weighted scatterplot smoothing; MAP, mean arterial pressure; Mφ, macrophage; MCP, monocyte chemoattractant protein-1; MMP, matrix metalloproteinase; NE, norepinephrine; OTUs, operational taxonomic units; PCoA, principal coordinates analysis; SBP, systolic blood pressure; SHR, spontaneously hypertensive rats; SNS, sympathetic nervous system; TJ, tight junctions; TIMP-1, tissue inhibitor of metalloproteinase-1; TMB, 3,3′,5,5′-tetramethylbenzidine; TNF-α, tumor necrosis factor-α; TTX, tetrodotoxin; Indo, indomethacin; WKY, Wistar Kyoto rats.
Data Sharing Statement
The data in this study generated during and/or analyzed during the current study and Supplementary Information are available from the corresponding author on reasonable request.
Ethics Approval and Consent to Participate
The study was approved by Animal Care and Use Committee of Capital Medical University. Rats were cared for and handled in accordance with the National Institutes of Health Guide for the Care and Use of Laboratory Animals (AEEI-2018-086).
Consent for Publication
All data in the manuscript have not been used and published in any way.
Author Contributions
All authors made a significant contribution to the work reported, whether that is in the conception, study design, execution, acquisition of data, analysis and interpretation, or in all these areas; took part in drafting, revising or critically reviewing the article; gave final approval of the version to be published; have agreed on the journal to which the article has been submitted; and agree to be accountable for all aspects of the work.
Funding
This work was supported by the National Natural Science Foundation of China Grant (No. 81673671, 81274173 JD Xu) and Special National Key Research and Development Plan (No.2016YFC1306305 JD Xu).
Disclosure
The authors declare no financial and non-financial competing interests.
References
1. Brewster LM, van Montfrans GA, Seedat YK. The evidence on the 2018 ESC/ESH guidelines for the management of arterial hypertension in African ancestry patients. J Hypertens. 2019;37(3):650–651. doi:10.1097/HJH.0000000000002024
2. Williams B, Mancia G, Spiering W, et al. 2018 ESC/ESH guidelines for the management of arterial hypertension: the Task Force for the management of arterial hypertension of the European Society of Cardiology and the European Society of Hypertension: the Task Force for the management of arterial hypertension of the European Society of Cardiology and the European Society of Hypertension. J Hypertens. 2018;36(10):1953–2041. doi:10.1097/HJH.0000000000001940
3. Wu Q, Xu Z, Song S, et al. Gut microbiota modulates stress-induced hypertension through the HPA axis. Brain Res Bull. 2020;162:49–58. doi:10.1016/j.brainresbull.2020.05.014
4. Toral M, Robles-Vera I, de la Visitacion N, et al. Role of the immune system in vascular function and blood pressure control induced by faecal microbiota transplantation in rats. Acta Physiol (Oxf). 2019;227(1):e13285. doi:10.1111/apha.13285
5. Jama HA, Kaye DM, Marques FZ. The gut microbiota and blood pressure in experimental models. Curr Opin Nephrol Hypertens. 2019;28(2):97–104. doi:10.1097/MNH.0000000000000476
6. Benjamin EJ, Muntner P, Alonso A, et al. Heart disease and stroke statistics-2019 update: a report from the American Heart Association. Circulation. 2019;139(10):e56–e528. doi:10.1161/CIR.0000000000000659
7. Milovanovic B, Trifunovic D, Djuric D. Autonomic nervous system adjustment (ANSA) in patients with hypertension treated with enalapril. Acta Physiol Hung. 2011;98(1):71–84. doi:10.1556/APhysiol.98.2011.1.9
8. Esler M, Eikelis N, Schlaich M, et al. Chronic mental stress is a cause of essential hypertension: presence of biological markers of stress. Clin Exp Pharmacol Physiol. 2008;35(4):498–502. doi:10.1111/j.1440-1681.2008.04904.x
9. Cox SS, Speaker KJ, Beninson LA, et al. Adrenergic and glucocorticoid modulation of the sterile inflammatory response. Brain Behav Immun. 2014;36:183–192. doi:10.1016/j.bbi.2013.11.018
10. Guajardo HM, Snyder K, Ho A, Valentino RJ. Sex differences in mu-opioid receptor regulation of the rat locus coeruleus and their cognitive consequences. Neuropsychopharmacology. 2017;42(6):1295–1304. doi:10.1038/npp.2016.252
11. Gadek-Michalska A, Tadeusz J, Rachwalska P, Bugajski J. Cytokines, prostaglandins and nitric oxide in the regulation of stress-response systems. Pharmacol Rep. 2013;65(6):1655–1662. doi:10.1016/s1734-1140(13)71527-5
12. Yang EV, Glaser R. Stress-induced immunomodulation and the implications for health. Int Immunopharmacol. 2002;2(2-3):315-324. doi:10.1016/s1567-5769(01)00182-5
13. Takahashi T, Nakade Y, Fukuda H, et al. Daily intake of high dietary fiber slows accelerated colonic transit induced by restrain stress in rats. Dig Dis Sci. 2008;53(5):1271–1277. doi:10.1007/s10620-008-0228-8
14. Seo E, Kang P, Seol GH. Trans-anethole prevents hypertension induced by chronic exposure to both restraint stress and nicotine in rats. Biomed Pharmacother. 2018;102:249–253. doi:10.1016/j.biopha.2018.03.081
15. Wilde E, Aubdool AA, Thakore P, et al. Tail-cuff technique and its influence on central blood pressure in the mouse. J Am Heart Assoc. 2017;6(6). doi:10.1161/JAHA.116.005204
16. Zhang M, Lu Y, Chen Y, Zhang Y, Xiong B. Insufficiency of melatonin in follicular fluid is a reversible cause for advanced maternal age-related aneuploidy in oocytes. Redox Biol. 2020;28:101327. doi:10.1016/j.redox.2019.101327
17. Lu Y, Chen J, Zheng J, et al. Mucosal adherent bacterial dysbiosis in patients with colorectal adenomas. Sci Rep. 2016;6:26337. doi:10.1038/srep26337
18. Cavin JB, Cuddihey H, MacNaughton WK, Sharkey KA. Acute regulation of intestinal ion transport and permeability in response to luminal nutrients: the role of the enteric nervous system. Am J Physiol Gastrointest Liver Physiol. 2020;318(2):G254–G264. doi:10.1152/ajpgi.00186.2019
19. Daraio ME, Francois N, Bernik DL. Correlation between gel structural properties and drug release pattern in scleroglucan matrices. Drug Deliv. 2003;10(2):79–85. doi:10.1080/713840361
20. Feely LC, Davis SS. Correlation of phenylpropanolamine bioavailability with gastrointestinal transit by scintigraphic monitoring of 111In-labeled hydroxypropylmethylcellulose matrices. Pharm Res. 1989;6(4):274–278. doi:10.1023/a:1015986121822
21. Huang X, Liu X, Meyers K, et al. Cytokine cascade and networks among MSM HIV seroconverters: implications for early immunotherapy. Sci Rep. 2016;6:36234. doi:10.1038/srep36234
22. Theodorou V, Beaufrand C, Yvon S, et al. The multicomponent medication Spascupreel attenuates stress-induced gut dysfunction in rats. Neurogastroenterol Motil. 2020;32(5):e13798. doi:10.1111/nmo.13798
23. He L, Du J, Chen Y, et al. Renin-angiotensin system promotes colonic inflammation by inducing TH17 activation via JAK2/STAT pathway. Am J Physiol Gastrointest Liver Physiol. 2019;316(6):G774–G784. doi:10.1152/ajpgi.00053.2019
24. Kumar A, Priyamvada S, Soni V, et al. Angiotensin II inhibits P-glycoprotein in intestinal epithelial cells. Acta Physiol (Oxf). 2020;228(1):e13332. doi:10.1111/apha.13332
25. Pavel J, Terron JA, Benicky J, et al. Increased angiotensin II AT1 receptor mRNA and binding in spleen and lung of AT2 receptor gene disrupted mice. Regul Pept. 2009;158(1–3):156–166. doi:10.1016/j.regpep.2009.09.004
26. Dzau VJ. Tissue renin-angiotensin system: physiologic and pharmacologic implications. Introduction. Circulation. 1988;77(6 Pt 2):I1–3.
27. Coco H, Pernomian L, Pereira PC, et al. Chronic restraint stress increases angiotensin II potency in the rat carotid: role of cyclooxygenases and reactive oxygen species. J Pharm Pharmacol. 2017;69(1):52–65. doi:10.1111/jphp.12659
28. Yang T, Santisteban MM, Rodriguez V, et al. Gut dysbiosis is linked to hypertension. Hypertension. 2015;65(6):1331–1340. doi:10.1161/HYPERTENSIONAHA.115.05315
29. Adnan S, Nelson JW, Ajami NJ, et al. Alterations in the gut microbiota can elicit hypertension in rats. Physiol Genomics. 2017;49(2):96–104. doi:10.1152/physiolgenomics.00081.2016
30. Durgan DJ, Ganesh BP, Cope JL, et al. Role of the gut microbiome in obstructive sleep apnea-induced hypertension. Hypertension. 2016;67(2):469–474. doi:10.1161/HYPERTENSIONAHA.115.06672
31. Li J, Zhao F, Wang Y, et al. Gut microbiota dysbiosis contributes to the development of hypertension. Microbiome. 2017;5(1):14. doi:10.1186/s40168-016-0222-x
32. Mell B, Jala VR, Mathew AV, et al. Evidence for a link between gut microbiota and hypertension in the Dahl rat. Physiol Genomics. 2015;47(6):187–197. doi:10.1152/physiolgenomics.00136.2014
33. Kim S, Goel R, Kumar A, et al. Imbalance of gut microbiome and intestinal epithelial barrier dysfunction in patients with high blood pressure. Clin Sci (Lond). 2018;132(6):701–718. doi:10.1042/CS20180087
34. Agus A, Denizot J, Thevenot J, et al. Western diet induces a shift in microbiota composition enhancing susceptibility to Adherent-Invasive E. coli infection and intestinal inflammation. Sci Rep. 2016;6:19032. doi:10.1038/srep19032
35. Haddad EN, Sugino KY, Tucker RM, Comstock SS. Gut enterotypes are stable during Bifidobacterium and Lactobacillus probiotic supplementation. J Food Sci. 2020;85(5):1596–1604. doi:10.1111/1750-3841.15127
36. Yoshihara T, Oikawa Y, Kato T, et al. The protective effect of Bifidobacterium bifidum G9-1 against mucus degradation by Akkermansia muciniphila following small intestine injury caused by a proton pump inhibitor and aspirin. Gut Microbes. 2020;11(5):1385–1404. doi:10.1080/19490976.2020.1758290
37. Zhang Q, Hu J, Feng JW, et al. Influenza infection elicits an expansion of gut population of endogenous Bifidobacterium animalis which protects mice against infection. Genome Biol. 2020;21(1):99. doi:10.1186/s13059-020-02007-1
38. Karbach SH, Schonfelder T, Brandao I, et al. Gut microbiota promote angiotensin II-induced arterial hypertension and vascular dysfunction. J Am Heart Assoc. 2016;5(9). doi:10.1161/JAHA.116.003698
39. Vagnerova K, Vodicka M, Hermanova P, et al. Interactions between gut microbiota and acute restraint stress in peripheral structures of the hypothalamic-pituitary-adrenal axis and the intestine of male mice. Front Immunol. 2019;10:2655. doi:10.3389/fimmu.2019.02655
40. Okamoto K, Aoki K. Development of a strain of spontaneously hypertensive rats. Jpn Circ J. 1963;27:282–293. doi:10.1253/jcj.27.282
41. Pinto YM, Paul M, Ganten D. Lessons from rat models of hypertension: from Goldblatt to genetic engineering. Cardiovasc Res. 1998;39(1):77–88. doi:10.1016/s0008-6363(98)00077-7
42. Wenzel P, Knorr M, Kossmann S, et al. Lysozyme M-positive monocytes mediate angiotensin II-induced arterial hypertension and vascular dysfunction. Circulation. 2011;124(12):1370–1381. doi:10.1161/CIRCULATIONAHA.111.034470
43. Harrison DG, Marvar PJ, Titze JM. Vascular inflammatory cells in hypertension. Front Physiol. 2012;3:128. doi:10.3389/fphys.2012.00128
44. De Ciuceis C, Amiri F, Brassard P, et al. Reduced vascular remodeling, endothelial dysfunction, and oxidative stress in resistance arteries of angiotensin II-infused macrophage colony-stimulating factor-deficient mice: evidence for a role in inflammation in angiotensin-induced vascular injury. Arterioscler Thromb Vasc Biol. 2005;25(10):2106–2113. doi:10.1161/01.ATV.0000181743.28028.57
45. Ishibashi M, Hiasa K, Zhao Q, et al. Critical role of monocyte chemoattractant protein-1 receptor CCR2 on monocytes in hypertension-induced vascular inflammation and remodeling. Circ Res. 2004;94(9):1203–1210. doi:10.1161/01.RES.0000126924.23467.A3
46. Bush E, Maeda N, Kuziel WA, et al. CC chemokine receptor 2 is required for macrophage infiltration and vascular hypertrophy in angiotensin II-induced hypertension. Hypertension. 2000;36(3):360–363. doi:10.1161/01.hyp.36.3.360
47. Crowley SD. The cooperative roles of inflammation and oxidative stress in the pathogenesis of hypertension. Antioxid Redox Signal. 2014;20(1):102–120. doi:10.1089/ars.2013.5258
48. Wynn TA. Cellular and molecular mechanisms of fibrosis. J Pathol. 2008;214(2):199–210. doi:10.1002/path.2277
49. Kendall RT, Feghali-Bostwick CA. Fibroblasts in fibrosis: novel roles and mediators. Front Pharmacol. 2014;5:123. doi:10.3389/fphar.2014.00123
50. Wick G, Grundtman C, Mayerl C, et al. The immunology of fibrosis. Annu Rev Immunol. 2013;31:107–135. doi:10.1146/annurev-immunol-032712-095937
51. Wynn TA, Barron L. Macrophages: master regulators of inflammation and fibrosis. Semin Liver Dis. 2010;30(3):245–257. doi:10.1055/s-0030-1255354
52. Arpino V, Brock M, Gill SE. The role of TIMPs in regulation of extracellular matrix proteolysis. Matrix Biol. 2015;44–46:247–254. doi:10.1016/j.matbio.2015.03.005
53. Lawrance IC, Rogler G, Bamias G, et al. Cellular and molecular mediators of intestinal fibrosis. J Crohns Colitis. 2017;11(12):1491–1503. doi:10.1016/j.crohns.2014.09.008
54. Suga H, Rennert RC, Rodrigues M, et al. Tracking the elusive fibrocyte: identification and characterization of collagen-producing hematopoietic lineage cells during murine wound healing. Stem Cells. 2014;32(5):1347–1360. doi:10.1002/stem.1648
55. Arihiro S, Ohtani H, Hiwatashi N, et al. Vascular smooth muscle cells and pericytes express MMP-1, MMP-9, TIMP-1 and type I procollagen in inflammatory bowel disease. Histopathology. 2001;39(1):50–59. doi:10.1046/j.1365-2559.2001.01142.x
56. Kuroda N, Masuya M, Tawara I, et al. Infiltrating CCR2(+) monocytes and their progenies, fibrocytes, contribute to colon fibrosis by inhibiting collagen degradation through the production of TIMP-1. Sci Rep. 2019;9(1):8568. doi:10.1038/s41598-019-45012-6
57. Santisteban MM, Qi Y, Zubcevic J, et al. Hypertension-linked pathophysiological alterations in the gut. Circ Res. 2017;120(2):312–323. doi:10.1161/CIRCRESAHA.116.309006
58. Jaworska K, Huc T, Samborowska E, et al. Hypertension in rats is associated with an increased permeability of the colon to TMA, a gut bacteria metabolite. PLoS One. 2017;12(12):e0189310. doi:10.1371/journal.pone.0189310
59. Human Microbiome Project C. Structure, function and diversity of the healthy human microbiome. Nature. 2012;486(7402):207–214. doi:10.1038/nature11234.
60. Turnbaugh PJ, Hamady M, Yatsunenko T, et al. A core gut microbiome in obese and lean twins. Nature. 2009;457(7228):480–484. doi:10.1038/nature07540
61. Fan W, Huo G, Li X, Yang L, Duan C. Impact of diet in shaping gut microbiota revealed by a comparative study in infants during the six months of life. J Microbiol Biotechnol. 2014;24(2):133–143. doi:10.4014/jmb.1309.09029
62. De Filippo C, Cavalieri D, Di Paola M, et al. Impact of diet in shaping gut microbiota revealed by a comparative study in children from Europe and rural Africa. Proc Natl Acad Sci U S A. 2010;107(33):14691–14696. doi:10.1073/pnas.1005963107
63. Martinez I, Stegen JC, Maldonado-Gomez MX, et al. The gut microbiota of rural Papua New Guineans: composition, diversity patterns, and ecological processes. Cell Rep. 2015;11(4):527–538. doi:10.1016/j.celrep.2015.03.049
64. Imterat M, Wainstock T, Landau D, Walfisch A, Sheiner E. Maternal chronic hypertension elevates the risk for long-term selected endocrine and metabolic morbidity in the offspring, particularly child obes. Child Obes. 2020;16:421–427. doi:10.1089/chi.2019.0304
65. Jain RB. Impact of the co-occurrence of obesity with diabetes, anemia, hypertension, and albuminuria on concentrations of selected perfluoroalkyl acids. Environ Pollut. 2020;266(Pt 2):115207. doi:10.1016/j.envpol.2020.115207
66. Stewart DC, Rubiano A, Santisteban MM, et al. Hypertension-linked mechanical changes of rat gut. Acta Biomater. 2016;45:296–302. doi:10.1016/j.actbio.2016.08.045
67. Medina C, Santos-Martinez MJ, Santana A, et al. Transforming growth factor-beta type 1 receptor (ALK5) and Smad proteins mediate TIMP-1 and collagen synthesis in experimental intestinal fibrosis. J Pathol. 2011;224(4):461–472. doi:10.1002/path.2870
68. Rieder F, Brenmoehl J, Leeb S, Scholmerich J, Rogler G. Wound healing and fibrosis in intestinal disease. Gut. 2007;56(1):130–139. doi:10.1136/gut.2006.090456
69. Uchida Y, Takeshita K, Yamamoto K, et al. Stress augments insulin resistance and prothrombotic state: role of visceral adipose-derived monocyte chemoattractant protein-1. Diabetes. 2012;61(6):1552–1561. doi:10.2337/db11-0828
70. Park JB, Peters R, Pham Q, Wang TTY. Javamide-II inhibits IL-6 without significant impact on TNF-alpha and IL-1beta in macrophage-like cells. Biomedicines. 2020;8(6):138. doi:10.3390/biomedicines8060138
71. Murakami M, Kamimura D, Hirano T. Pleiotropy and specificity: insights from the interleukin 6 family of cytokines. Immunity. 2019;50(4):812–831. doi:10.1016/j.immuni.2019.03.027
72. Kim HK, Garcia AB, Siu E, et al. Macrophage migration inhibitory factor regulates innate γδ T-cell responses via IL-17 expression. FASEB J. 2019;33(6):6919–6932. doi:10.1096/fj.201802433R
73. Wu X, Xu W, Feng X, et al. TNF-a mediated inflammatory macrophage polarization contributes to the pathogenesis of steroid-induced osteonecrosis in mice. Int J Immunopathol Pharmacol. 2015;28(3):351–361. doi:10.1177/0394632015593228
74. Kim GW, Lee NR, Pi RH, et al. IL-6 inhibitors for treatment of rheumatoid arthritis: past, present, and future. Arch Pharm Res. 2015;38(5):575–584. doi:10.1007/s12272-015-0569-8
75. Vega-Galaviz D, Vecchyo-Tenorio GD, Alcantara-Suarez R, et al. M2 macrophage immunotherapy abolishes glucose intolerance by increasing IL-10 expression and AKT activation. Immunotherapy. 2020;12(1):9–24. doi:10.2217/imt-2019-0080
76. Kim S, Rigatto K, Gazzana MB, et al. Altered gut microbiome profile in patients with pulmonary arterial hypertension. Hypertension. 2020;75(4):1063–1071. doi:10.1161/HYPERTENSIONAHA.119.14294
77. Canfora EE, Jocken JW, Blaak EE. Short-chain fatty acids in control of body weight and insulin sensitivity. Nat Rev Endocrinol. 2015;11(10):577–591. doi:10.1038/nrendo.2015.128
78. Morris DJ, Ridlon JM. Glucocorticoids and gut bacteria: “The GALF Hypothesis” in the metagenomic era. Steroids. 2017;125:1–13. doi:10.1016/j.steroids.2017.06.002
79. Pluznick JL, Protzko RJ, Gevorgyan H, et al. Olfactory receptor responding to gut microbiota-derived signals plays a role in renin secretion and blood pressure regulation. Proc Natl Acad Sci U S A. 2013;110(11):4410–4415. doi:10.1073/pnas.1215927110
80. Kinross JM, Darzi AW, Nicholson JK. Gut microbiome-host interactions in health and disease. Genome Med. 2011;3(3):14. doi:10.1186/gm228
81. Chang Y, Chen Y, Zhou Q, et al. Short-chain fatty acids accompanying changes in the gut microbiome contribute to the development of hypertension in patients with preeclampsia. Clin Sci (Lond). 2020;134(2):289–302. doi:10.1042/CS2019125
 © 2021 The Author(s). This work is published and licensed by Dove Medical Press Limited. The full terms of this license are available at https://www.dovepress.com/terms.php and incorporate the Creative Commons Attribution - Non Commercial (unported, v3.0) License.
By accessing the work you hereby accept the Terms. Non-commercial uses of the work are permitted without any further permission from Dove Medical Press Limited, provided the work is properly attributed. For permission for commercial use of this work, please see paragraphs 4.2 and 5 of our Terms.
© 2021 The Author(s). This work is published and licensed by Dove Medical Press Limited. The full terms of this license are available at https://www.dovepress.com/terms.php and incorporate the Creative Commons Attribution - Non Commercial (unported, v3.0) License.
By accessing the work you hereby accept the Terms. Non-commercial uses of the work are permitted without any further permission from Dove Medical Press Limited, provided the work is properly attributed. For permission for commercial use of this work, please see paragraphs 4.2 and 5 of our Terms.