")
Back to Journals » Journal of Pain Research » Volume 13
Resting-State Functional MRI Study Demonstrates That the Density of Functional Connectivity Density Mapping Changes in Patients with Acute Eye Pain
Authors Zhou Z, Zhu PW , Shi WQ , Min YL, Lin Q , Ge QM , Li B, Yuan Q , Shao Y
Received 25 July 2019
Accepted for publication 13 March 2020
Published 18 August 2020 Volume 2020:13 Pages 2103—2112
DOI https://doi.org/10.2147/JPR.S224687
Checked for plagiarism Yes
Review by Single anonymous peer review
Peer reviewer comments 3
Editor who approved publication: Dr Michael Schatman
Zhou Zhou,1– 3 Pei-Wen Zhu,3 Wen-Qing Shi,3 You-Lan Min,3 Qi Lin,3 Qian-Min Ge,3 Biao Li,3 Qing Yuan,3 Yi Shao3
1Institute of Pathogenic Biology, Medical College, University of South China, Hengyang 421001, Hunan, People’s Republic of China; 2Hunan Provincial Key Laboratory for Special Pathogens Prevention and Control, Hengyang 421001, Hunan, People’s Republic of China; 3Department of Ophthalmology, The First Affiliated Hospital of Nanchang University, Nanchang 330006, Jiangxi Province, People’s Republic of China
Correspondence: Yi Shao
Department of Ophthalmology, The First Affiliated Hospital of Nanchang University, No. 17, Yongwaizheng Street, Donghu District, Nanchang 330006, Jiangxi Tel/ Fax +86 791-88692520
Email [email protected]
Purpose: Brain function in patients with acute eye pain (EP) has not been extensively studied. An understanding of the alterations in short-range functional connectivity density (shortFCD) and long-range functional connectivity density (longFCD) in patients with EP remains elusive. The aim of the present study was to compare the functional connectivity density (FCD) between patients with EP and healthy controls (HCs) using resting-state functional connectivity.
Methods: A total of 40 patients with EP (26 males and 14 females) and 40 HCs (26 males and 14 females) of similar age underwent functional magnetic resonance (MR) examination at the resting state. The shortFCD and longFCD values were compared using the one-sample t-test. The differences between patients with EP and the HCs were evaluated using receiver operating characteristic (ROC) curves.
Results: In the patients with EP, significantly reduced shortFCD values were observed in the left posterior lobe of the cerebellum, right inferior parietal lobule, and left anterior lobe of the cerebellum, and significantly reduced longFCD values were observed in both the left and right posterior lobe of the cerebellum. Significantly increased shortFCD values were also observed in both superior frontal gyri (Brodmann area 6), and increased longFCD values were observed in the left inferior temporal gyrus and left superior frontal gyri (Brodmann area 11). Compared with the HCs, less reduction was noted among the shortFCD values of patients with EP in the right posterior lobe of the cerebellum, right supramarginal gyrus, left middle temporal gyrus, bilateral superior frontal gyri, and bilateral caudate nuclei.
Conclusion: EP patients shown variation of binarized shortFCD and long FCD in brain areas including premotor cortex, ventral cortical visual system, newest part of the cerebellum, cerebellum control unconscious proprioception, inhibition of involuntary movement, somatosensory association cortex, nucleus involving reward system and ventral cortical visual system which might provide an explanation of brain functional compensation for chronic eye pain and visual impairment in the EP patients.
Keywords: eye pain, magnetic resonance imaging, functional connectivity density
Introduction
Eye pain (EP) is a common symptom of ophthalmopathy. It can occur in various eye diseases, such as keratitis, corneal ulcers, and keratoconjunctivitis sicca (dry eye syndrome). The cornea is one of the most sensitive tissues in the human body that is innervated with sensory nerve fibers by 70–80 long ciliary nerves via the trigeminal nerve of the eye. Research has shown that corneal infections are extremely painful because the density of pain receptors in the cornea is 300–600 times higher than that in skin and 20–40 times higher than that in dental pulp.1
The trigeminal nerve is the largest cranial nerve that controls facial sensation and motor functions such as biting and masticating. It has three branches: the ophthalmic (V1), maxillary (V2), and mandibular (V3). The cornea processes sensory information through parallel pathways of the central nervous system. Sensation is either touch-position or pain-temperature. Patients with corneal perforation have pain-temperature sensation, which is the anatomical basis of this study.1
Previous studies have been mainly focused on brain function as it relates to body sensations. However, little research has been conducted on the alterations in brain function in patients with EP.
Resting-state functional connectivity analysis is an effective method to evaluate spontaneous functional recovery. Up to now, our team has successfully applied functional connectivity density (FCD) to the research of various eye diseases, such as glaucoma,2 eye pain3 and corneal ulcer.4 In order to further explore the changes of brain function in patients with ocular pain, we conducted this study.
The present study explored variations in the resting-state shortFCD and longFCD in patients with EP. These findings might enhance our understanding of the underlying brain responses in patients with EP.
Materials and Methods
Subjects
A total of 26 male patients and 14 female patients with EP was recruited from the Ophthalmology Department of the First Affiliated Hospital of Nanchang University in Jiangxi province of China. All patients with EP were diagnosed with corneal infection by two experienced ophthalmologists. The inclusion criteria were: young patients with EP, with a mean ± standard deviation in duration of EP of 25.75 ± 5.65 days and a period of monocular deprivation of no less than 1 month. The exclusion criteria were: 1) the presence of other eye diseases, eye trauma, or previous ophthalmic surgery; 2) mental disorders (depression or delusions) or other systemic diseases, such as diabetes, cardiovascular diseases, or any brain diseases; 3) other disorders associated with eye pain (glaucoma, uveitis, etc.).
A total of 40 healthy controls (HCs, 26 males and 14 females) of similar age, sex ratio, and educational level was included in the study. All HCs met the following requirements: 1) normal brain parenchyma on cranial magnetic resonance imaging (MRI); 2) visual acuity>1.0, without any other ocular disease (dry eye, strabismus, amblyopia, cataracts, glaucoma, optic neuritis, or retinal degeneration, etc.); 3) no mental disorders (depression or delusions); 4) feasibility for MRI scanning (no cardiac pacemaker or implantation of metal devices); and 5) no cardiovascular diseases.
All research protocols were approved by the Medical Ethics Committee of the Ophthalmology Department of the First Affiliated Hospital of Nanchang University. All participants were informed of the purpose, methodology, and potential risks of the study, and gave informed consent.
MRI Data Acquisition
The MRI was performed using a 3.0 Tesla system (Magnetom TRIO, Siemens Medical). The high-resolution T1- and T2-imaging sequences used the following parameters: repetition time = 1900 ms; echo time = 2.26 ms; thickness = 1.0 mm; gap = 0.5 mm; field of view = 250 mm × 250 mm; matrix = 256 × 256; flip angle = 9°; 176 sagittal slices.
During the resting-state scan, 240 functional volumes were collected by a gradient echo-planar imaging sequence utilizing the following parameters: repetition time = 2000 ms; echo time = 30 ms; slice gap = 1 mm; flip angle = 90°; matrix size = 64 × 64; and 35 oblique slices parallel to the AC-PC line were obtained with interleaved acquisition. A sagittal fast spoiled gradient echo brain volume imaging (FSPGR-BRAVO) sequence was used to obtain high-resolution T1-weighted anatomical images with the following parameters: repetition time = 8.208 s; inversion time = 450 ms; echo time = 3.22 ms; flip angle = 12°; field of view = 240 × 240 mm; voxel size = 0.5 mm × 0.5 mm × 1 mm.
Data Analysis
The MRIcro software (www.MRIcro.com) was used to ensure data quality. Because the initial MRI signal might have been unstable, the first 10 time points of the functional images were discarded to allow the subjects to adapt to the scanning environment. All software is based on MATLAB 2010a software platform for data processing, preprocessing of the remaining data was performed using the Data Processing & Analysis for Brain Imaging (DPABI 2.1, http://rfmri.org/DPABI) toolbox. This preprocessing included Digital Imaging and Communications in Medicine standard form conversion, slice timing, head motion correction, and spatial standardization. Participants with a maximum translation of more than 1.5 mm in the x, y, or z directions, and a motion rotation of more than 1.5° were rejected.
Head motion effects were regressed from the data, based on the results of recent studies, which showed that higher-order models can benefit from the removal of head motion effects.5,6 Linear regression was used to remove other sources of spurious covariates, along with their temporal derivatives, including the global mean signal, and white matter and cerebrospinal fluid signals. After head motion correction, the functional MRI images were spatially normalized to the standard Montreal Neurological Institute space and re-sampled at a resolution of 3 × 3 × 3 mm3. After preprocessing, time-band-pass filtering (0.01–0.1 Hz) was applied to the time series of each voxel to reduce low-frequency drift, physiological high-frequency breathing and cardiac noise, and time-series linear depolarization.
Calculation of Long- and Short-Range FCD Calculation Maps
The FCD maps of each individual were calculated in a gray matter mask, including shortFCD and longFCD maps. Based on the Pearson’s correlations between the time processes of a given voxel and other voxels, the number of functional connections of a given voxel was considered as one degree of a node in a binary graph. The detailed steps in computing the shortFCD and longFCD values have been previously described.7
Firstly, we defined functional connectivity between a given voxel and other voxels in the whole brain, with a correlation threshold of r > 0.25. We adopted the threshold of r = 0.3 to calculate the FCD maps. Secondly, the shortFCD and longFCD were defined on the basis of the neighborhood strategy. Thus, we defined voxels that met a correlation threshold of r > 0.25 within their neighborhood (radius sphere ≤ 6 mm) as shortFCD, and those outside of their neighborhood (radius sphere > 6 mm) as longFCD. To improve normality, the shortFCD and longFCD maps were divided by the mean value for the whole brain of each subject and the values were converted to Z-scores. Furthermore, the shortFCD and longFCD maps were spatially smoothed using the SPM8 (The MathWorks, Inc., Natick, MA, USA) with a Gaussian kernel of 6 × 6 × 6 mm3 full-width at half-maximum.
Ophthalmic Testing
The Snellen Visual Acuity chart was used for visual tests. All subjects stood 5 m from the chart and their line of gaze was parallel to an acuity of 1.0.
Statistical Analysis
The cumulative clinical measurements were analyzed using an independent sample t-test and the SPSS version 16.0 software (SPSS Inc, Chicago, IL, USA). A one-sample t-test was performed to analyze the spatial distribution of shortFCD and longFCD values between patients with EP and HCs.
Statistical analysis of the general linear model was performed using the SPM8 toolkit. Differences in the shortFCD and longFCD between the patients with EP and HCs were evaluated using two-sample t-tests (two-tailed, voxel-level p< 0.01, Gaussian random field theory correction, cluster-level p< 0.05). The mean shortFCD and longFCD values in the different brain regions of both experimental groups were analyzed using ROC curves. Pearson’s correlation analysis was used to evaluate the relationship between the mean shortFCD and longFCD values in different brain regions in the EP group. A p-value< 0.05 was considered to indicate statistical significance.
Results
Demographics and Visual Measurements
No significant differences were noted in weight (p = 0.892) or age (p = 0.824), while the best-corrected visual acuity-Right (p = 0.009) and best-corrected visual acuity-Left (p = 0.007) in patients with EP were statistically significant reduced. The mean ± standard deviation of the duration of EP was 25.75 ± 5.65 days. See Table 1 for details.
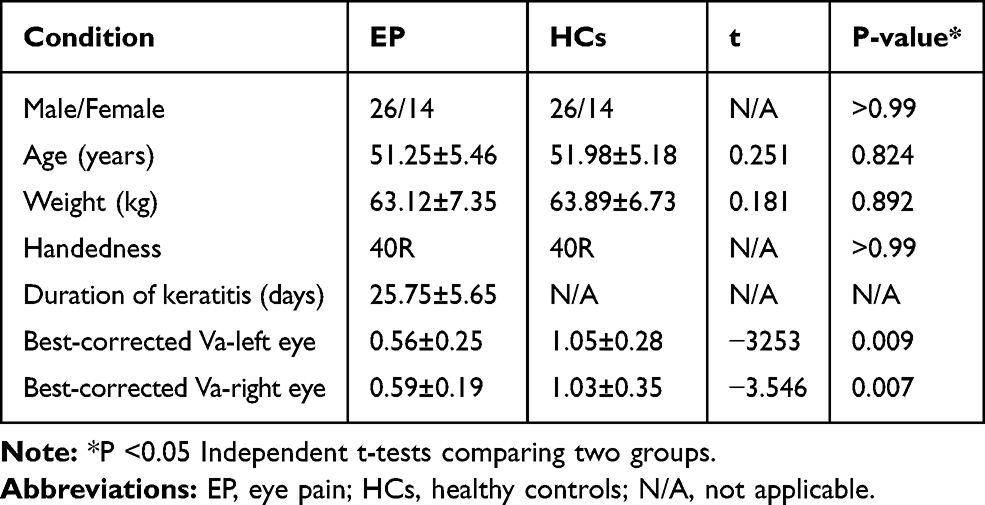 |
Table 1 Conditions of Participants Included in the Study |
Spatial Distribution of FCD
Compared with HCs, patients with EP showed significantly reduced shortFCD values in the left posterior lobe of the cerebellum, right inferior parietal lobule, and left anterior lobe of the cerebellum, as well as significantly reduced longFCD values in both left and right posterior lobe of the cerebellum, right Cuneus. Significantly increased shortFCD values were also observed in right posterior cerebellum of lobe, left middle temporal gyrus (Brodmann area 20, 21), right supramarginal gyrus (Brodmann area 40), both superior frontal gyri (Brodmann area 6), both caudate, lift medial frontal gyrus (Brodmann area 9, 32), and increased longFCD values were observed in the left inferior temporal gyrus and left superior frontal gyri (Brodmann area 11,9,32). (Tables 2 and 3, Figures 1–5)
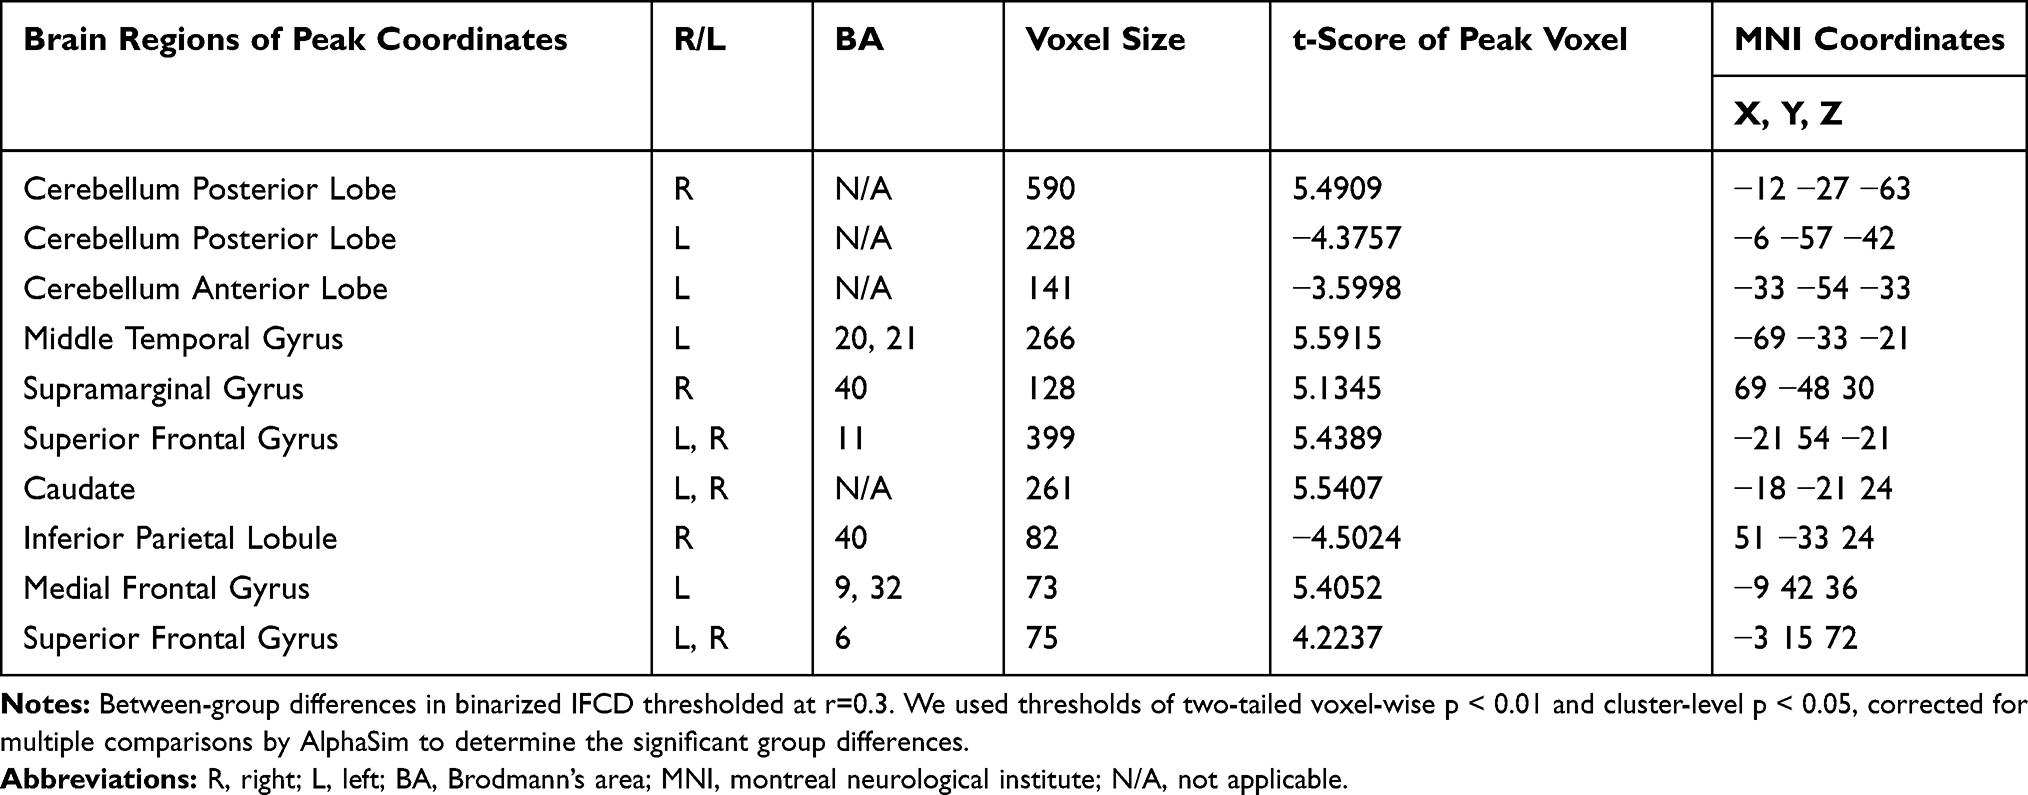 |
Table 2 The Binarized IFCD Differences Between Patients with EP and HCs |
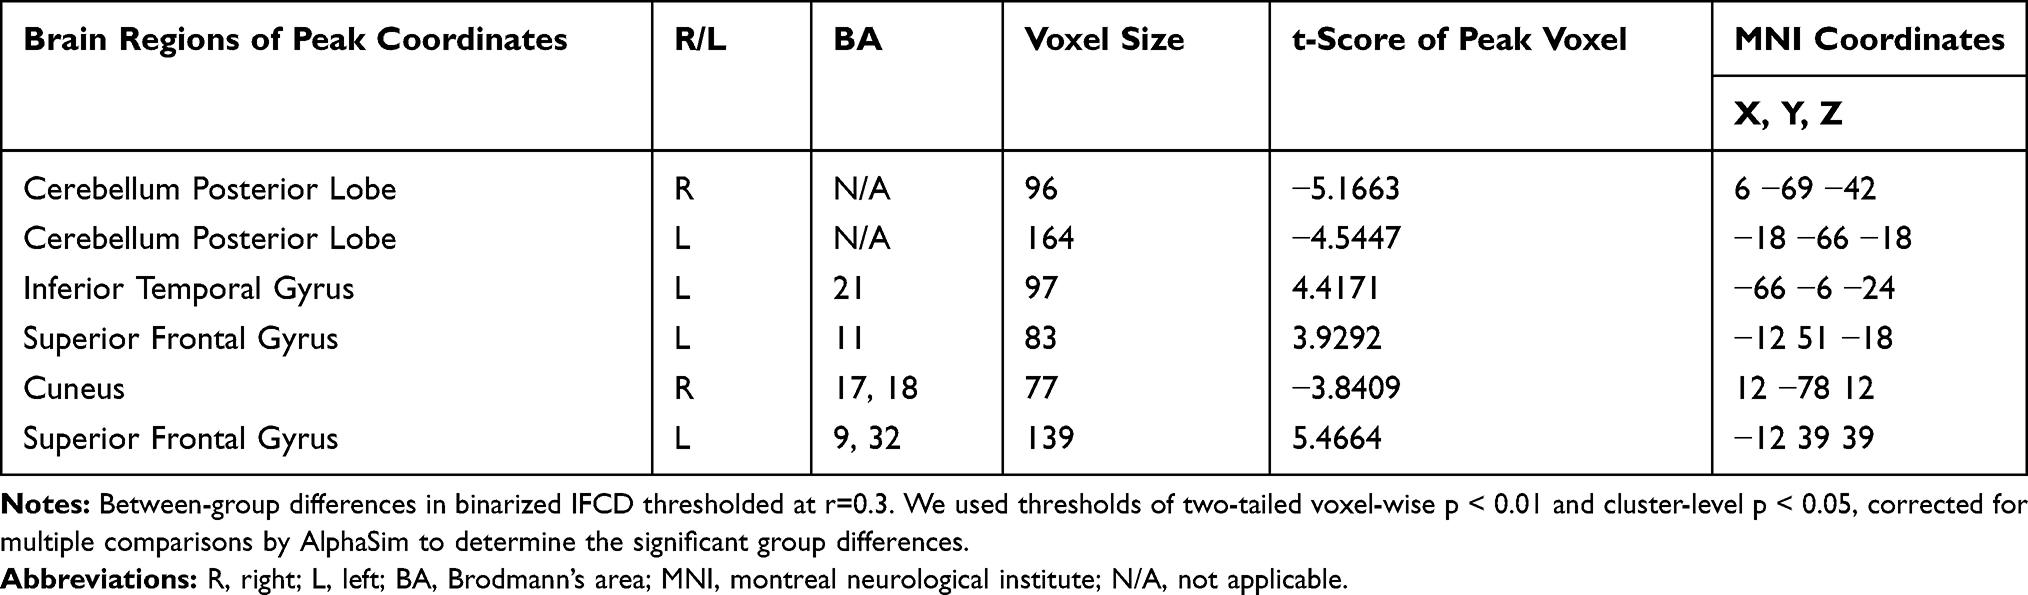 |
Table 3 The Binarized longFCD Differences Between Patients with Keratitis and HCs |
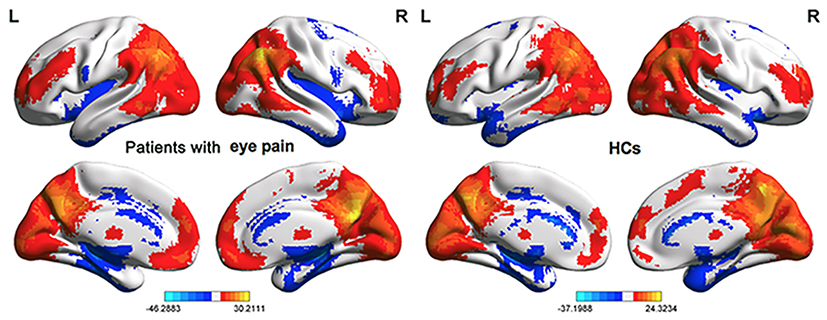 |
Figure 1 One sample t test differences of patients with EP and HCs in Binarized shortFCD. Significant shortFCD differences were observed in left IFG, MFG right superior frontal gyri, left posterior lobe of the cerebellum, anterior lobe of the cerebellum Thalamus, right posterior lobe of the cerebellum, Brainstem, insula, P. C. Cuneus, Cuneus; the red areas denote higher shortFCD values. The blue areas denote lower shortFCD values. The means of altered shortFCD between the patients with EP and HCs (voxel level p< 0. 01 and cluster level p< 0.05, Gaussian random field (GRF) theory corrected). Abbreviations: EP, eye pain; HCs, healthy controls; L, left; R, right. |
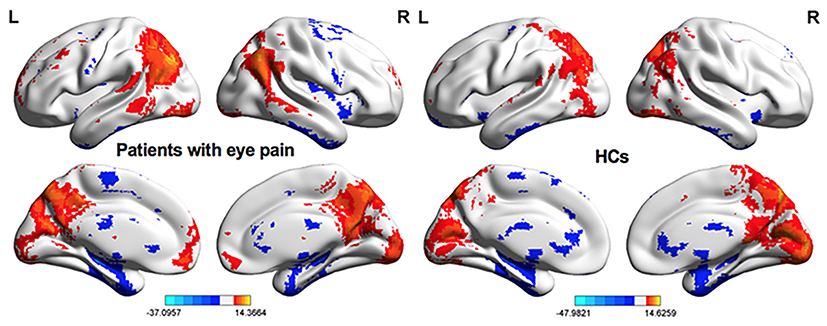 |
Figure 2 One sample t test differences of patients with keratitis and HCs in Binarized long FCD. Significant longFCD differences were observed in bilateral superior frontal gyri, MFG, left posterior lobe of the cerebellum, IFG, right posterior lobe of the cerebellum, Cuneus, insula; the red areas denote higher longFCD values. The blue areas denote lower longFCD values. The means of altered longFCD between the patients with keratitis and HCs (voxel level p< 0.01 and cluster level p< 0.05, Gaussian random field (GRF) theory corrected). Abbreviations: HCs, healthy controls; L, left; R, right. |
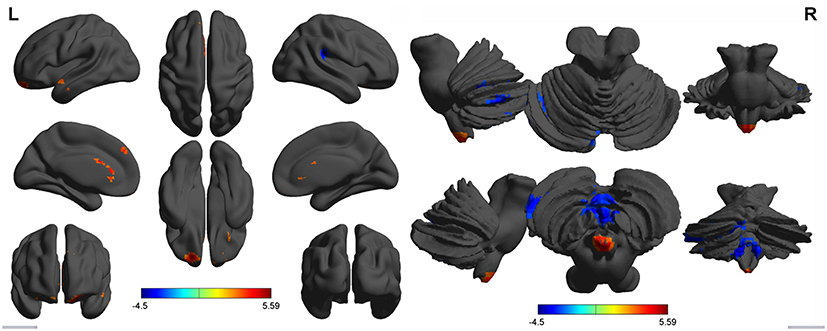 |
Figure 3 Binarized shortFCD differences between patients with keratitis and HCs. The red areas denote higher Binarized shortFCD values. The blue areas denote lower Binarized shortFCD values. Abbreviations: HCs, healthy controls; L, left; R, right. |
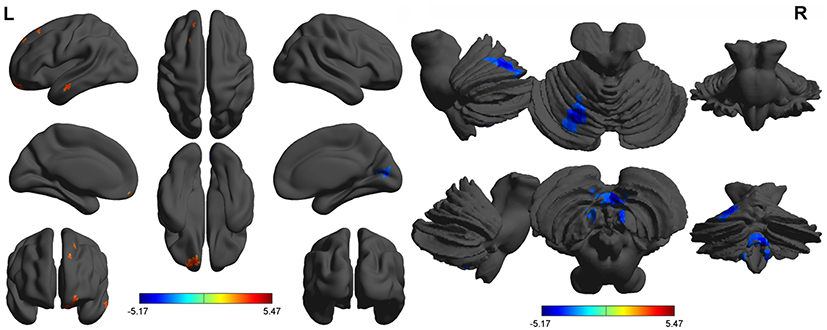 |
Figure 4 Binarized longFCD differences between patients with keratitis and HCs. The red areas denote higher Binarized longFCD values. The blue areas denote lower Binarized longFCD values. Abbreviations: HCs, healthy controls; L, left; R, right. |
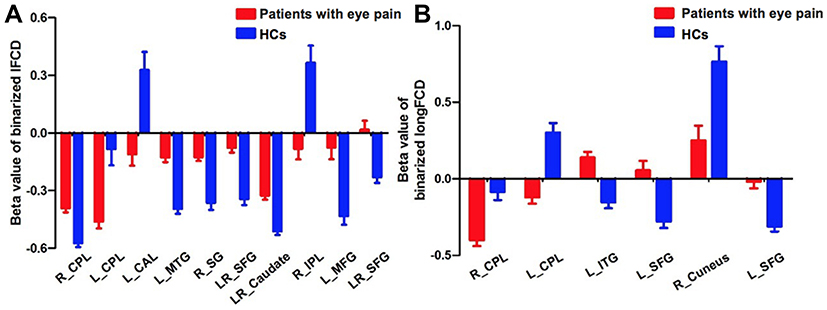 |
Figure 5 Binarized shortFCD value and longFCD value of between-group differences in different brain areas. The red bar denotes the shortFCD or longFCD value of patients with keratitis, the blue bar denotes the shortFCD or longFCD value of normal controls. In (A) LR-SFG (left): Brodmann’s area 11, LR-SFG (right): Brodmann’s area 6. In (B) L_SFG (left): Brodmann’s area 11. L_SFG (right): Brodmann’s area 9, 32. Abbreviations: shortFCD, short-range Functional Connectivity Density; longFCD, long-range Functional Connectivity Density; HCs, healthy controls; L, left; R, right; CPL, cerebellum posterior lobe; CAL, cerebellum anterior lobe; IFG, inferior frontal gyrus; SFG, superior frontal gyrus; MFG, middle frontal gyrus. |
Receiver Operating Characteristic Curve
We identified brain regions with different shortFCD and longFCD values between the EP and HC groups. The closer the area under the curve (AUC) was to 1, the more favorable the diagnosis. An AUC of 0.5~0.7 indicated low accuracy; that of 0.7~0.9 indicated moderate accuracy; and that above 0.9 indicated high accuracy (Figures 3–5).
The results of AUC analysis of the binarized shortFCD values were as follows: 0.899 for the right posterior lobe of the cerebellum; 0.965 for the left middle temporal gyrus; 0.892 for the right supramarginal gyrus; 0.915 for the bilateral superior frontal gyri (Brodmann area 11); 0.917 for the bilateral caudate nuclei; 0.840 for the left medial frontal gyrus; 0.826 for the bilateral superior frontal gyri (Brodmann area 6); 0.830 for the left posterior lobe of the cerebellum; 0.802 for the left anterior lobe of the cerebellum; and 0.804 for the right inferior parietal lobule (Figure 6). The results of the AUC analysis of the binarized longFCD values were: 0.870 for the left inferior temporal gyrus; 0.811 for the left superior frontal gyri (Brodmann area 11); 0.863 for the left superior frontal gyri (Brodmann area 9, 32); 0.859 for the right posterior lobe of the cerebellum; 0.870 for the left posterior lobe of the cerebellum; and 0.792 for the right cuneus (Figure 7).
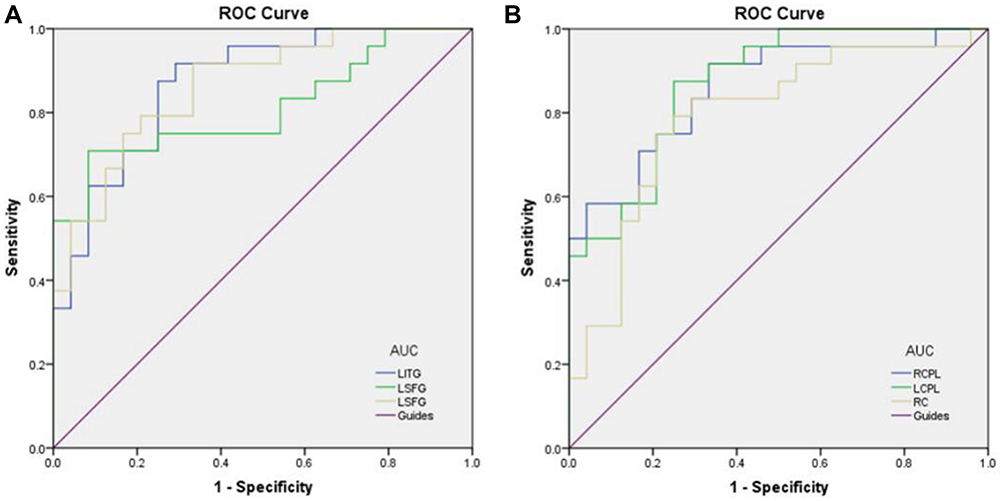 |
Figure 6 ROC curve analysis of the binarized shortFCD values for altered brain regions. Notes: (A) The areas under the ROC curve were 0.899 (p <0.00195% CI: 0.814–0.985) for RCPL, LMTG 0.965 (p <0.001; 95% CI: 0.923–1.000), RSG 0.892 (p <0.001; 95% CI: 0.797–0.987), BSFG 0.915 (p <0.001; 95% CI: 0.835–0.995), BC 0.917 (p <0.001; 95% CI: 0.836–0.997), LMFG 0.840 (p <0.001; 95% CI: 0.730–0.950), BSFG 0.826 (p <0.001; 95% CI: 0.710–0.943). (B) The areas under the ROC curve were 0.830 (p <0.001; 95% CI: 0.716–0.944) for LCPL, LCAL 0.802 (p <0.001; 95% CI: 0.670–0.934), RIPL 0.804 (p <0.001; 95% CI: 0.677–0.931).Abbreviations: ROC, receiver operating characteristic; RCPL, right cerebellum posterior lobe; LMTG, left middle temporal gyrus; RSG, right supramarginal gyrus; BSFG, bilateral superior frontal gyrus; BC, bilateral caudate; LMFG, left medial frontal gyrus; LCPL, left cerebellum posterior lobe; LCAL, left cerebellum anterior lobe; RIPL, right inferior parietal lobule. |
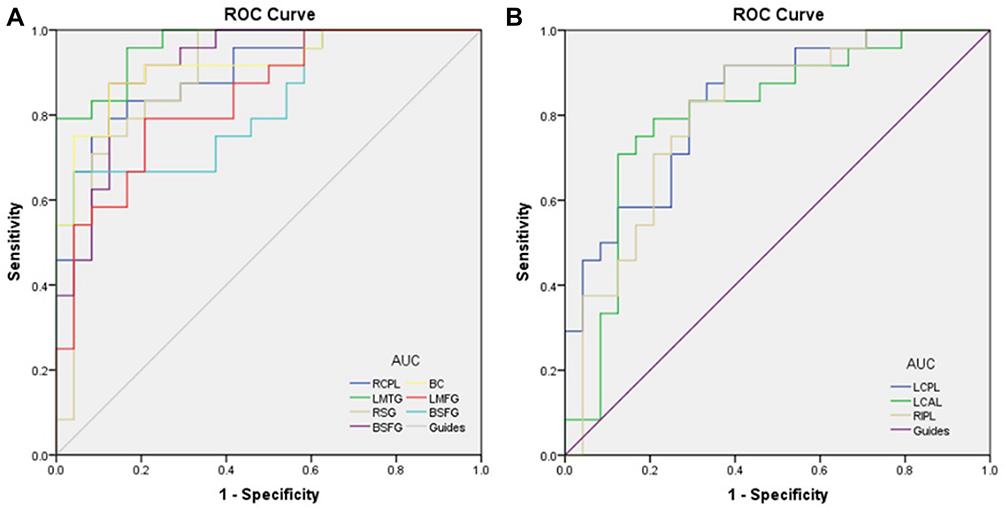 |
Figure 7 ROC curve analysis of the binarized long FCD values for altered brain regions. Notes: (A) The areas under the ROC curve were 0.870 (p <0.001; 95% CI: 0.771–0.969) for LITG, LSFG 0.811 (p <0.001; 95% CI: 0.685–0.937), LSFG 0.863 (p <0.001; 95% CI: 0.762–0.964). (B) The areas under the ROC curve were 0.859 (p <0.00195% CI: 0.754–0.964) for RCPL, LCPL 0.870 (p <0.001; 95% CI: 0.772–0.967), RC 0.792 (p <0.001; 95% CI: 0.660–0.923).Abbreviations: ROC, receiver operating characteristic; LITG, left inferior temporal gyrus; LSFG, left superior frontal gyrus; RCPL, right cerebellum posterior lobe; LCPL, left cerebellum posterior lobe; RC, right cuneus. |
Discussion
The present study explored the alterations in functional connectivity density in patients with EP. We found that compared with the HCs, patients with EP showed significantly increased shortFCD values in both the right and left superior frontal gyri (Brodmann 6), as well as increased longFCD values in the left inferior temporal gyrus and left superior frontal gyri (Brodmann area 11) (Figure 8). Patients with EP also showed significantly reduced shortFCD values in the left posterior lobe of the cerebellum, right inferior parietal lobule, and left anterior lobe of the cerebellum, and significantly reduced longFCD values in both left and right posterior lobe of the cerebellum. Compared with the HCs, patients with EP also showed less reduction in shortFCD values in the right posterior lobe of the cerebellum, right supramarginal gyrus, left middle temporal gyrus, bilateral superior frontal gyri, and bilateral caudate nuclei (Figure 9).
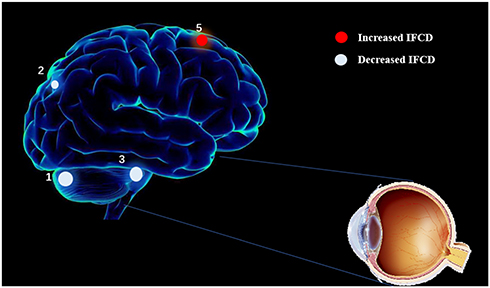 |
Figure 8 The shortFCD results of brain activity in the EP group. Compared with the HCs, the shortFCD of the following regions were increased to various extents: 1-cerebellum posterior lobe (t=5.4909); 2- l right inferior Parietal Lobule (t=−4.5024); 3-cerebellum Anterior Lobe (t=−3.5998); 4- superior Frontal Gyrus (t=4.2237) in EP patients. Notes: The sizes of the spots denote the degree of quantitative changes.Abbreviations: shortFCD, short-range Functional Connectivity Density; EP, eye pain; HCs, healthy control. |
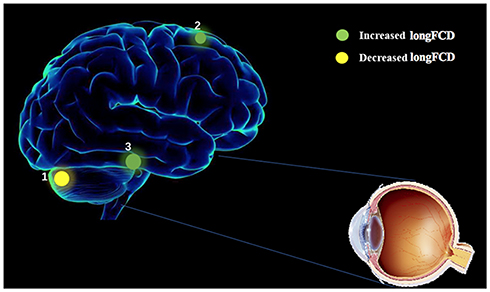 |
Figure 9 The longFCD results of brain activity in the EP group. Compared with the HCs, the shortFCD of the following regions were increased to various extents: 1-cerebellum posterior lobe (t=−5.1663); 2-superior frontal gyrus (t=5.4664); 3-Inferior Temporal Gyrus (t=4.4171) in EP patients. Notes: The sizes of the spots denote the degree of quantitative changes.Abbreviations: longFCD, long-range Functional Connectivity Density; EP, eye pain; HCs, healthy control. |
The superior frontal gyri accounts for about one-third of the frontal lobe of the human brain. Goldberg et al8 observed that the superior frontal gyri associated with self-awareness and coordination of movements perceived by the sensory system. The superior frontal gyri believed to contribute to improved cognitive function, especially working memory. Brodmann area 6 (BA6) is part of the frontal cortex in the human brain. It is situated just anterior to the primary motor cortex (BA4), and is composed of the premotor cortex, and medially, the supplementary motor area. This large area of the frontal cortex is thought to play an important role in the planning of complex, coordinated movements.
The significant increase in shortFCD values in the superior frontal gyri (Brodmann area 6) of patients with EP indicated that corneal infection can stimulate the planning of complex and coordinated movements in the brain. The mechanism by which this occurs needs further investigation. Brodmann area 11 is a cytologically defined brain region, associated with decision-making,9 rewards processing,10 planning, reasoning, and encoding new information into long-term memory.11
As the duration of disease increases, EP can occur repeatedly, especially for conditions like keratitis, which is characterized by a relatively long period of illness leading to recurrent EP. New recurrence of EP stimulates the long-term memory, and thereby stimulates Brodmann area 11 of the superior frontal gyri. This may explain the underlying mechanism of the increased longFCD values in the superior frontal gyri (Brodmann area 11).
The inferior temporal gyrus is located beneath the middle temporal gyrus, and is connected to the inferior occipital gyrus. This region is one of the advanced areas of visual processing, is related to the representation of complex object features, and may also be involved in facial perception.12 The inferior temporal cortex is also known as the inferior temporal gyrus, as it is located in a specific region of the human temporal lobe.13 The patients with EP showed decreasing visual acuity. As the final position of the ventral cortical visual system, the inferior temporal gyrus would have compensated for the reduction in visual acuity in patients with EP. This may explain the mechanism by which significantly increased longFCD values were observed in patients with EP.
The posterior lobe of the cerebellum, or neocerebellum, refers to the lower part of the primary fissure of the cerebellum. It plays an important role in fine motor coordination, especially in the inhibition of unconscious motion via inhibitory neurotransmitters, such as gamma-aminobutyric acid.14 The posterior lobe of the cerebellum receives input mainly from the brainstem (ie, the reticular formation and inferior olivary nucleus) and cerebral cortex.15
Information from sensorimotor associative cortices passes several points in the brain stem and enters the posterior part of the cerebellum via the intermediate peduncle.16 There are anatomical connections between the posterior lobe of the cerebellum and other brain regions with higher cognitive function. Patients with EP have difficulty completing fine movements because of a reduction in visual acuity and visual field defects. The reduced longFCD values in the posterior lobe of the cerebellum of patients with EP indicate a reduction in fine motor function.
The inferior parietal lobule (subparietal district) is located below the horizontal part of the intraparietal sulcus, and behind the lower part of the postcentral sulcus. It is involved in the interpretation of emotional perception and sensory information during facial stimulation.17 The inferior parietal lobule is also associated with language, mathematical operations, and body images, especially the supramarginal gyrus and angular gyrus. The mechanism by which the shortFCD values in the inferior parietal lobule were reduced in patients with EP needs further investigation.
The anterior lobe of the cerebellum is responsible for mediating unconscious proprioception. Non-conscious proprioception is transmitted to the cerebellum. An unconscious reaction is seen in the proprioceptive reflex of the human body, or righting reflex. In the event the body tilts in any direction, the person will raise his/her head to keep the eyes level with the horizon. To our knowledge, no previous study has evaluated the righting reflex in patients with EP. The cerebellum controls calibration, reduction of eye instability, and maintenance of ocular alignment.18 A reduction in the visual acuity of one eye can affect eye alignment and fixation. Patients with EP have difficulty with ocular alignment. This might explain a possible mechanism by which the significantly reduced values were observed in the anterior lobe of the cerebellum of patients with EP.
The caudate nucleus is one of the structures that comprise the dorsal striatum, which is part of the basal ganglion.19 It plays an important role in various non-motor functions, including inhibitory motor control.20 Previous research has shown the inhibitory nature of the caudate nucleus and its ability to inhibit the tendency of an animal to move forward without resistance.21 We observed less reduction among the shortFCD values in patients with EP than in the HCs. This indicates the inhibitory function of the caudate nucleus is reduced in patients with EP. However, the underlying mechanism needs further investigation. Earlier research has also indicated the caudate nucleus is involved in the neural pathway of spatial neglect in patients affected by chronic pain.22
The supramarginal gyrus is part of the parietal lobe. This area of the brain is also known as Brodmann area 40. The right supramarginal gyrus seems to play a central role in empathy. When this structure malfunctions, or when quick judgments are made, empathy becomes severely limited.23 Research has shown that destroying the neurons in the right supramarginal gyrus causes humans to project emotions on to others, thereby inhibiting their empathy. In addition, this kind of interference also causes people to be more self-centered, mainly because they cannot perceive the emotions of others around them.24 We found significantly less reduction in shortFCD values in the supramarginal gyrus of patients with EP than that of HCs. Although to our knowledge, no previous study has investigated empathy in patients with EP, the present results indicate that such studies are necessary, as they could help to determine the mechanism of variation in empathy in such patients.
It can be seen from the results that the brain regions where FCD changes are not symmetrically distributed, but mostly concentrated in the left brain. We speculate that this may be because our subjects are all right-handed.
Patients with EP are consistently affected by chronic pain, which stems from infections of the cornea. Drug therapy is often the preferred treatment for chronic pain, although side effects and high costs limit long-term use. As an adjunct to the traditional treatment of chronic pain, the use of inexpensive, safe, and self-managed non-drug therapies, such as mirror therapy25 is also recommended.
The present study found less reduction in the shortFCD values of the right supramarginal gyrus in patients with EP. The supramarginal gyrus is part of the somatosensory association cortex, which interprets tactile sensory data and is associated with sensory space and limb location. It also participates in the recognition of the postures and gestures of other individuals, and is therefore, part of the mirror neuron system.26,27
Limitations
However, our study has some limitations. Firstly, the sample size was relatively small. Secondly, subjects are generally older. Thirdly, We did not use multi-modal fMRI methods to explore the neurological mechanism of EP patients. Fourthly, the correlation between connectivity and clinical scores was not performed for the incomplete data. What’s more, the severity of pain were not measured. Finally, the onset time of the EP patients was not exactly the same, which might affect the accuracy of the results.
Conclusion
In summary, this study indicated that EP patients shown variation of binarizedshortFCD and long FCD in brain areas including premotor cortex, ventral cortical visual system, newest part of the cerebellum, cerebellum control unconscious proprioception, inhibition of involuntary movement, somatosensory association cortex, nucleus involving reward system and ventral cortical visual system which might provide an explanation of brain functional compensation for chronic eye pain and visual impairment in the EP patients.
Ethics and Consent Statements
All procedures performed in studies involving human participants were in accordance with the ethical standards of the First Affiliated Hospital of Nanchang University ethical committee and with the 1964 Helsinki declaration and its later amendments or comparable ethical standards. All subjects signed written informed consent.
Acknowledgments
National Natural Science Foundation of China (No: 81660158); Natural Science Key Project of Jiangxi Province (No: 20161ACB21017); Youth Science Foundation of Jiangxi Province (No: 20161BAB215198); Key Research Foundation of Jiangxi Province (No: 20181BBG70004); Excellent Talents Development Project of Jiangxi Province (S2019RCQNB0259); Teaching Reform of Degree and Graduate Education Research Project of Jiangxi Province (No: JXYJG2018013); Grassroots Health Appropriate Technology” Spark Promotion Plan” Project of Jiangxi Province (No: 20188003); Health Development Planning Commission Science Foundation of Jiangxi Province (No: 20175116); Health Development Planning Commission Science TCM Foundation of Jiangxi Province (No: 2018A060).
Disclosure
The authors declare no potential conflicts of interest.
References
1. Rapuano CJ. Cornea. Philadelphia: Wolters Kluwer Health; 2018.
2. Chen L, Li S, Cai F, et al. Altered functional connectivity density in primary angle-closure glaucoma patients at resting-state. Quant Imaging Med Surg. 2019;9:603–614. doi:10.21037/qims
3. Dong Z, Zhu F-Y, Shi W-Q, et al. Abnormalities of interhemispheric functional connectivity in individuals with acute eye pain: a resting-state fMRI study. Int J Ophthalmol. 2019;12(4):634–639. doi:10.18240/ijo.2019.04.18
4. Zhu F, Tang L, Zhu P, et al. Resting-state functional magnetic resonance imaging (fMRI) and functional connectivity density mapping in patients with corneal ulcer. Neuropsychiatr Dis Treat. 2019;15:1833–1844. doi:10.2147/NDT
5. Satterthwaite TD, Elliott MA, Gerraty RT, et al. An improved framework for confound regression and filtering for control of motion artifact in the preprocessing of resting-state functional connectivity data. Neuroimage. 2013;64:240–256. doi:10.1016/j.neuroimage.2012.08.052
6. Yan CG, Cheung B, Kelly C, et al. A comprehensive assessment of regional variation in the impact of head micromovements on functional connectomics. Neuroimage. 2013;76:183–201. doi:10.1016/j.neuroimage.2013.03.004
7. Beucke JC, Sepulcre J, Talukdar T, et al. Abnormally high degree connectivity of the orbitofrontal cortex in obsessive-compulsive disorder. JAMA Psychiatry. 2013;70(6):619–629. doi:10.1001/jamapsychiatry.2013.173
8. Goldberg II, Harel M, Malach R. When the brain loses its self: prefrontal inactivation during sensorimotor processing. Neuron. 2006;50:329–339. doi:10.1016/j.neuron.2006.03.015
9. Rogers RD, Owen AM, Middleton HC, et al. Choosing between small, likely rewards and large, unlikely rewards activates inferior and orbital prefrontal cortex. J Neurosci. 1999;19(20):9029–9038. doi:10.1523/JNEUROSCI.19-20-09029.1999
10. Kringelbach ML. The functional neuroanatomy of the human orbitofrontal cortex: evidence from neuroimaging and neuropsychology. Prog Neurobiol. 2004;72(5):341–372. doi:10.1016/j.pneurobio.2004.03.006
11. Frey S, Petrides M. Orbitofrontal cortex: a key prefrontal region for encoding information. Proc Natl Acad Sci U S A. 2000;97:8723–8727. doi:10.1073/pnas.140543497
12. Haxby JV, Hoffman EA, Gobbini MI. The distributed human neural system for face perception. Trends Cogn Sci. 2000;4:223–233. doi:10.1016/S1364-6613(00)01482-0
13. Clark DL, Boutros NN, Mendez MF. The Brain and Behavior: An Introduction to Behavioral Neuroanatomy. New York, NY: Cambridge University Press; 2017.
14. Campbell HR, Meek J, Zhang J, Bell CC. Anatomy of the posterior caudal lobe of the cerebellum and the eminentiagranularis posterior in a mormyrid fish. J Comp Neurol. 2007;502:714–735. doi:10.1002/cne.21334
15. Ramnani N. Frontal lobe and posterior parietal contributions to the cortico-cerebellar system. Cerebellum. 2012;11:366–383. doi:10.1007/s12311-011-0272-3
16. Kelly RM, Strick PL. Cerebellar loops with motor cortex and prefrontal cortex of a nonhuman primate. J Neurosci. 2003;23:8432–8444. doi:10.1523/JNEUROSCI.23-23-08432.2003
17. Radua J, Phillips ML, Russell T, et al. Neural response to specific components of fearful faces in healthy and schizophrenic adults. NeuroImage. 2010;49(1):939–946. doi:10.1016/j.neuroimage.2009.08.030
18. Bodranghien F, Bastian A, Casali C, et al. Consensus paper: revisiting the symptoms and signs of cerebellar syndrome. Cerebellum. 2016;15(3):369–391. doi:10.1007/s12311-015-0687-3
19. Yager LM, Garcia AF, Wunsch AM, Ferguson SM. The ins and outs of the striatum: role in drug addiction. Neuroscience. 2015;301:529–541. doi:10.1016/j.neuroscience.2015.06.033
20. Nestler EJ, Hyman SE, Malenka RC. Molecular Neuropharmacology: A Foundation for Clinical Neuroscience. New York: McGraw-Hill Medical; 2009.
21. White NM. Some highlights of research on the effects of caudate nucleus lesions over the past 200 years. Behav Brain Res. 2009;199:3–23. doi:10.1016/j.bbr.2008.12.003
22. Molenberghs P, Sale MV, Mattingley JB. Is there a critical lesion site for unilateral spatial neglect? A meta-analysis using activation likelihood estimation. Front Hum Neurosci. 2012;6:78. doi:10.3389/fnhum.2012.00078
23. Hoffmann F, Koehne S, Steinbeis N, Dziobek I, Singer T. Preserved self-other distinction during empathy in autism is linked to network integrity of right supramarginal gyrus. J Autism Dev Disord. 2016;46:637–648. doi:10.1007/s10803-015-2609-0
24. Silani G, Lamm C, Ruff CC, Singer T. Right supramarginal gyrus is crucial to overcome emotional egocentricity bias in social judgments. J Neurosci. 2013;33:15466–15476. doi:10.1523/JNEUROSCI.1488-13.2013
25. Bekrater-Bodmann R. [Mirror therapy for inflammatory rheumatic pain: potentials and limitations]. Z Rheumatol. 2015;74:793–800. German. doi:10.1007/s00393-015-1629-7
26. Carlson NR, Birkett MA. Physiology of Behavior. Boston: Pearson; 2017.
27. Reed CL, Caselli RJ. The nature of tactile agnosia: a case study. Neuropsychologia. 1994;32:527–539. doi:10.1016/0028-3932(94)90142-2
 © 2020 The Author(s). This work is published and licensed by Dove Medical Press Limited. The full terms of this license are available at https://www.dovepress.com/terms.php and incorporate the Creative Commons Attribution - Non Commercial (unported, v3.0) License.
By accessing the work you hereby accept the Terms. Non-commercial uses of the work are permitted without any further permission from Dove Medical Press Limited, provided the work is properly attributed. For permission for commercial use of this work, please see paragraphs 4.2 and 5 of our Terms.
© 2020 The Author(s). This work is published and licensed by Dove Medical Press Limited. The full terms of this license are available at https://www.dovepress.com/terms.php and incorporate the Creative Commons Attribution - Non Commercial (unported, v3.0) License.
By accessing the work you hereby accept the Terms. Non-commercial uses of the work are permitted without any further permission from Dove Medical Press Limited, provided the work is properly attributed. For permission for commercial use of this work, please see paragraphs 4.2 and 5 of our Terms.