")
Back to Journals » Neuropsychiatric Disease and Treatment » Volume 15
Resting-state functional magnetic resonance imaging (fMRI) and functional connectivity density mapping in patients with corneal ulcer
Authors Zhu F, Tang L, Zhu P , Lin Q , Yuan Q , Shi W , Li B, Ye L, Min Y, Su T , Shao Y
Received 30 March 2019
Accepted for publication 10 June 2019
Published 5 July 2019 Volume 2019:15 Pages 1833—1844
DOI https://doi.org/10.2147/NDT.S210658
Checked for plagiarism Yes
Review by Single anonymous peer review
Peer reviewer comments 2
Editor who approved publication: Dr Yuping Ning
Feiyin Zhu,1,2,* Liying Tang,3,4,5,6,* Peiwen Zhu,1 Qi Lin,1 Qing Yuan,1 Wenqing Shi,1 Biao Li,1 Lei Ye,1 Youlan Min,1 Ting Su,3–6 Yi Shao1
1Department of Ophthalmology, The First Affiliated Hospital of Nanchang University, Jiangxi Province Clinical Ophthalmology Institute, Nanchang, Jiangxi 330006, People’s Republic of China; 2Department of Clinical Medicine, Queen Mary College of Nanchang University, Nanchang, Jiangxi 330031, People’s Republic of China; 3Department of Ophthalmology, Xiang’an Hospital of Xiamen University, Xiamen, Fujian 361102, People’s Republic of China; 4Fujian Provincial Key Laboratory of Ophthalmology and Visual Science, Xiamen, Fujian 361102, People’s Republic of China; 5Eye Institute of Xiamen University, Xiamen, Fujian 361102, People’s Republic of China; 6School of Medicine, Xiamen University, Xiamen, Fujian 361102, People’s Republic of China
*These authors have contributed equally to this work
Purpose: To investigate alternations in spontaneous brain activities reflected by functional connectivity density (FCD) in patients with corneal ulcer (CU) using resting-state functional connectivity (rsFC).
Methods: We recruited 24 patients with CU (12 males, 12 females), and 24 healthy controls (HCs; 12 males, 12 females) matched for age, gender and education status. Functional magnetic resonance imaging examinations were performed on all subjects in a resting state and the following parameters determined: rsFC, long-range FCD (longFCD) and short-range FCD (IFCD). Receiver operating characteristic (ROC) curves were then used to differentiate patients with CU from HCs.
Results: Compared with HCs, CU patients showed significantly reduced rsFC values in the right cerebellum posterior lobe gyrus, right middle frontal gyrus/inferior frontal gyrus/superior frontal gyrus and left inferior parietal lobule/precuneus. Significantly reduced longFCD values were found in the right hippocampus/inferior temporal gyrus and the left inferior temporal gyrus. Moreover, compared with HCs, IFCD values were significantly reduced in the left inferior temporal gyrus/middle temporal gyrus, left limbic lobe/medial frontal gyrus, and left precuneus/limbic lobe, but were significantly increased in the right insula/superior temporal gyrus, left superior temporal gyrus/inferior frontal gyrus/insula, right superior temporal gyrus/postcentral gyrus, and left precentral gyrus.
Conclusions: Patients with CU exhibited alterations in spontaneous brain activities in several brain areas. These novel findings may help to reveal the neuropathological mechanisms underlying CU.This study provides a direction for further exploration of underlying neural mechanisms of CU and facilitate the clinical diagnosis and treatment of CU.
Keywords: functional connectivity density, corneal ulcer, spontaneous brain activities
Introduction
Corneal ulcer (CU) is an inflammatory disease caused by weakened corneal defense, and the invasion of exogeneous or endogenous pathogenic factors. A range of factors are known to contribute to CU, including infection by bacteria, virus and fungi, autoimmune diseases and the spread of inflammation from adjacent tissue .1
As a leading global reason for visual impairment and blindness, CU tends to occur in marginalized populations.2 In India, approximately 2 million people develop CU each year.3 CU is associated with a range of eye symptoms, including ophthalmodynia, photophobia, tears, spasm of the eyelid and impaired vision.1 Currently, Gram stain, slit lamp and the culture of corneal samples are the main diagnostic methods for CU; however, these methods lack sensitivity.4–6 At present, the administration of antibiotics remains the predominant treatment for controlling the infection associated with CU, and topical eye dropping is an effective method with which to relieve eye symptoms.7–9 If pharmacological treatment fails to work, or corneal perforation occurs, then corneal transplantation is the recommended alternative.
Resting-state functional magnetic resonance imaging (fMRI), a functional brain imaging examination technique, can be utilized to investigate changes of functional connectivity (FC) in the brain in a resting state.9 This technique has a number of advantages, including precise positioning, the lack of radioactive injury, and the ability to combine functional and anatomic imaging. Thus far, resting-state fMRI has been successfully applied to investigate neurological conditions in certain ocular diseases, such as optic neuritis,10 primary angle-closure glaucoma11 and unilateral acute open globe injury.12
Resting-state functional connectivity (rsFC) analysis is an effective method with which to estimate spontaneous functional activity via FC, and measures temporal relevance between the blood oxygen level-dependent (BOLD) signals of two brain areas which occur in turn.13 Through functional connectivity density (FCD) mapping of voxels across the whole brain, long-range (longFCD) and short-range FCD (IFCD) can be separately calculated, which contributes to the evaluation of functional information of the whole brain. As the alternations of FCD can reflect the spontaneous neural activities, it can be applied to reveal the functional connections between different brain areas. According to previous studies, rsFC has been widely used to explore the abnormal FCD alternations in several diseases, including Alzheimer’s disease,14 Parkinson’s disease,15 depression16 and primary open-angle glaucoma.17
The purpose of this study was to utilize the rsFC method to evaluate alterations in resting-state longFCD and IFCD values in CU patients with rsFC values as a standard. We hypothesized that this study may provide evidence which could reveal the underlying neural mechanisms of CU patients.
Materials and methods
Subjects
We recruited 24 patients with CU (12 males, 12 females), and 24 healthy controls (HCs; 12 males, 12 females) who were matched for age, gender, and education status. All patients with CU were diagnosed in the Ophthalmology Department of the First Affiliated Hospital of Nanchang University. The inclusion criteria of CU patients were: (1) obvious infiltration and necrosis in the cornea as demonstrated by a slit lamp (Figure 1); (2) a duration of CU >2 weeks; (3) neither of the eyes showed any other ocular disease (such as cataracts, glaucoma, strabismus, retinal degeneration, or optic neuritis).
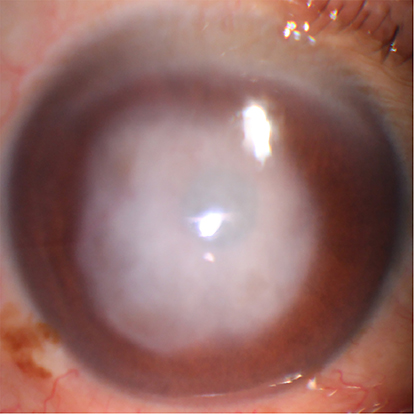 |
Figure 1 An example of corneal ulcer shown in slit lamp. |
Patients with CU were excluded from the study if they had: (1) ocular trauma or ocular surgery; (2) cardiovascular diseases (such as hypertension and heart disease); (3) psychiatric diseases (such as anxiety disorders, Alzheimer’s disease or depression disorders); and (4) conditions which may affect rsFC and FCD values. The inclusion criteria for HCs were as follows: (1) no ocular disease and a naked eye or corrected visual acuity (VA) >1.0; (2) no abnormalities in the brain parenchyma diagnosed by cranial MRI; (3) no neurological or psychiatric disorders; (4) no eye diseases which may lead to corneal impairment; (5) no history of addiction (such as drug and alcohol); and (6) are able to undergo MRI scanning.
This study was approved by the Medical Ethics Committee of the First Affiliated Hospital. All methods used in the study followed the tenets of the Declaration of Helsinki and complied with the principles of medical ethics. All of the subjects volunteered to participate in the protocol and understood the purpose, methods, and potential risks involved. All of the subjects provided signed and informed consent prior to recruitment.
MRI data acquisition
A 3.0 Tesla MR scanner (Siemens, produced in Berlin, Germany) was used to perform all MRI examinations. T1- and T2-imaging sequences were implemented with the following parameter (TR =1,900 ms, TE =2.26 ms, thickness =1.0 mm, gap =0.5 mm, FOV =250 mm ×250 mm, matrix =256×256, flip angle =9°, 176 sagittal slices).13 A gradient echo-planar imaging sequence in the resting-state scan session was applied to acquire 240 functional volumes, using the following parameters: repetition time (TR) =2,000 ms; echo time =30ms; slice gap =1 mm; matrix size =64*64 and flip angle (FA) =90°. Using interleaved acquisition, we also obtained 35 oblique slices which were parallel to the AC-PC line. A sagittal FSPGR-BRAVO sequence was utilized to acquire T1-weighted images with the following parameters: TR =8.208 s; inversion time (T1) =450ms; TE =3.22 ms; FOV =240*240 mm; voxel size =0.5mm*0.5 mm*1 mm and FA=12°.
Data analysis
MRIcro software (www.MRIcro.com) was used to ensure data quality. The first 10 images were deleted to avoid probable instability. Preprocessing of the remaining data was performed with the Data Processing & Analysis for Brain Imaging (DPABI 2.1, http://rfmri.org/DPABI) toolbox which was based on MATLAB2010a (Mathworks, Natick, MA, USA). Participants were asked to keep their body still until the scan had been completed. On account of recent research showing that higher-order models benefit from the removal of head motion effects, we deleted the potential effect of head motion using the Friston 24 head motion parameters model (6 head motion parameters, 6 head motion parameters from the previous time point, and 12 corresponding squared items).18,19 Linear regression was then performed to remove variables from other sources. Following head motion correction, the functional images were normalized spatially to the Montreal Neurological Institute (MNI) space. Then, band-pass filtering (0.01–0.1 Hz), and linear attenuation, were applied to the time series of each voxel to reduce the effect of low frequency drift, breathing, cardiac noise and linear attenuation of the time series.
Calculation of long- and short-range FCD calculation maps
FCD maps contained long-and short-range FCD maps; the short-range FCD was also referred to as local FCD (IFCD). Participants were assessed in gray matter (GM) when using FCD maps. Based on Pearson correlation between the time course of given voxels and other voxels, the number of functional connections of the given voxels was considered as the degree of nodes in binary graphs. Computation of IFCD and longFCD values was carried out using Brainwaver toolbox (http://cran.rproject.org/src/contrib/Archive/brainwaver). For each node of the network, several measures of connectivity can be estimated. Nodal and local efficiency, which are the well-adapted metrics to estimate the performance of small-world brain functional networks, were estimated.20 At first, whole brain functional connectivity between the given voxel and other voxels was defined by the correlation threshold r>0.25.14 In the current study, the IFCD voxels met the correlation threshold of r>0.25 inside their neighborhood (anatomical distance ≤14 mm) and those with an anatomical distance >14 mm were finally defined as longFCD. To enhance normality, the IFCD and longFCD maps were converted to Z scores. Finally, a 6×6×6 mm3 full-width Gaussian kernel was applied to spatially smoothen the IFCD and longFCD maps at half-maximum with Statistical Parametric Mapping SPM8 (The MathWorks, Inc., Natick, MA, USA).
Ophthalmic testing
All subjects were tested with a Snellen vision chart. The test condition was that all subjects were kept 5 meters standing away from the vision chart and their gaze was maintained parallel with the line of 1.0 on vision chart.
Statistical analysis
Clinical variables were analyzed using SPSS 16.0 software (SPSS, Chicago, IL, USA) and an independent sample t-test (P<0.05 represented significant differences). rsFC, longFCD and IFCD values were extracted from the subjects within each group and the differences between CU patients and HCs were evaluated using a one-sample t-test (P<0.05). The SPM8 toolkit was used to create a linear model. Two sample t-tests were used to assess differences in CBF maps between the CU group and the HC group (voxel-level was P<0.01, Gaussian random field theory (GRF) corrected, and P<0.05 was considered to be statistically significant).
The receiver operating characteristic (ROC) curve method was used to analyze the mean rsFC, longFCD and IFCD in different brain areas between the two groups. The relationships between mean rsFC, longFCD and IFCD in different brain areas from the patients in the CU group, and the clinical features of these patients, were investigated by Pearson correlation (P<0.05 was considered to be statistically significant).
Results
Demographic and visual measurements
There were no significant differences in in terms of weight (P=0.911) or age (P=0.941) between CU patients and HCs; however, there were significant differences in best-corrected VA-left (P<0.001) and best-corrected VA-right (P<0.001). The mean duration of CU was 26.75±7.92 days (Table 1).
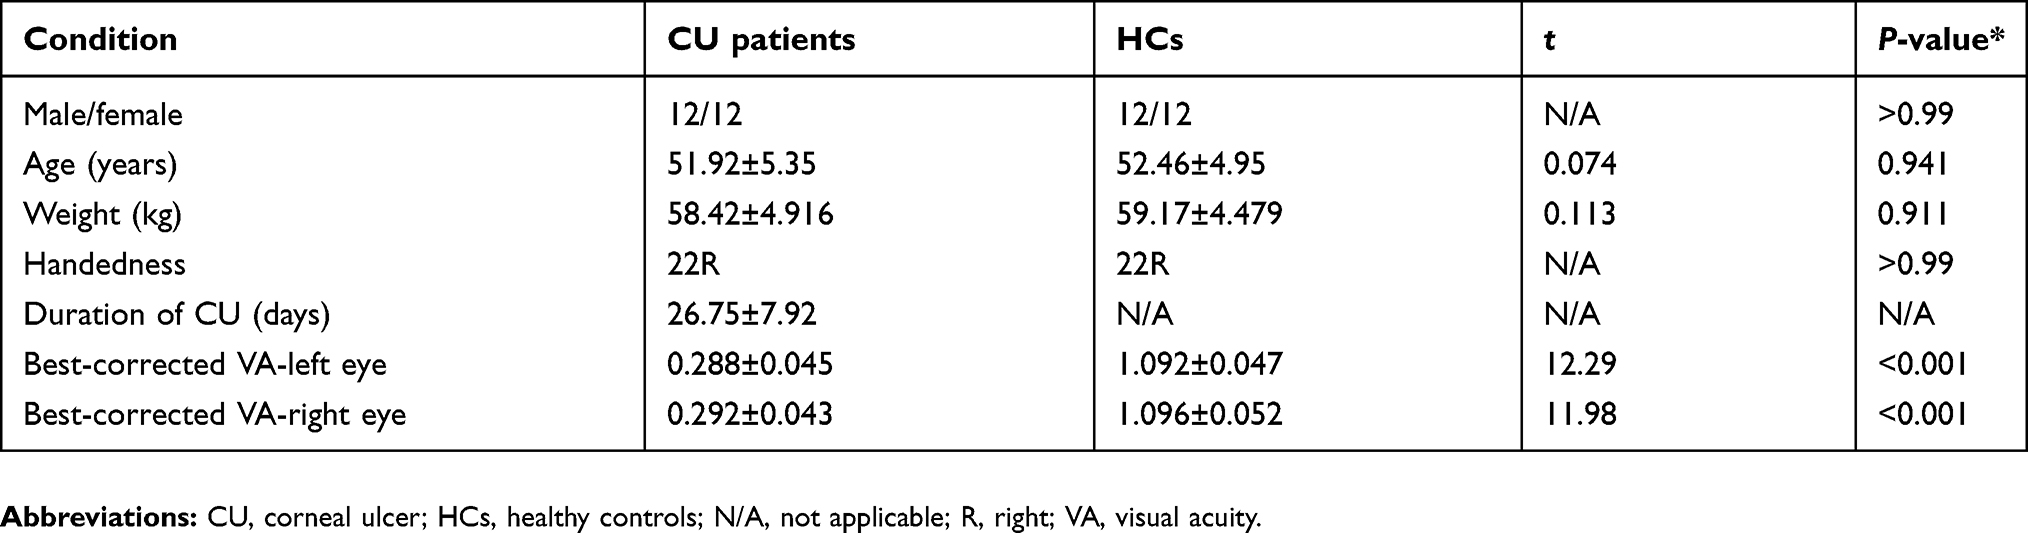 |
Table 1 Demographic information and visual measurements of CU patients and HCs |
rsFC and FCD analysis
Compared with HCs, patients with CU presented with significantly lower rsFC values in the right cerebellum posterior lobe gyrus (CPLG), the right middle frontal gyrus/inferior frontal gyrus/superior frontal gyrus (MFG/IFG/SFG) and the left inferior parietal lobule/precuneus (IPL/P) (Table 2, Figures 3A and 4A). Significantly reduced longFCD values were detected in the right hippocampus/inferior temporal gyrus (H/ITG) and the left inferior temporal gyrus (ITG) (Table 3, Figures 2A, 3B, and 4B). Moreover, compared with HCs, IFCD values were significantly lower in the left inferior temporal gyrus/middle temporal gyrus (ITG/MTG), the left limbic lobe/medial frontal gyrus (LL/MFG), and the left precuneus/limbic lobe (P/LL), but significantly higher in the right insula/superior temporal gyrus (I/STG), the left superior temporal gyrus/inferior frontal gyrus/insula (STG/IFG/I), the right superior temporal gyrus/postcentral gyrus (STG/PG), and the left precentral gyrus (PG) (Table 4, Figures 2B, 3C, and 4C).
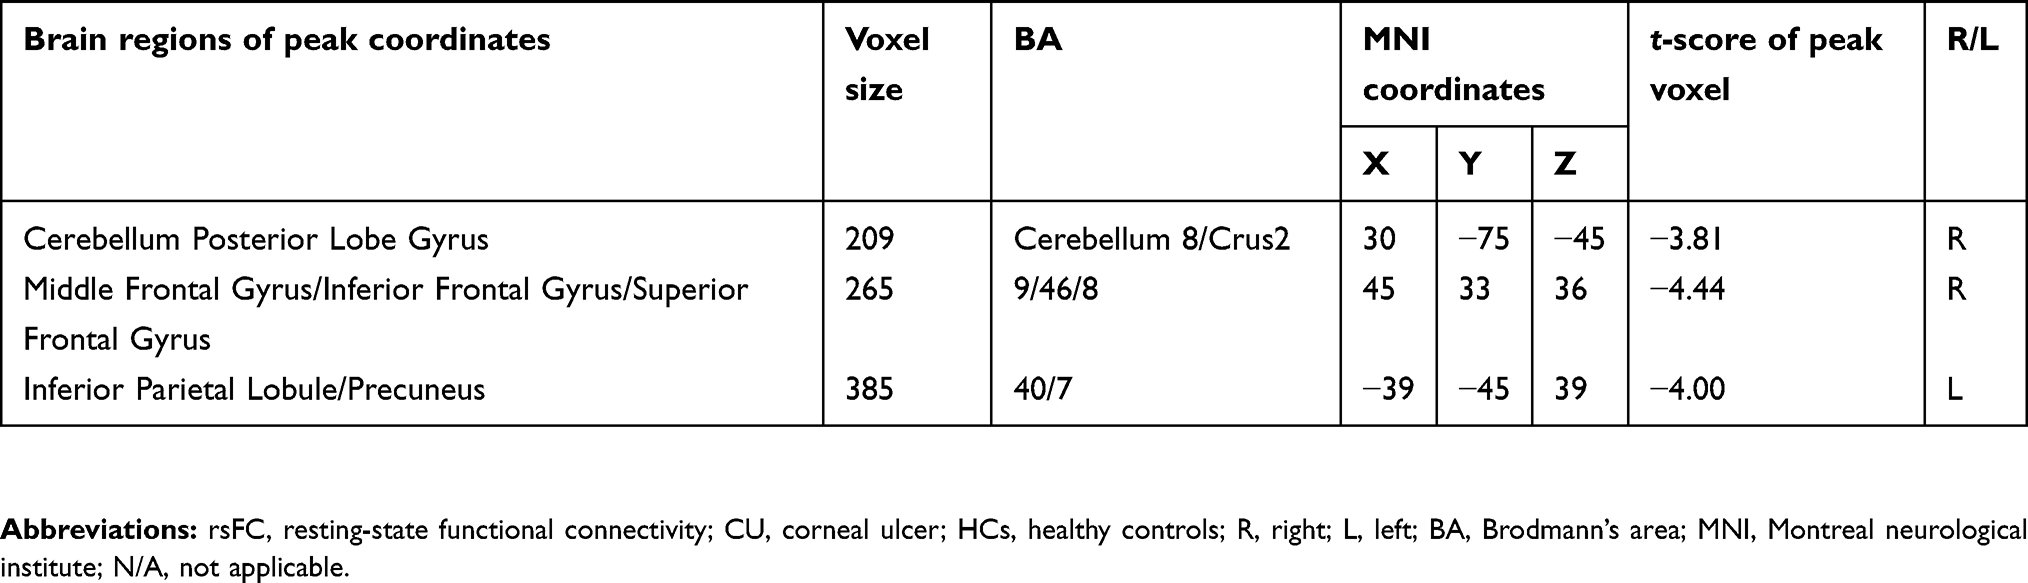 |
Table 2 The binarized rsFC differences between CU patients and HCs |
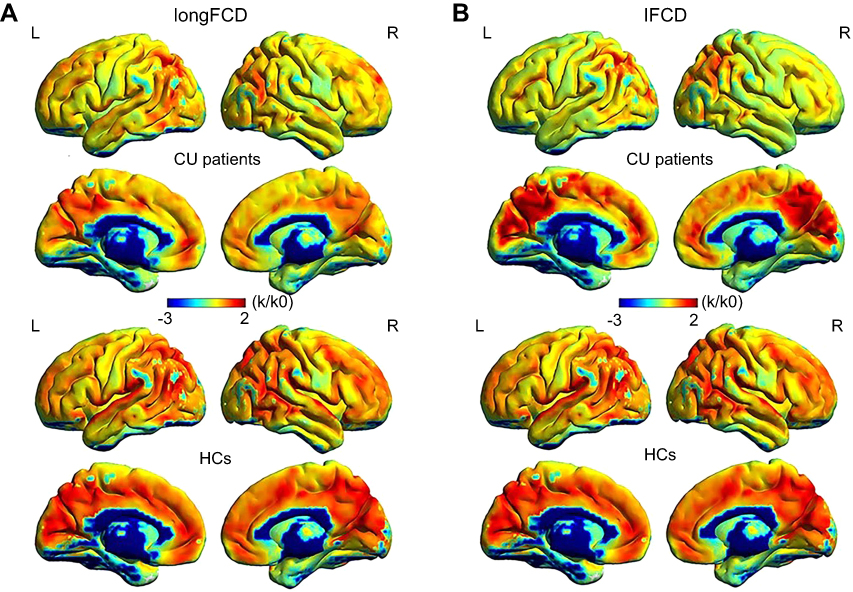 |
Figure 2 One sample t-test differences of CU patients and HCs in binarized longFCD and IFCD. The red areas denote higher values and the blue areas denote lower values. (A) Significant longFCD differences were observed in the right hippocampus/inferior temporal gyrus, left inferior temporal gyrus. The means of altered longFCD between the CU patients and HCs (voxel level P<0.01 and cluster level P<0.05, Gaussian random field (GRF) theory corrected). (B) Significant IFCD differences were observed in the left inferior temporal gyrus/middle temporal gyrus, left limbic lobe/medial frontal gyrus, left precuneus/limbic lobe, right insula/superior temporal gyrus, left superior temporal gyrus/inferior frontal gyrus/insula, right superior temporal gyrus/postcentral gyrus, left precentral gyrus. The means of altered IFCD between the patients with CU and HCs (voxel level P<0.01 and cluster level P<0.05, Gaussian random field (GRF) theory corrected).Abbreviations: longFCD, long-range functional connectivity density; IFCD, short-range functional connectivity density; CU, corneal ulcer; HCs, healthy controls; L, left; R, right. |
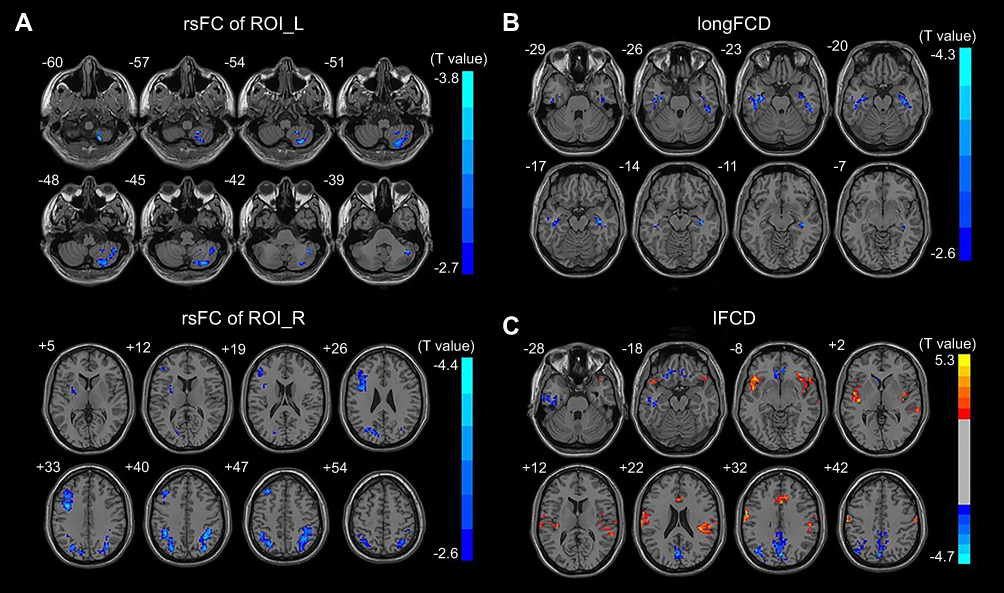 |
Figure 3 Binarized rsFC, longFCD and IFCD differences between two groups. (A) Binarized rsFC differences between CU patients and HCs. The red areas denote higher values, and the blue areas denote lower values. (B) Binarized longFCD differences between CU patients and HCs. The red areas denote higher values, and the blue areas denote lower values. (C) Binarized IFCD differences between CU patients and HCs. The red areas denote higher values, and the blue areas denote lower values. Abbreviations: rsFC, resting-state functional connectivity; longFCD, long-range functional connectivity density; IFCD, short-range functional connectivity density; CU, corneal ulcer; HCs, healthy controls; ROI, different regions of interest; L, left; R, right. |
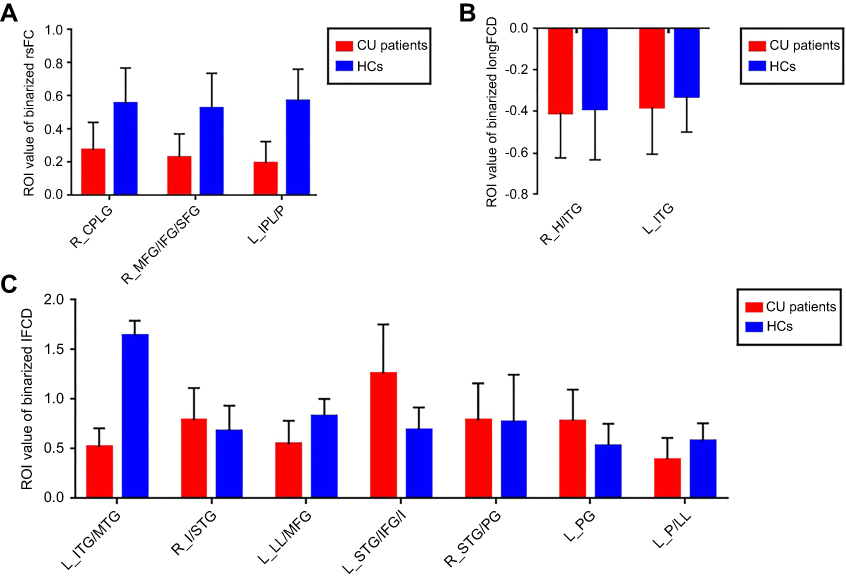 |
Figure 4 Binarized rsFC, IFCD and longFCD of between-group differences in different brain regions. (A) Binarized rsFC value of between-group differences in different brain regions. The red bar denotes the rsFC value of CU patients, the blue bar denotes the rsFC value of HCs. (B) Binarized longFCD value of between-group differences in different brain areas. The red bar denotes the longFCD value of CU patients, the blue bar denotes the longFCD value of HCs. (C) Binarized IFCD value of between-group differences in different brain areas. The red bar denotes the IFCD value of CU patients, the blue bar denotes the IFCD value of HCs. Abbreviations: rsFC, resting-state functional connectivity; longFCD, long-range functional connectivity density; IFCD, short-range functional connectivity density; CU, corneal ulcer; HCs, healthy controls; L, left; R, right; CPLG, Cerebellum Posterior Lobe Gyrus; MFG/IFG/SFG, Middle Frontal Gyrus/Inferior Frontal Gyrus/Superior Frontal Gyrus; IPL/P, Inferior Parietal Lobule/Precuneus; H/ITG, Hippocampus/Inferior Temporal Gyrus; ITG, Inferior Temporal Gyrus; ITG/MTG, Inferior Temporal Gyrus/Middle Temporal Gyrus; I/STG, Insula/Superior Temporal Gyrus; LL/MFG, Limbic Lobe/Medial Frontal Gyrus; STG/IFG/I, Superior Temporal Gyrus/Inferior Frontal Gyrus/Insula; STG/PG, Superior Temporal Gyrus/Postcentral Gyrus; PG, Precentral Gyrus; P/LL, Precuneus/Limbic Lobe. |
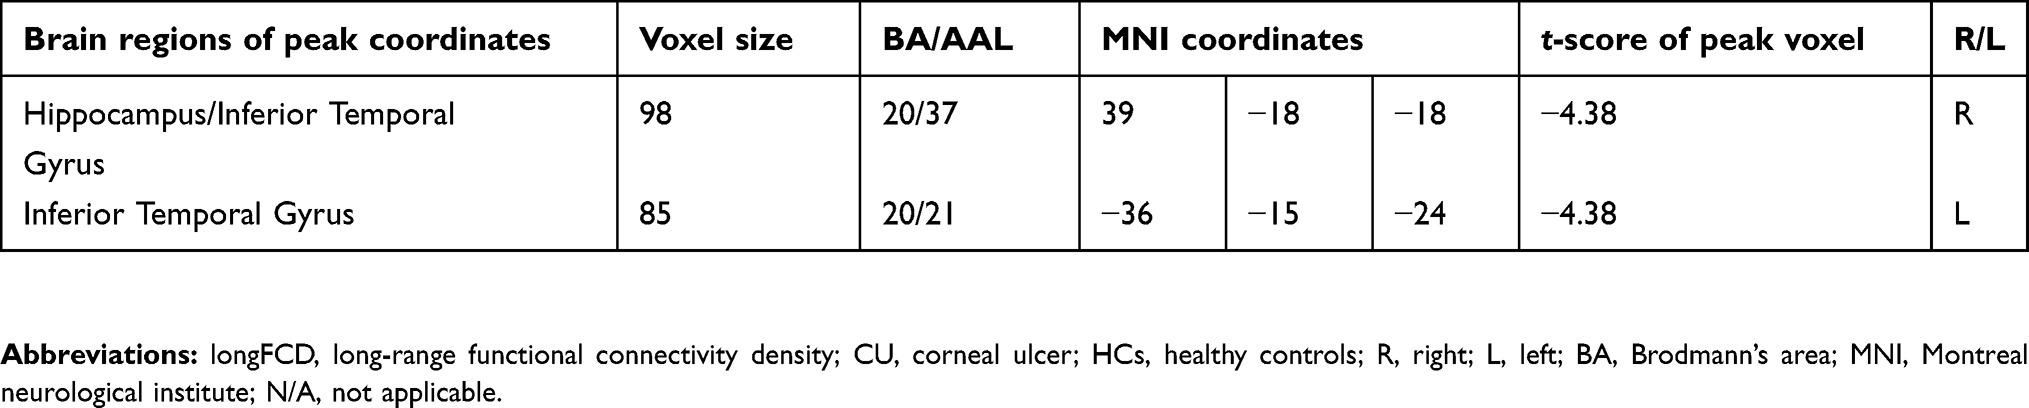 |
Table 3 The binarized longFCD differences between CU patients and HCs |
 |
Table 4 The binarized IFCD differences between CU patients and HCs |
Receiver operating characteristic curve analysis
We speculated that differences in rsFC, longFCD and IFCD values might represent feasible diagnostic biomarkers with which to distinguish between our CU and HC groups. We used the ROC curve method to confirm this this assumption, using the mean rsFC and FCD values from different regions of the cerebrum. An area under the curve (AUC) value of 0.5–0.7 implies low accuracy, while AUC values of 0.7–0.9 imply medium accuracy, and AUC values >0.9 imply high accuracy.21 Our analysis for rsFC yielded the following AUC values: 0.849 for the right cerebellum posterior lobe gyrus (CPLG); 0.892 for the right middle frontal gyrus/inferior frontal gyrus/superior frontal gyrus (MFG/IFG/SFG); and 0.939 for the left inferior parietal lobule/precuneus (IPL/P) (Figure 5A). The AUCs for longFCD were 0.703 for the left inferior temporal gyrus (ITG), and 0.773 for the right hippocampus/inferior temporal gyrus (H/ITG) (Figure 5B). The AUC values for IFCD were 1.000 for the left inferior temporal gyrus/middle temporal gyrus (ITG/MTG), 0.890 for the left limbic lobe/medial frontal gyrus (LL/MFG), 0.764 for the left precuneus/limbic lobe (P/LL), 0.592 for the right insula/superior temporal gyrus (I/STG), 0.812 for the left superior temporal gyrus/inferior frontal gyrus/insula (STG/IFG/I), 0.536 for the right superior temporal gyrus/postcentral gyrus (STG/PG) and 0.736 for the left precentral gyrus (PG) (Figure 5C and D).
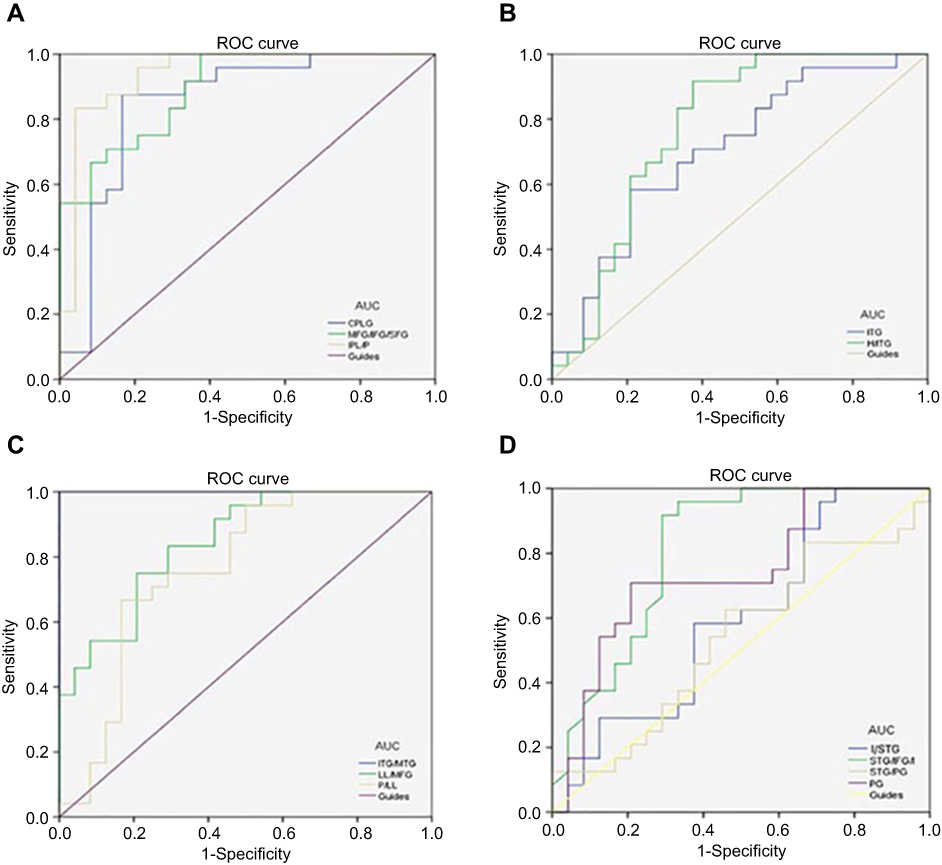 |
Figure 5 ROC curve analysis of the mean rsFC, IFCD and longFCD values for altered brain regions. (A) The area under the ROC curve were 0.849, (P<0.001; 95% CI: 0.730–0.968) for CPLG, MFG/IFG/SFG 0.892 (P<0.001; 95% CI: 0.806–0.978), IPL/P 0.939 (P<0.001; 95% CI: 0.867–1.000). (B) The area under the ROC curve was 0.703 (P<0.05; 95% CI: 0.554–0.852) for ITG, H/ITG 0.773 (P<0.001; 95% CI: 0.633–0.912). (C) The area under the ROC curve was 1.000 (P<0.001; 95% CI: 1.000–1.000) for ITG/MTG, LL/MFG 0.890 (P<0.001; 95% CI: 0.739–0.952), P/LL 0.764 (P<0.001; 95% CI: 0.623–0.905). (D) The area under the ROC curve was 0.592 (P>0.05; 95% CI: 0.428–0.756) for I/STG, STG/IFG/I 0.812 (P<0.001; 95% CI: 0.686–0.939), STG/PG 0.536 (P>0.05; 95% CI: 0.370–0.703), PG 0.736 (P<0.001; 95% CI: 0.591–0.881). Abbreviations: AUC, area under the curve; rsFC, resting-state functional connectivity; longFCD, long-range functional connectivity density; IFCD, short-range functional connectivity density; ROC, receiver operating characteristic; Cl, confidence interval; CPLG, Cerebellum Posterior Lobe Gyrus; MFG/IFG/SFG, Middle Frontal Gyrus/Inferior Frontal Gyrus/Superior Frontal Gyrus; IPL/P, Inferior Parietal Lobule/Precuneus; H/ITG, Hippocampus/Inferior Temporal Gyrus; ITG, Inferior Temporal Gyrus; ITG/MTG, Inferior Temporal Gyrus/Middle Temporal Gyrus; I/STG, Insula/Superior Temporal Gyrus; LL/MFG, Limbic Lobe/Medial Frontal Gyrus; STG/IFG/I, Superior Temporal Gyrus/Inferior Frontal Gyrus/Insula; STG/PG, Superior Temporal Gyrus/Postcentral Gyrus; PG, Precentral Gyrus; P/LL, Precuneus/Limbic Lobe. |
Discussion
To our knowledge, this is the first study to explore the effects of CU on alterations in brain functionality using resting-state functional connectivity (rsFC) methodology and investigate the relationship between fMRI and clinical behavior. Compared with HCs, patients with CU showed significantly reduced rsFC values in the right cerebellum posterior lobe gyrus (CPLG), the right middle frontal gyrus/inferior frontal gyrus/superior frontal gyrus (MFG/IFG/SFG) and the left inferior parietal lobule/precuneus (IPL/P) with impaired visual function (Figure 6). Significantly reduced longFCD values were also detected in the right hippocampus/inferior temporal gyrus (H/ITG) and the left inferior temporal gyrus (ITG) (Figure 7). In addition, compared with HCs, patients with CU presented with significantly lower IFCD values in the left inferior temporal gyrus/middle temporal gyrus (ITG/MTG), the left limbic lobe/medial frontal gyrus (LL/MFG), and the left precuneus/limbic lobe (P/LL), but significantly higher IFCD values in the right insula/superior temporal gyrus (I/STG), left superior temporal gyrus/inferior frontal gyrus/insula (STG/IFG/I), right superior temporal gyrus/postcentral gyrus (STG/PG) and left precentral gyrus (PG) with impaired visual function (Figure 8).
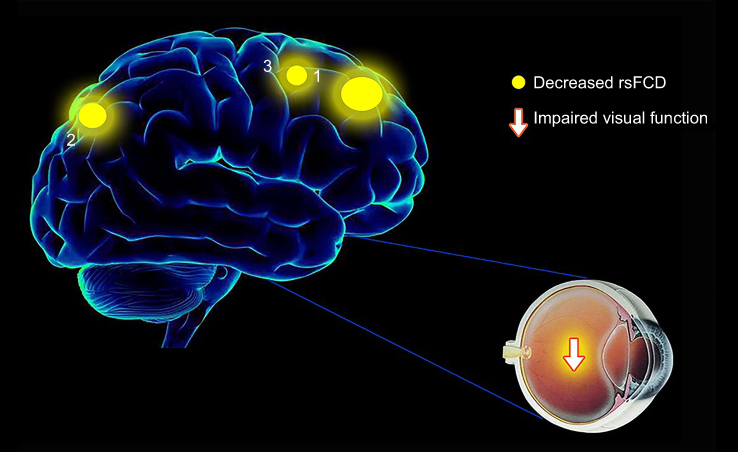 |
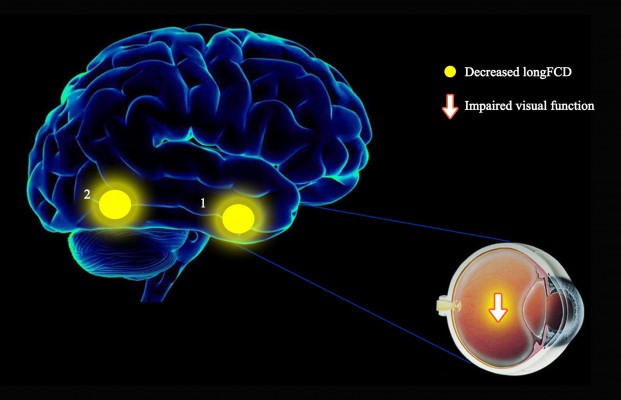
Figure 6 The mean rsFC values of altered brain regions in the CU group. The sizes of the spots denote the degree of quantitative changes. compared with the HCs, the rsFC values of the following regions were decreased to various extents: 1 - middle frontal gyrus/inferior frontal gyrus/superior frontal gyrus (BA9/46/8, t=−4.44), 2 - inferior parietal lobule/precuneus (BA40/7, t=−4.00), 3 - cerebellum posterior lobe gyrus (t=−3.81). Abbreviations: rsFC, resting-state functional connectivity; CU, corneal ulcer; HCs, healthy controls; BA, Brodmann’s area. |
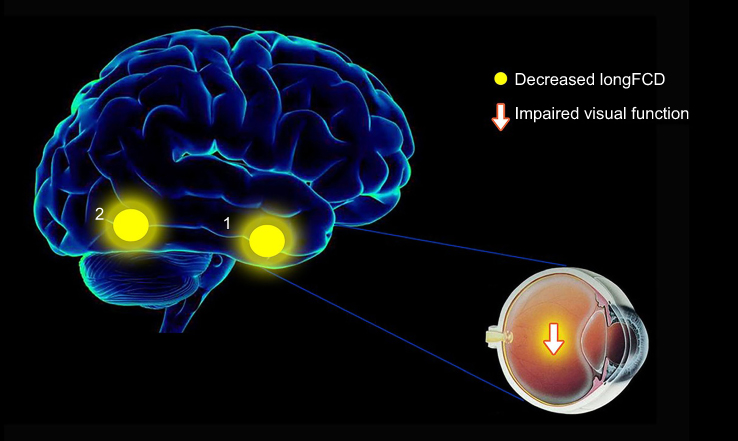 |
Figure 7 The mean longFCD values of altered brain regions in the CU group. The sizes of the spots denote the degree of quantitative changes. Compared with the HCs, the longFCD values of the following regions were decreased to various extents: 1 - inferior temporal gyrus (BA20/21, t=−4.38), 2 - hippocampus/inferior temporal gyrus (BA20/37, t=−4.38). Abbreviations: longFCD, long-range functional connectivity density; CU, corneal ulcer; HCs, healthy controls; BA, Brodmann’s area. |
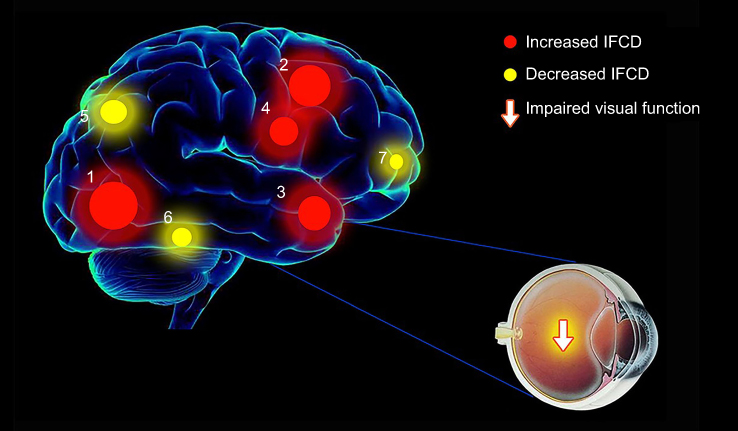 |
Figure 8 The mean IFCD values of altered brain regions in the CU group. The sizes of the spots denote the degree of quantitative changes. Compared with the HCs, the IFCD values of the following regions were increased to various extents: 1 - insula/superior temporal gyrus (BA22/13, t=5.33), 2 - precentral gyrus (BA6/4, t=5.01), 3 - superior temporal gyrus/inferior frontal gyrus/insula (BA22/13/38, t=4.94), 4 - superior temporal gyrus/postcentral gyrus (BA13/6, t=4.88), whereas the IFCD values of the following regions were decreased: 5 - precuneus/limbic lobe (BA7/31, t=−4.33), 6 - inferior temporal gyrus/middle temporal gyrus (BA20/22, t=−3.97), 7 - limbic lobe/medial frontal gyrus (BA11/32/47, t=−3.88). Abbreviations: IFCD, short-range functional connectivity density; CU, corneal ulcer; HCs, healthy controls; BA, Brodmann’s area. |
The middle frontal gyrus (MFG) is part of the frontal gyrus. The MFG is not only involved in language processing,22 but is also responsible for inhibitory errors23 and attention.24,25 A range of diseases are associated with dysfunction in the MFG, such as attention deficit hyperactivity disorder (ADHD)26 and schizophrenia.27 Previous studies have shown that dysfunction of the frontal gyrus is evident in patients suffering from depression.24 In addition, eye pain and corneal symptoms appear to be related to depression in some individuals.28,29 In agreement with these findings, we found that rsFC values in the right MFG were significantly decreased in patients with CU, thus indicating abnormal functionality of the MFG. We therefore speculated that MFG dysfunction might be associated with the depression which occurs in patients with CU.
As a component of the parietal lobule, the inferior parietal lobule (IPL) is known to contribute to language learning30 and the selection of information relating to visual space.31 Previous studies have shown that the volume of white matter is reduced in the left IPL in patients with concomitant exotropia.32 Moreover, Ding et al.33 demonstrated that rsFC were reduced in the IPL of patients with amblyopia, thus reflecting dysfunction in this region of the brain. In our present study, we detected lower rsFC values in the left IPL of patients with CU compared with HCs, which might indicate defects in spatial selectivity.
The inferior temporal gyrus (ITG) is located in the anterior part of the temporal lobe and is involved in the classification of visual shape34 and visual memory.35 Previous research has illustrated that three-dimensional structures, defined by binocular disparity, were responded by the ITG with visual selectivity.36,37 Abnormalities in the ITG are known to play a role in a range of diseases, including Alzheimer’s disease,38 optic neuritis10 and blindness.39 In our present study, we found that patients with CU had reduced long FCD values in the right ITG. Furthermore, decreased IFCD and longFCD values were both observed in the left ITG. The evaluation of FCD, as a useful aspect of rs-fMRI studies, may help to reveal alterations in the brain function of CU patients. Thus, lower FCD values in the bilateral ITG might reflect damage in this region of the brain; consequently, patients with CU may have defects in visual selectivity and visual memory.
The medial frontal gyrus (MFG), including the frontal eye field (FEF), is located in the middle of the frontal gyrus and is associated with empathy.40 Dysfunction in the MFG is known to occur in several psychiatric disorders. For example, Myung et al.41 showed that patients with adjustment disorder, also had a significant reduction in gray matter volume in the right medial frontal gyrus. Moreover, Tan et al.12 demonstrated that the amplitude of low-frequency fluctuation (ALFF) signal values in the bilateral MFG were lower in patients with strabismus, which might indicate alterations in the local synchronization of spontaneous brain activities. In the current study, we found that CU patients had reduced IFCD values in the left MFG. Therefore, we speculate that CU might be associated with dysfunctional activity in the MFG.
The precuneus lies on the front of the occipital lobe and is responsible for episodic memory42 and consciousness.43 Previous studies have shown that the precuneus also contributes to the encoding of spatial locations and visuospatial mental operations.44,45 In the current study, we found that CU patients showed lower IFCD values in the precuneus; this was consistent with rsFC values and may reflect the fact that damage in the precuneus is related to dysfunctional spatial orientation in CU patients.
The superior temporal gyrus (STG) locates in the temporal lobe and is responsible for language comprehension,46 auditory processing,47 and visual search.48 Previous studies have reported that STG dysfunction might be associated with a range of diseases, including schizophrenia,49 Alzheimer’s disease,50 adult concomitant exotropia strabismus51 and unilateral acute open-globe injury.52 In our present study, we found that IFCD values in the STG were significantly increased in patients with CU, indicating that CU might be related to abnormal function in the STG.
The insula lies in the lateral sulcus and is known to play an important role in emotion and cognition.53–55 Grecucci et al.56 previously demonstrated that hyperactivation of the insula was responsible for emotional regulation. Furthermore, previous studies have found that the insula also contributes to pain-related processing.57 We observed that patients with CU presented with higher IFCD values in the insula, which might suggest that the compensation mechanism in the insula deals with ocular pain and negative emotion during CU. Therefore, we speculate that CU might be responsible for hyper-functional activity in the insula.
Conclusion
We found that patients with CU exhibited abnormal neural activities in specific brain areas, as evidenced by clear variation in binarized rsFC, longFCD and IFCD values. These findings might provide some useful insight with which to identify specific mechanisms associated with the functional brain activity alterations in patients with CU.
Acknowledgments
The authors would like to thank the National Natural Science Foundation of China (No: 81660158, 81460092, 81400372); Natural Science Key Project of Jiangxi Province (No: 20161ACB21017); Health Development Planning Commission Science Foundation of Jiangxi Province (No:20175116).
Disclosure
The authors report no conflicts of interest in this work.
References
1. Austin A, Lietman T, Rose-Nussbaumer J. Update on the management of infectious keratitis. Ophthalmology. 2017;124(11):1678–1689. doi:10.1016/j.ophtha.2017.05.012
2. Whitcher JP, Srinivasan M, Upadhyay MP. Corneal blindness: a global perspective. B World Health Organ. 2001;79(3):214–221.
3. Pascolini D, Mariotti SP. Global estimates of visual impairment: 2010. Brit J Ophthalmol. 2012;96(5):614–618. doi:10.1136/bjophthalmol-2011-300539
4. McLeod SD, KolahdouzIsfahani A, Rostamian K, Flowers CW, Lee PP, McDonnell PJ. The role of smears, cultures, and antibiotic sensitivity testing in the management of suspected infectious keratitis. Ophthalmology. 1996;103(1):23–28.
5. Kim E, Chidambaram JD, Srinivasan M, et al. Prospective comparison of microbial culture and polymerase chain reaction in the diagnosis of corneal ulcer. Am J Ophthalmol. 2008;146(5):714–723. doi:10.1016/j.ajo.2008.06.009
6. Chang HY, Chodosh J. Diagnostic and therapeutic considerations in fungal keratitis. Int Ophthalmol Clin. 2011;51(4):33–42. doi:10.1097/IIO.0b013e31822d64dc
7. Oday DM, Head WS, Robinson RD, Clanton JA. Corneal penetration of topical amphotericin-B and natamycin. Curr Eye Res. 1986;5(11):877–882.
8. Morfin F, Thouvenot D. Herpes simplex virus resistance to antiviral drugs. J Clin Virol. 2003;26(1):29–37.
9. Shi WQ, Liu JX, Yuan Q, et al. Alternations of interhemispheric functional connectivity in corneal ulcer patients using voxel-mirrored homotopic connectivity: a resting state fMRI study. Acta Radiol. 2018;284185118815308. doi: 10.1177/0284185118815308.
10. Huang X, Cai FQ, Hu PH, et al. Disturbed spontaneous brain-activity pattern in patients with optic neuritis using amplitude of low-frequency fluctuation: a functional magnetic resonance imaging study. Neuropsychiatr Dis Treat. 2015;11:3075–3083. doi:10.2147/NDT.S92497
11. Huang X, Zhong YL, Zeng XJ, et al. Disturbed spontaneous brain activity pattern in patients with primary angle-closure glaucoma using amplitude of low-frequency fluctuation: a fMRI study. Neuropsych Dis Treat. 2015;11:1877–1883.
12. Tan G, Huang X, Ye L, et al. Altered spontaneous brain activity patterns in patients with unilateral acute open globe injury using amplitude of low-frequency fluctuation: a functional magnetic resonance imaging study. Neuropsych Dis Treat. 2016;12:2015–2020. doi:10.2147/NDT.S110539
13. Tomasi D, Volkow ND. Functional connectivity density mapping. P Natl Acad Sci USA. 2010;107(21):9885–9890. doi:10.1073/pnas.1001414107
14. Hata M, Kazui H, Tanaka T, et al. Functional connectivity assessed by resting state EEG correlates with cognitive decline of Alzheimer’s disease - an eLORETA study. Clinical Neurophysiology. 2016;127(2):1269–1278. doi:10.1016/j.clinph.2015.10.030
15. Hu XF, Jiang YC, Jiang XM, et al. Altered functional connectivity density in subtypes of Parkinson’s Disease. Front Hum Neurosci. 2017;11. doi:10.3389/fnhum.2017.00458
16. Maglanoc LA, Landro NI, Jonassen R, et al. Data-driven clustering reveals a link between symptoms and functional brain connectivity in depression. Biol Psychiatry Cogn Neurosci Neuroimaging. 2019;4(1):16–26. doi:10.1016/j.bpsc.2018.05.005
17. Dai H, Morelli JN, Ai F, et al. Resting-state functional MRI: functional connectivity analysis of the visual cortex in primary open-angle glaucoma patients. Hum Brain Mapp. 2013;34(10):2455–2463. doi:10.1002/hbm.22079
18. Satterthwaite TD, Elliott MA, Gerraty RT, et al. An improved framework for confound regression and filtering for control of motion artifact in the preprocessing of resting-state functional connectivity data. Neuroimage. 2013;64:240–256. doi:10.1016/j.neuroimage.2012.08.052
19. Yan CG, Cheung B, Kelly C, et al. A comprehensive assessment of regional variation in the impact of head micromovements on functional connectomics. Neuroimage. 2013;76(1):183–201. doi:10.1016/j.neuroimage.2013.03.004
20. Beucke JC, Sepulcre J, Talukdar T, et al. Abnormally high degree connectivity of the orbitofrontal cortex in obsessive-compulsive disorder. JAMA Psychiatry. 2013;70(6):619–629. doi:10.1001/jamapsychiatry.2013.173
21. Huang X, Zhou S, Su T, et al. Resting cerebral blood flow alterations specific to the comitant exophoria patients revealed by arterial spin labeling perfusion magnetic resonance imaging. Microvasc Res. 2018;120:67–73. doi:10.1016/j.mvr.2018.06.007
22. Kotz SA, Cappa SF, von Cramon DY, Friederici AD. Modulation of the lexical-semantic network by auditory semantic priming: an event-related functional MRI study. Neuroimage. 2002;17(4):1761–1772.
23. Heitzeg MM, Nigg JT, Hardee JE, et al. Left middle frontal gyrus response to inhibitory errors in children prospectively predicts early problem substance use. Drug Alcohol Depen. 2014;141:51–57. doi:10.1016/j.drugalcdep.2014.05.002
24. Andersson M, Ystad M, Lundervold A, Lundervold AJ. Correlations between measures of executive attention and cortical thickness of left posterior middle frontal gyrus - a dichotic listening study. Behav Brain Funct. 2009;5:41. doi:10.1186/1744-9081-5-41
25. Japee S, Holiday K, Satyshur MD, Mukai I, Ungerleider LG. A role of right middle frontal gyrus in reorienting of attention: a case study. Front Syst Neurosci. 2015;9:23. doi:10.3389/fnsys.2015.00023
26. Tafazoli S, O’Neill J, Bejjani A, et al. H-1 MRSI of middle frontal gyrus in pediatric ADHD. J Psychiatr Res. 2013;47(4):505–512. doi:10.1016/j.jpsychires.2012.11.011
27. Quan MN, Lee SH, Kubicki M, et al. White matter tract abnormalities between rostral middle frontal gyrus, inferior frontal gyrus and striatum in first-episode schizophrenia. Schizophr Res. 2013;145(1–3):1–10. doi:10.1016/j.schres.2012.11.028
28. Tang LY, Li HJ, Huang X, et al. Assessment of synchronous neural activities revealed by regional homogeneity in individuals with acute eye pain: a resting-state functional magnetic resonance imaging study. J Pain Res. 2018;11:843–850. doi:10.2147/JPR.S156634
29. Labbe A, Wang YX, Jie Y, Baudouin C, Jonas JB, Xu L. Dry eye disease, dry eye symptoms and depression: the beijing eye study. Br J Ophthalmol. 2013;97(11):1399–1403. doi:10.1136/bjophthalmol-2013-303838
30. Sliwinska MW, James A, Devlin JT. Inferior parietal lobule contributions to visual word recognition. J Cogn Neurosci. 2015;27(3):593–604. doi:10.1162/jocn_a_00721
31. Egner T, Monti JM, Trittschuh EH, Wieneke CA, Hirsch J, Mesulam MM. Neural integration of top-down spatial and feature-based information in visual search. J Neurosci. 2008;28(24):6141–6151. doi:10.1523/JNEUROSCI.1262-08.2008
32. Yan X, Lin X, Wang Q, et al. Dorsal visual pathway changes in patients with comitant extropia. PLoS One. 2010;5(6):e10931. doi:10.1371/journal.pone.0010931
33. Ding K, Liu Y, Yan X, Lin X, Jiang T. Altered functional connectivity of the primary visual cortex in subjects with amblyopia. Neural Plast. 2013;2013:612086. doi:10.1155/2013/612086
34. McKee JL, Riesenhuber M, Miller EK, Freedman DJ. Task dependence of visual and category representations in prefrontal and inferior temporal cortices. J Neurosci. 2014;34(48):16065–16075. doi:10.1523/JNEUROSCI.1660-14.2014
35. Eskandar EN, Optican LM, Richmond BJ. Role of inferior temporal neurons in visual memory. II. Multiplying temporal waveforms related to vision and memory. J Neurophysiol. 1992;68(4):1296–1306. doi:10.1152/jn.1992.68.4.1296
36. Verhoef BE, Vogels R, Janssen P. Inferotemporal cortex subserves three-dimensional structure categorization. Neuron. 2012;73(1):171–182. doi:10.1016/j.neuron.2011.10.031
37. Janssen P, Vogels R, Orban GA. Macaque inferior temporal neurons are selective for disparity-defined three-dimensional shapes. Proc Natl Acad Sci U S A. 1999;96(14):8217–8222. doi:10.1073/pnas.96.14.8217
38. Scheff SW, Price DA, Schmitt FA, Scheff MA, Mufson EJ. Synaptic loss in the inferior temporal gyrus in mild cognitive impairment and Alzheimer’s disease. J Alzheimers Dis. 2011;24(3):547–557. doi:10.3233/JAD-2011-101782
39. Yu C, Liu Y, Li J, et al. Altered functional connectivity of primary visual cortex in early blindness. Hum Brain Mapp. 2008;29(5):533–543. doi:10.1002/hbm.20420
40. Oshio R, Tanaka S, Sadato N, Sokabe M, Hanakawa T, Honda M. Differential effect of double-pulse TMS applied to dorsal premotor cortex and precuneus during internal operation of visuospatial information. Neuroimage. 2010;49(1):1108–1115. doi:10.1016/j.neuroimage.2009.07.034
41. Myung W, Na KS, Ham BJ, Oh SJ, Ahn HW, Jung HY. Decreased medial frontal gyrus in patients with adjustment disorder. J Affect Disorders. 2016;191:36–40. doi:10.1016/j.jad.2015.11.028
42. Lundstrom BN, Ingvar M, Petersson KM. The role of precuneus and left inferior frontal cortex during source memory episodic retrieval. Neuroimage. 2005;27(4):824–834. doi:10.1016/j.neuroimage.2005.05.008
43. Cavanna AE, Trimble MR. The precuneus: a review of its functional anatomy and behavioural correlates. Brain. 2006;129(Pt 3):564–583. doi:10.1093/brain/awl004
44. Hong LE, Tagamets M, Avila M, Wonodi I, Holcomb H, Thaker GK. Specific motion processing pathway deficit during eye tracking in schizophrenia: a performance-matched functional magnetic resonance imaging study. Biol Psychiatry. 2005;57(7):726–732. doi:10.1016/j.biopsych.2004.12.015
45. Frings L, Wagner K, Quiske A, et al. Precuneus is involved in allocentric spatial location encoding and recognition. Exp Brain Res. 2006;173(4):661–672. doi:10.1007/s00221-006-0408-8
46. Bigler ED, Mortensen S, Neeley ES, et al. Superior temporal gyrus, language function, and autism. Dev Neuropsychol. 2007;31(2):217–238. doi:10.1080/87565640701190841
47. Nourski KV, Brugge JF, Reale RA, et al. Coding of repetitive transients by auditory cortex on posterolateral superior temporal gyrus in humans: an intracranial electrophysiology study. J Neurophysiol. 2013;109(5):1283–1295. doi:10.1152/jn.00718.2012
48. Gharabaghi A, Fruhmann Berger M, Tatagiba M, Karnath HO. The role of the right superior temporal gyrus in visual search-insights from intraoperative electrical stimulation. Neuropsychologia. 2006;44(12):2578–2581. doi:10.1016/j.neuropsychologia.2006.04.006
49. Kasai K, Shenton ME, Salisbury DF, et al. Progressive decrease of left superior temporal gyrus gray matter volume in patients with first-episode schizophrenia. Am J Psychiatry. 2003;160(1):156–164. doi:10.1176/appi.ajp.160.1.156
50. Watson CT, Roussos P, Garg P, et al. Genome-wide DNA methylation profiling in the superior temporal gyrus reveals epigenetic signatures associated with Alzheimer’s disease. Genome Med. 2016;8(1):5. doi:10.1186/s13073-015-0258-8
51. Tan G, Dan ZR, Zhang Y, et al. Altered brain network centrality in patients with adult comitant exotropia strabismus: A resting-state fMRI study. J Int Med Res. 2018;46(1):392–402. doi:10.1177/0300060517715340
52. Huang X, Li HJ, Ye L, et al. Altered regional homogeneity in patients with unilateral acute open-globe injury: a resting-state functional MRI study. Neuropsych Dis Treat. 2016;12:1901–1906. doi:10.2147/NDT.S110541
53. Gu X, Hof PR, Friston KJ, Fan J. Anterior insular cortex and emotional awareness. J Comp Neurol. 2013;521(15):3371–3388. doi:10.1002/cne.23368
54. Seth AK, Suzuki K, Critchley HD. An interoceptive predictive coding model of conscious presence. Front Psychol. 2011;2:395.
55. Gasquoine PG. Contributions of the insula to cognition and emotion. Neuropsychol Rev. 2014;24(2):77–87. doi:10.1007/s11065-014-9246-9
56. Grecucci A, Giorgetta C, Bonini N, Sanfey AG. Reappraising social emotions: the role of inferior frontal gyrus, temporo-parietal junction and insula in interpersonal emotion regulation. Front Hum Neurosci. 2013;7:523. doi:10.3389/fnhum.2013.00523
57. Geuter S, Boll S, Eippert F, Buchel C. Functional dissociation of stimulus intensity encoding and predictive coding of pain in the insula. Elife. 2017;6. doi:10.7554/eLife.24770
 © 2019 The Author(s). This work is published and licensed by Dove Medical Press Limited. The full terms of this license are available at https://www.dovepress.com/terms.php and incorporate the Creative Commons Attribution - Non Commercial (unported, v3.0) License.
By accessing the work you hereby accept the Terms. Non-commercial uses of the work are permitted without any further permission from Dove Medical Press Limited, provided the work is properly attributed. For permission for commercial use of this work, please see paragraphs 4.2 and 5 of our Terms.
© 2019 The Author(s). This work is published and licensed by Dove Medical Press Limited. The full terms of this license are available at https://www.dovepress.com/terms.php and incorporate the Creative Commons Attribution - Non Commercial (unported, v3.0) License.
By accessing the work you hereby accept the Terms. Non-commercial uses of the work are permitted without any further permission from Dove Medical Press Limited, provided the work is properly attributed. For permission for commercial use of this work, please see paragraphs 4.2 and 5 of our Terms.