")
Back to Journals » Nature and Science of Sleep » Volume 14
Respiratory Motion and Airflow Estimation During Sleep Using Tracheal Movement and Sound
Authors Montazeri Ghahjaverestan N , Fan W, Aguiar C, Yu J, Bradley TD
Received 11 February 2022
Accepted for publication 7 June 2022
Published 1 July 2022 Volume 2022:14 Pages 1213—1223
DOI https://doi.org/10.2147/NSS.S360970
Checked for plagiarism Yes
Review by Single anonymous peer review
Peer reviewer comments 2
Editor who approved publication: Professor Ahmed BaHammam
Nasim Montazeri Ghahjaverestan,1,2 Wei Fan,3 Cristiano Aguiar,3 Jackson Yu,3 T Douglas Bradley1,3– 5
1Sleep Research Laboratory of the University Health Network Toronto Rehabilitation Institute, Toronto, Ontario, Canada; 2Institute of Biomedical Engineering, University of Toronto, Toronto, Ontario, Canada; 3Bresotec Inc., Toronto, Ontario, Canada; 4Department of Medicine of the University of Toronto, Toronto, Ontario, Canada; 5Department of Medicine of the University Health Network Toronto General Hospital, Toronto, Ontario, Canada
Correspondence: T Douglas Bradley, Department of Medicine of the University Health Network Toronto General Hospital, Room 9N-943, 200 Elizabeth Street, Toronto, Ontario, M5G 2C4, Canada, Tel +1 416-340-4719, Fax +1 416-340-4197, Email [email protected]
Purpose: Due to lack of access and high cost of polysomnography, portable sleep apnea testing has been developed to diagnose sleep apnea. Despite being less expensive, and having fewer sensors and reasonable accuracy in identifying sleep apnea, such devices can be less accurate than polysomnography in detecting apneas/hypopneas. To increase the accuracy of apnea/hypopnea detection, an accurate airflow estimation is required. However, current airflow measurement techniques employed in portable devices are inconvenient and subject to displacement during sleep. In this study, algorithms were developed to estimate respiratory motion and airflow using tracheo-sternal motion and tracheal sounds.
Patients and Methods: Adults referred for polysomnography were included. Simultaneous to polysomnography, a patch device with an embedded 3-dimensional accelerometer and microphone was affixed to the suprasternal notch to record tracheo-sternal motion and tracheal sounds, respectively. Tracheo-sternal motion was used to train two mathematical models for estimating changes in respiratory motion and airflow compared to simultaneously measured thoracoabdominal motion and nasal pressure from polysomnography. The amplitude of the estimated airflow was then adjusted by the tracheal sound envelope in segments with unstable breathing.
Results: Two hundred and fifty-two subjects participated in this study. Overall, the algorithms provided highly accurate estimates of changes in respiratory motion and airflow with mean square errors (MSE) of 3.58 ± 0.82% and 2.82 ± 0.71%, respectively, compared to polysomnographic signals. The estimated motion and airflow from the patch signals detected apneas and hypopneas scored on polysomnography in 63.9% and 88.3% of cases, respectively.
Conclusion: This study presents algorithms to accurately estimate changes in respiratory motion and airflow, which provides the ability to detect respiratory events during sleep. Our study suggests that such a simple and convenient method could be used for portable monitoring to detect sleep apnea. Further studies will be required to test this possibility.
Keywords: respiratory airflow, sleep apnea, tracheal acoustics
Introduction
Sleep apnea (SA) is characterized by intermittent reductions (hypopneas) or cessations (apneas) in airflow during sleep. Sleep apnea occurs due to partial or complete collapse of the upper airway (UA) (obstructive sleep apnea, OSA) or reduction or cessation in central neural stimulation of inspiratory muscles (central sleep apnea, CSA) during sleep. While SA is present in approximately 10% of the adult population,1 it is more prevalent in individuals with certain medical conditions such as heart failure (47–81%2), hypertension (73–82%3,4), and stroke (71%5). Attended overnight polysomnography (PSG) in a sleep laboratory is the standard method to diagnose sleep apnea, but is inconvenient owing to its high expense and relative inaccessibility in many areas.6 This helps to explain why approximately 85% of the people with sleep apnea remain undiagnosed.7
To overcome the challenges of SA diagnosis, portable sleep apnea testing has been developed. Such testing devices have fewer sensors and are less expensive compared to PSG, while not requiring an overnight stay in a sleep laboratory. Despite having reasonable accuracy in identifying subjects with SA,8 such devices can be less accurate in detecting apneas and hypopneas. To increase the accuracy of apnea/hypopnea detection, accurate estimation of respiratory signals is required.
Current portable devices generally use nasal pressure cannulae for measuring airflow and/or respiratory inductance plethysmography (RIP) for measuring respiratory motion. However, nasal cannulae only measures nasal airflow and will not detect airflow when subjects are mouth breathing.9 In unattended sleep monitoring at home, nasal cannulae and RIP bands can be displaced during the night so that signals may either be inconsistent or lost.
Alternative means of measuring airflow and respiratory motion are via recording of tracheal motion and breath sounds by a 3-dimensional accelerometer and a microphone, respectively.10–16 Such tracheal signals have been used in prototype portable devices to detect SA. Furthermore, tracheal breath sounds have been assessed to estimate airflow; however, such assessments were performed during wakefulness under carefully controlled conditions10,11,13,15,16 or during brief segments of sleep.10,17 A few studies also suggested the possibility that a combination of tracheal sounds and motion could be used to estimate airflow during overnight sleep studies.12
Accordingly, in the present study, we employed a module, the patch, into which is embedded a 3-dimensional accelerometer and a microphone, that is affixed to the skin over the suprasternal notch and upper sternum for recording the craniocaudal motion of the trachea and posterior-anterior motion of the sternum, as well as tracheal breath sounds. The objective of the study was to develop algorithms to estimate respiratory motion and airflow using tracheo-sternal motion and tracheal sounds compared to simultaneously recorded reference signals from overnight PSG. This work has not been published elsewhere except as an abstract accepted for the American Thoracic Society Congress 2022.
Materials and Methods
Study Participants
Eligibility criteria were men and women aged 18 years and above referred to the University Health Network sleep laboratories for overnight PSG. Exclusion criteria were in-hospital patients, those who self-reported neuromuscular disorders, obesity hypoventilation, severe lung diseases such as chronic obstructive pulmonary disease, and subjects who were not fluent in English. The study was approved by the Research Ethics Board of the University Health Network (IRB #: 17-6258 and 19-5601). All participants provided written informed consent prior to participation. Our study was conducted in accordance with the Declaration of Helsinki.
Data Acquisition
Subjects underwent in-laboratory overnight PSG using a computerized system (Embla® N7000/S4500, Natus Medical Incorporated) and standard techniques and scoring criteria for sleep stages and arousals from sleep.18 Airflow was assessed by a nasal cannula, thoracoabdominal movements by RIP, and arterial oxyhemoglobin saturation (SaO2) by a pulse oximeter. Apneas and hypopneas were scored according to the American Academy of Sleep Medicine (AASM) guidelines version 2.6.21 Apnea was characterized by ≥90% reduction in the peak excursion of airflow signal lasting ≥10 seconds. Hypopnea was scored as a reduction in airflow by between 30% and 90% accompanied by ≥3% oxygen desaturation or ending with cortical arousal.
Following instrumentation for PSG, a module into which a 3-dimensional accelerometer and a microphone were embedded, the patch (BresoDX1, BresoTEC Inc., Toronto, Canada), was affixed over the suprasternal notch and upper sternum by adhesive tape (Figure 1) to record tracheo-sternal motion and tracheal sound. Prior to lights out, patch signals were recorded during wakefulness while subjects breathed normally for 5 minutes to establish a baseline level against which tracheo-sternal signals could be normalized after lights out during normal breathing, hypopneas and apneas. Motion and sound signals were recorded at 100 Hz and 8000 Hz, respectively. These signals were transmitted wirelessly from the patch module to a data collection unit placed on the subject’s night table. Signals were synchronized to the PSG recording via electronic pulses generated every 10 minutes.
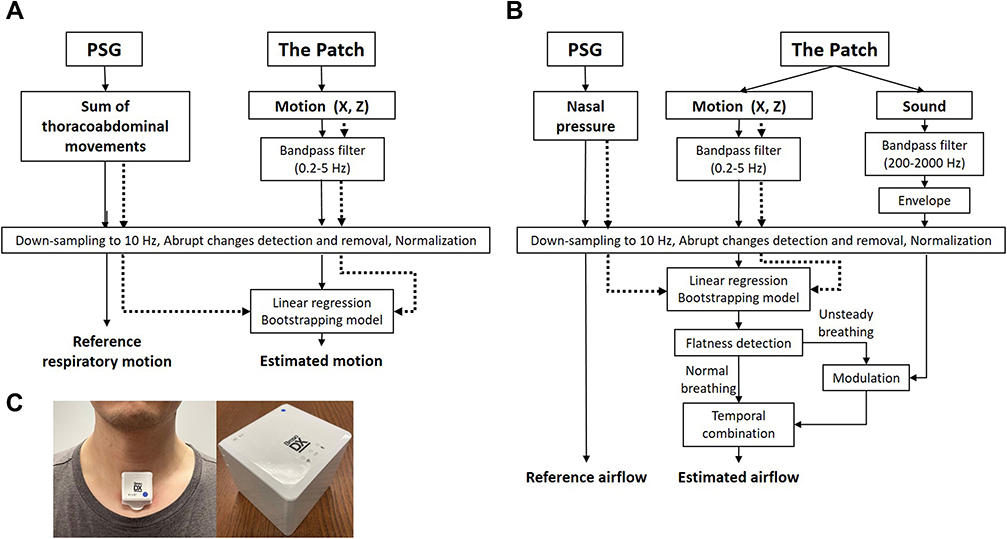 |
Figure 1 An overview of data analysis. (A) Respiratory motion estimation. (B) Airflow estimation. Dashed arrows indicate the stream of training set. (C) The Patch is attached over the suprasternal notch and its data collection unit (hub) is placed on a bed-side table. |
Data Analysis
Data Preprocessing
Following completion of overnight studies, data were downloaded from the collection unit to a computer and analyzed using Python software. Data were divided into five-minute segments to appropriately use the computing capacity. Figure 1 illustrates an overview of the data analysis.
For each segment of data, craniocaudal (X-axis) and posterior-anterior (Z-axis) motion from the accelerometer and sound signals from the microphone were extracted. To ensure tracheal motion signals were related to breathing in the frequency range from 0.2 to 0.33 Hz,19 accelerometer signals were filtered using a five-order zero-phase bandpass Butterworth filter with a bandwidth of 0.2 to 5 Hz. Then, the filtered accelerometer signals were down-sampled to 10 Hz and deemed movement signals. We found 10 Hz sufficient to preserve the clear waveform of breathing. At this stage, each movement signal consisted of the breathing-related movements, which were superimposed on a baseline level which could rise or fall abruptly with changes in body position during sleep. Such shifts in the baseline were detected using the Pruned Exact Linear Time (PELT) technique.20 The PELT algorithm used the root mean squared error as the cost function to optimally partition each movement signal into segments with different baselines. Each segment between two consecutive shifts in the signal baseline was normalized between its 2nd and 98th percentiles. The normalization unified the amplitude range of the movement signals and equalized the baseline at the zero level during different body postures. Subsequently, the normalized segments were temporally combined to generate the normalized movement signals (MX and MZ) in X and Z axes with unified range and zero-level baseline.
The sound signal was bandpass filtered using a nine-order zero-phase Butterworth filter (200–2000 Hz). This bandwidth preserved the breathing components while eliminating high-frequency noises (>2000 Hz21), and diminishing heart sounds (20–500Hz21) and snoring sounds (20–1500 Hz22). To remove the remaining spectral content of heart sounds and snoring, the filtered sound was resampled at 10 Hz. The envelope of the resampled sound signal was extracted for each sample by finding the maximum value within a neighborhood of 10 seconds. The 10-second window ensured capturing the oscillation related to breathing with 0.2–5 second period. Subsequently, the logarithm of the extracted envelope (SE) was normalized based on the 5th and 95th percentile to remove spikes related to noise disturbances.
From the synchronized segment of PSG data, the corresponding electronic sum of thoracoabdominal movements (respiratory motion) and nasal pressure (airflow) were extracted and resampled at 10 Hz. Then, they were analyzed to find and remove shifts in their baseline, and then normalized based on 2nd and 98th percentiles. The processed respiratory motion (Rm) and airflow (RF) from PSG were used as the reference signals in developing mathematical models.
Using the preprocessed signals, two mathematical models were developed for estimating respiratory motion and airflow. To develop the models, the dataset was divided into a training set (144 or 57% of subjects) and a test set (109 or 43% of subjects). The models were developed using the data in the training set. Then, the performance of the trained models were evaluated on the test set.
Respiratory Motion Estimation
To develop a model for estimating respiratory motion, a linear regression model was trained using MX and MZ from the patch (predictors) and their corresponding Rm (reference) from PSG, all of which were extracted from the training set. As there can be a few seconds misalignment between the patch and PSG due to drifts in the sampling rate of the device during data transmission, first, the predictors were temporally aligned with the reference. The length of the shift in time was determined by maximizing the cross-correlation, which was calculated iteratively for every second shift within a neighborhood of 5 seconds. This range limits the shift to be within the time frame of one typical breath cycle. Moreover, to suppress the effect of outliers presumably caused by motion artifacts, values 3 standard deviations away from the mean value of the signals were capped to the 3 standard deviations in the training process. Then, using Rm (reference) and the aligned MX and MZ (predictors), the parameters of the linear regression model were derived. Since MX and MZ are highly correlated, a ridge-regression model was used to solve the collinearity issue.23,24 Moreover, bootstrapping was employed to cope with the large number of samples in the overnight data.25 Based on this technique, 15 models were trained using the data of 30 subjects randomly selected for each model from the training set. As occurrence of respiratory events affects the amplitude of signals and, thus, the training process, subjects were divided into four groups of healthy subjects (AHI <5) and those with mild (AHI of 5 to <15), moderate (AHI of 15 to <30), and severe sleep apnea (AHI of ≥30). For each round of the bootstrapping model training, the same number of subjects was selected from each of the AHI severity groups, and aggregated to form the training set for that bootstrapping model.
To evaluate the performance of the model derived from the training set, MX and MZ of each data in the test set were fed into the trained bootstrapping models. The average value over the outputs of the models was reported as the estimated motion for each sample and compared to the reference motion (Rm) extracted from PSG.
Respiratory Airflow Estimation
A similar algorithm was implemented to develop linear regression models through Bootstrapping between airflow extracted from PSG (RF; reference) and MX and MZ from the Patch (predictors) in the training set. Then, using the trained models, airflow was estimated for any segment of MX and MZ from the test set.
As the sound envelope (SE) was related to the airflow amplitude, it was then used for modulating the amplitude of the estimated airflow in the test set. The modulation was performed only in segments where breathing was unstable (e.g., during apneas and hypopneas). These segments were marked as if 1 - the envelope of the estimated airflow was not flat, or 2 - its dominant frequency was out of the range of 0.17–0.33 Hz. This range of frequency was selected based on the normal rate of breathing.19 The flatness of the envelope of the estimated airflow was defined as the ratio of geometric over arithmetic mean values.
Statistical Analysis
Statistical analyses were performed in R (i386 3.4.1) software. The demographic characteristics of the participants in the training and test sets were compared using unpaired t-test except for sex, which was analyzed by Chi-square test.
To assess the performance of the algorithms derived from the training set on the test set, mean squared error (MSE) was calculated as the average value of the squared distance between the reference and estimated signals over the time intervals. The lower the MSE, the stronger the agreement between the reference and estimated signals. The values of MSE were reported for segments during normal breathing during wakefulness and sleep, as well as apneas, and hypopneas. Additionally, repeated measure correlation was used to assess the agreement between the estimated and reference signals from the subjects in the test set.26,27 Repeated measure correlation is a statistical technique to relax the independence assumption of the convectional Pearson correlation allowing one to analyze multiple measurements from each of the subjects and estimate a common regression value, which reflected the shared agreement among subjects. We reported the repeated measurement correlation for apneas, hypopneas, and normal breathing during sleep and wakefulness, separately. For each one, the related segments were extracted from the overnight data of each of the subjects in the test set and, then, aggregated for the repeated measure analysis. Moreover, the average of the estimated signals during each of the PSG-annotated events was compared to that of its preceding baseline segment to verify any reduction in the estimated level. Events were marked as detected if there was a 30% or greater reduction in estimated motion or airflow for at least 10s, and were sub-classified into apneas and hypopneas if the reductions were ≥90% or from 30 - <90%, respectively. The number of detected reductions were reported as the percentage of the detected apneas and hypopneas for the four AHI severity groups in the test set.
Furthermore, for each of the annotated respiratory events on the test set, the maximum level of the estimated signals in a 5-second window right before its onset (baseline level) and the minimum level within the event (event level) were extracted. Then, the extracted baseline and event levels for each subject in the test set were normalized to the level of the 5 minute period of normal breathing in the supine position during wakefulness prior to lights out. The average values of the normalized baseline and event levels were separately extracted for apneas and hypopneas, and compared using repeated measure one-way analysis of variance (ANOVA). If any significant difference was found, Tukey’s test was performed to analyze inter-group differences. Statistical significance was assumed as p ≤ 0.05.
Results
Study Participants
Two-hundred and fifty two subjects participated in this study. Table 1 displays their characteristics. There were no significant differences in these variables between the training and test groups except that total recording time was longer in the training set (p < 0.001). There were borderline significant differences between training and test sets in BMI (p = 0.05) and sex (p = 0.05). The following results were obtained using the test set.
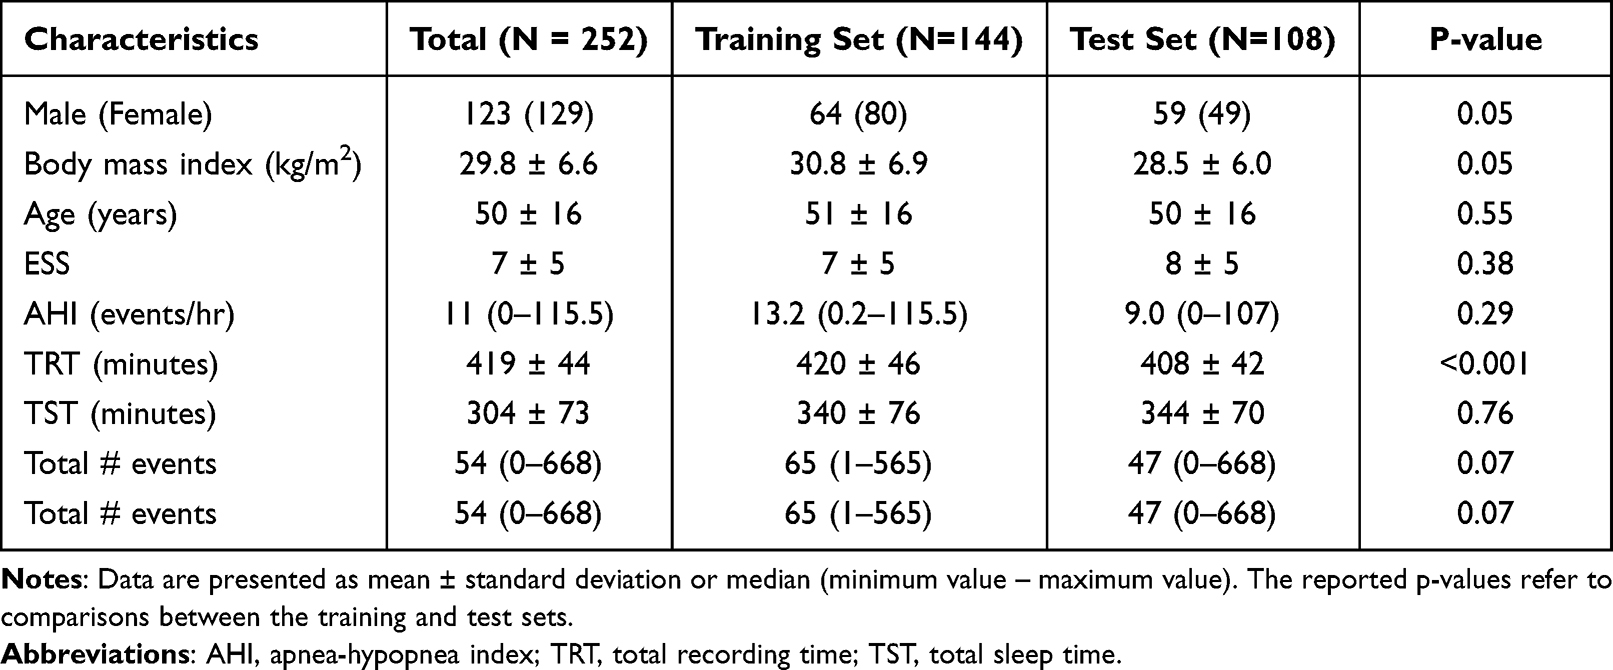 |
Table 1 Characteristics of the Participants |
Respiratory Motion and Airflow Estimation from the Test Set
Figure 2 illustrates a segment of data recorded from a subject in the test set with severe sleep apnea (AHI = 60), and the related estimated respiratory motion and airflow signals during intermittent apneas. Figure 3 demonstrates the MSE and repeated measure correlation value calculated for the estimated respiratory motion (Figure 3A and B) and airflow (Figure 3C and B). The MSE of normal breathing was significantly lower during sleep than during wakefulness. Moreover, the MSE was significantly lower during respiratory events compared to normal breathing during sleep (adjusted-p < 0.001 for all comparisons). A marginally significant reduction in the MSE was found in segments related to apneas compared to hypopneas in the estimated motion signal (1.66 ± 1.46% vs 2.12 ± 0.87%, p = 0.05). For the estimated airflow, the MSE was significantly lower in apneas than hypopneas (0.9 ± 0.81% vs 1.44 ± 0.70%, p < 0.001). Including all conditions, the algorithms estimated airflow and motion with an MSE of 2.82 ± 0.71% and 3.58 ± 0.82%, respectively, in the test set. Significant repeated measure correlation values were obtained for motion and airflow during apnea (motion: r = 0.68, airflow: r = 0.65), hypopnea (motion: r = 0.79, airflow: r = 0.73) and normal breathing during sleep (motion: r = 0.87, airflow: r = 0.83) and wakefulness (motion: r = 0.55, airflow: r = 0.53).
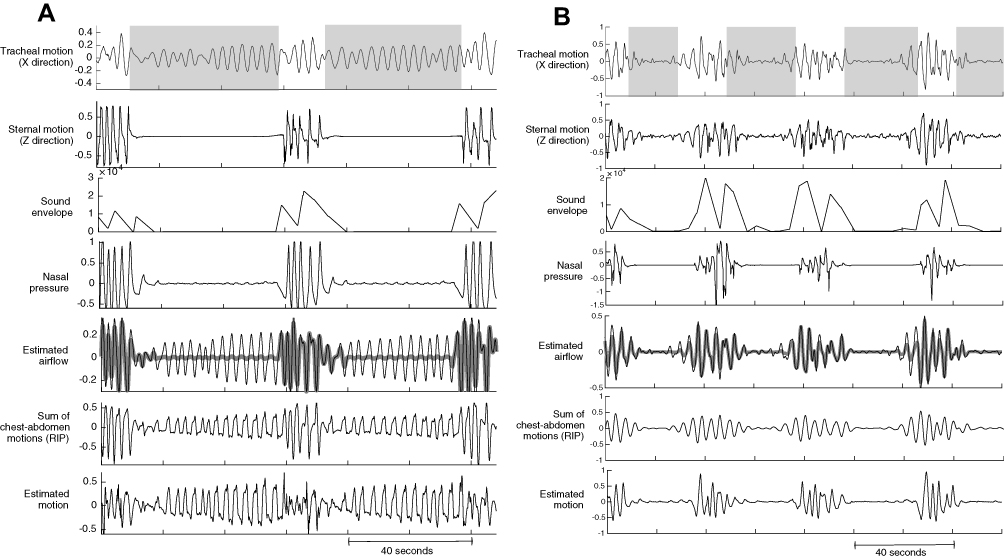 |
Figure 2 Representative traces of the predictors extracted from the tracheal signals and the estimated motion and airflow in comparison to the reference signals extracted from the PSG during segments with intermittent (A) obstructive and (B) central apneas. The shaded regions highlight the occurrence of apneas. In the estimated airflow panel, the thin black and thick grey lines demonstrate the estimated airflow with and without modulation by the sound envelope, respectively. |
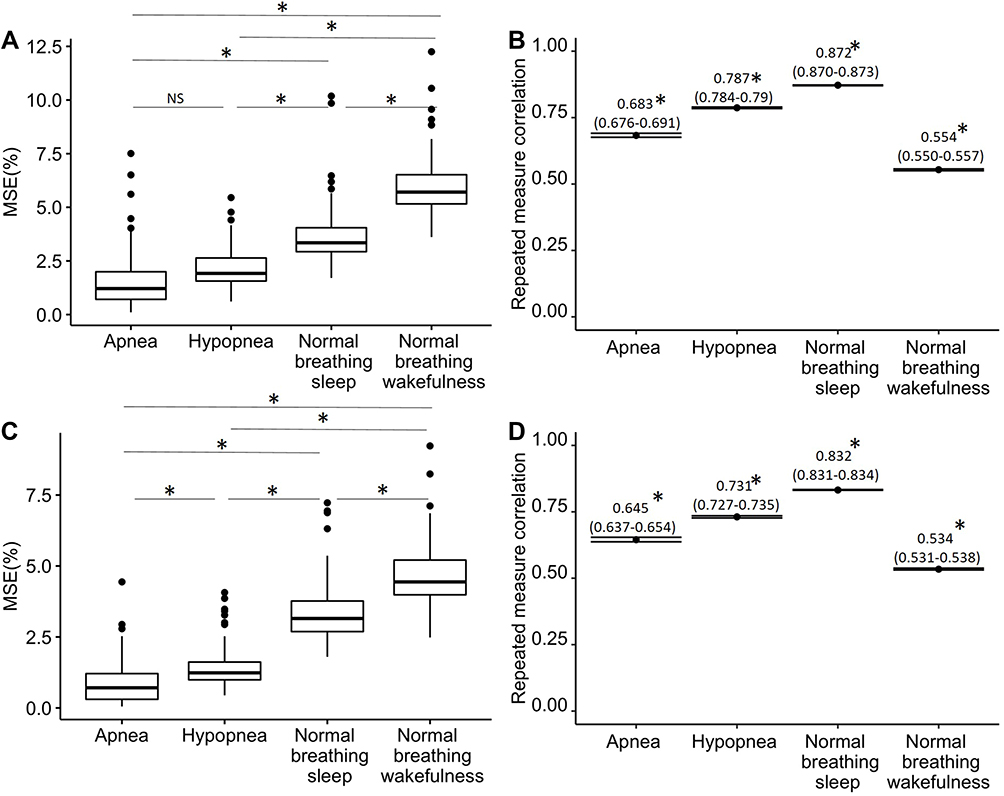 |
Figure 3 The average value of mean squared error (MSE,%) and the repeated measure correlation with related confidence interval calculated for the subjects in the test set to compare the estimated motion (A and B) and airflow (C and D) signals to the related reference signals during apneas, hypopneas and normal breathing during sleep and wakefulness. *p ≤ 0.001. Abbreviation: NS, not significant. |
As marginally significant differences in BMI and sex were detected between training and test sets, the MSE is reported in Figure 4 for subjects divided according to BMI and sex groups. No significant differences in MSE were observed between overweight (BMI ≥25) and non-overweight subjects (BMI <25) and between males and females in the estimated motion and airflow.
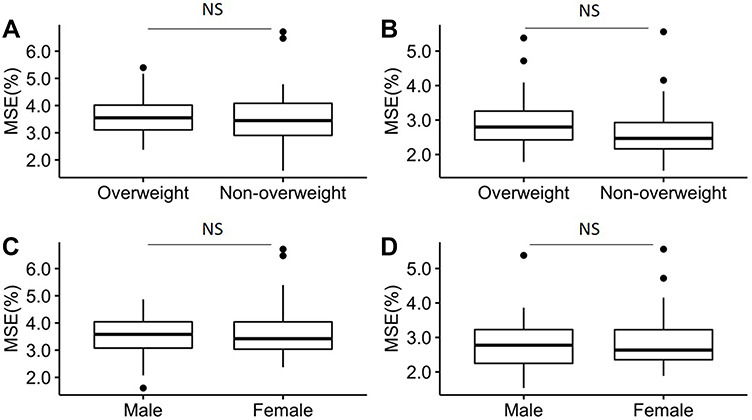 |
Figure 4 The average value of mean squared error (MSE,%) between estimated and reference motion (A and C) and airflow (B and D) signals calculated for subjects in the test set for different sex and body mass index (BMI) (Overweight: BMI ≥25, Non-overweight: BMI <25) categories, respectively. Abbreviation: NS, not significant. |
Table 2 presents the percentage of correctly detected PSG scored total apneas and hypopneas by the estimated patch motion and airflow signals. Finally, Figure 5 compares the average normalized changes in levels of the estimated motion (Figure 5A) and airflow (Figure 5B) during normal breathing right before the onset of hypopneas, and apneas. There were significant reductions in the level from normal breathing to hypopnea (p < 0.001) and apnea (p < 0.001) in the estimated motion and airflow signals. The levels during hypopneas and apneas were significantly different in the estimated motion (0.51 ± 0.12 vs 0.37 ± 0.19, p < 0.001), and in the estimated airflow (0.26 ± 0.13 vs 0.13 ± 0.13, p < 0.001). Figure 5C demonstrates significantly lower levels of estimated motion for central compared to obstructive events.
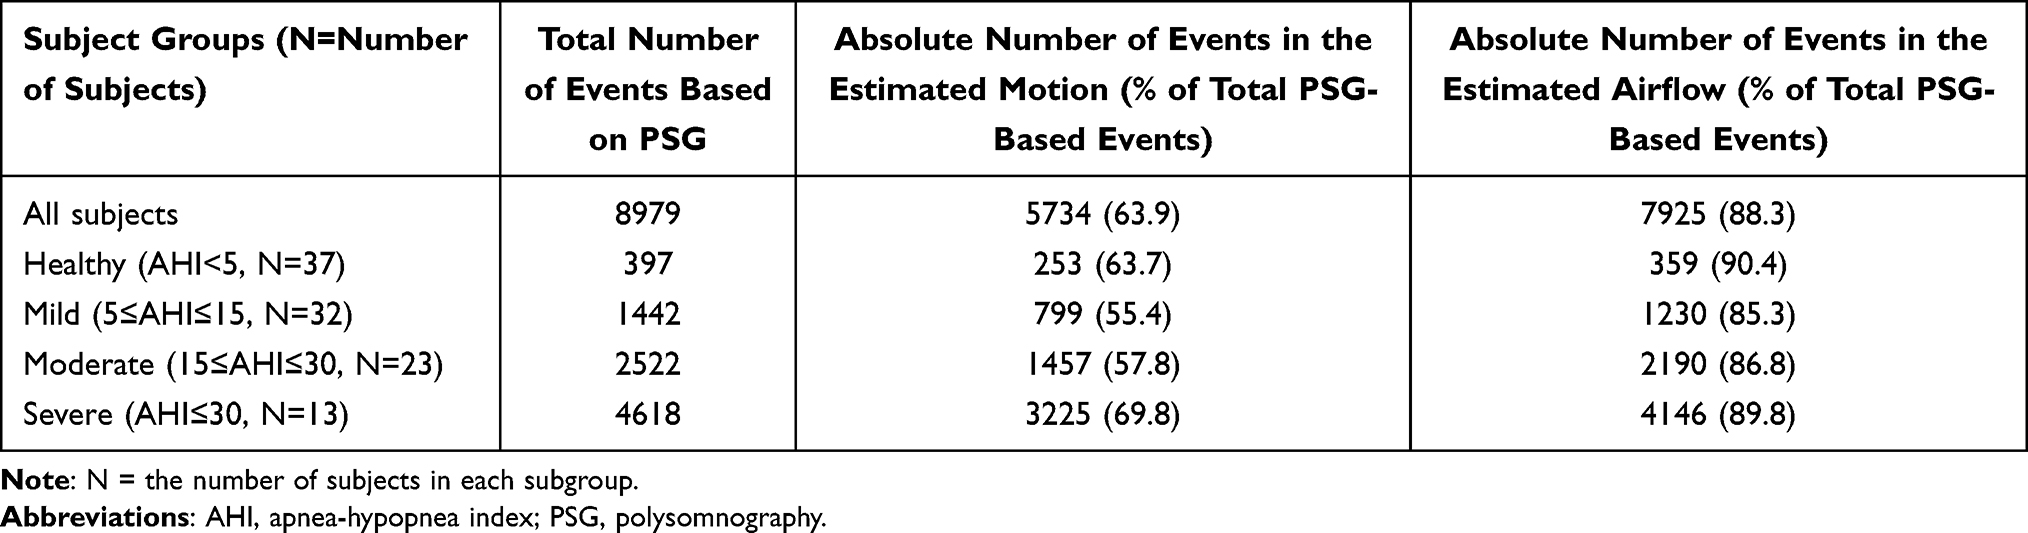 |
Table 2 The Absolute Number of Events (Apneas and Hypopneas) Scored on PSG According to AASM-Recommended Reductions in Airflow, and the Number of Events Identified by the Patch from Estimated Motion and Airflow |
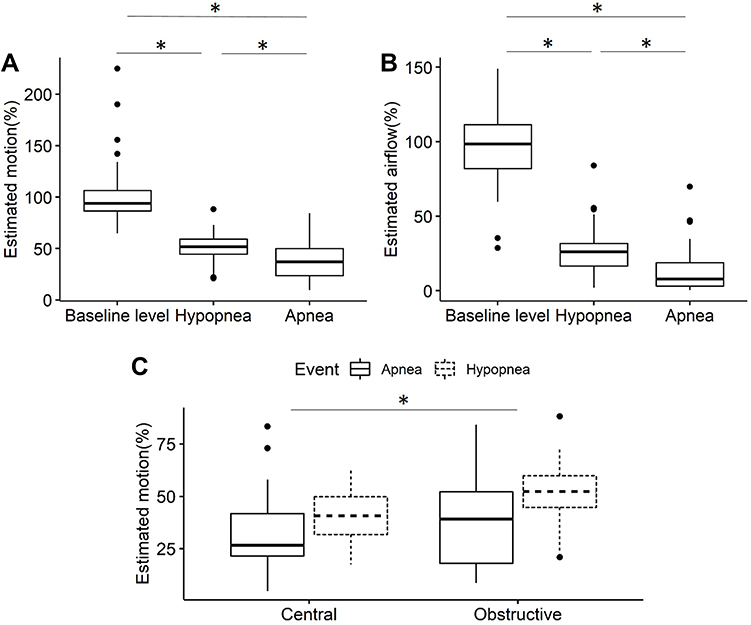 |
Figure 5 The average level of the estimated motion (A) and airflow (B) at baseline right before the onset of the events, and during hypopneas and apneas normalized as a percentage of the average value during a 5-minute period of normal breathing during wakefulness in the supine position prior to lights out. (C) For both apneas and hypopneas, there is a greater reduction in the average normalized level of estimated motion for central than for obstructive events. *Significant with p-value ≤0.001. |
Discussion
In this study, we tested two algorithms to estimate respiratory airflow from recordings of tracheo-sternal motion and tracheal breath sounds during simultaneous PSG. The major findings are that: 1) models developed from these signals provided accurate estimates of changes in respiratory motion and airflow compared to simultaneous PSG signals with an average MSE of <5% for the test set, 2) the models of motion and airflow reliably detected reductions in airflow during apneas and hypopneas compared to PSG in the test set, and 3) estimated motion and airflow from tracheo-sternal signals from the test set detected events in 63.9% and 88.3% of the airflow-based respiratory events from PSGs, respectively.
Unlike previous studies that estimated airflow from tracheal sound, we used a composite of tracheo-sternal motion and sound for this purpose. Airflow estimation using sound energy is challenging; first due to the difference between the polarity of airflow amplitude and sound energy in the respiratory phases. The amplitude of airflow is negative and positive during inspiration and expiration, respectively, while sound energy always has a positive amplitude. Therefore, the first step to estimate airflow using tracheal sound is to identify respiratory phases.28 Hence, in segments with misidentified respiratory phases the accuracy of airflow estimation is compromised. Second, sound is affected by the presence of snoring, which is associated with an abrupt elevation in the level and change in the shape of the sound energy. Even when snoring is filtered out, the remaining shape of sound energy can be distorted, and only the rate of airflow rather than its shape can be estimated from overnight PSG data.12 Additionally, there are other challenges related to the variability of the airflow-sound relationship for each individual12,17 and the effects of background noise,29 head and body position,30 sleep stages,17 and airflow rate.10 Therefore, previous work was limited to estimating airflow shape either during wakefulness or brief segments of sleep.10,11,13,15–17
In contrast, the patch accelerometer detected craniocaudal motion of the trachea and anterior-posterior respiratory motion of the sternum that are less affected by snoring and, similar to airflow signals, their polarity changes in accordance with respiratory phases. Consequently, we found that tracheo-sternal motion measured by the patch provided a better estimate of airflow than tracheal sounds alone. Nevertheless, we found that the accuracy of airflow estimates improved when the amplitude of the estimated airflow from tracheo-sternal motion was adjusted by the envelope of the tracheal sounds in segments with unstable breathing. Such improvement in the accuracy was presumably related to the well-established relationship between airflow and sound energy.17 Furthermore, to remove the effect of sleep stages and body posture, we used PELT, which can detect the changes in the signal dynamic with time instant resolution. By employing the PELT technique and modulating the estimated airflow by the sound envelope, the amplitude of the estimated airflow was shown to be significantly lower during respiratory events (Figure 5).
In another study, a different approach was used in which a linear regression model was trained using tracheal motion and sound energy to estimate the range of the sum of thoracoabdominal motion.12 The estimated range of movements was an index with values between 0 (for apnea) to 1 (for normal breathing). In contrast, in this study, the motion estimation model was trained using the sum of movements to capture the rising and falling patterns related to inspirations and expirations. This approach effectively increased the agreement between the estimated and reference motion quantified by repeated measure correlation compared to the previous study,12 especially during hypopneas and normal breathing during sleep and wakefulness. The estimated motion demonstrated significant reductions in amplitude during respiratory events (Figure 5A).
Estimated motion was less sensitive at detecting respiratory events compared to the estimated airflow. This is presumably because most of the events were obstructive during which thoracoabdominal and tracheal movements continue during obstructed efforts. In some instances, this would have been misclassified as normal breathing. However, since tracheal breath sounds will diminish during obstructive events, it adds sensitivity to tracheal motion for detecting obstructive events. During central events, especially apneas, there is no or very little thoracoabdominal or tracheal motion. As a consequence, there is a greater reduction in tracheal motion during central than obstructive events as demonstrated in Figure 5C. Therefore, whereas estimated airflow can be used to detect respiratory events of all types, it might be possible to use estimated motion to differentiate central from obstructive events.
Figure 2 compares the estimated airflow and motion with nasal pressure and the sum of thoracoabdominal movements as reference signals from PSG. One interesting observation was that tracheo-sternal signals could sense and estimate airflow even at lower airflow rates where nasal pressure was not sensitive. This observation was previously reported12 and is verified by the present findings.
Despite the random selection of subjects for training and test sets, there were marginal differences in sex and BMI. However, they had no impact on development of the models since similar adjusted MSE values were obtained for sex and BMI subgroups. For example, overall, the algorithms provided highly accurate estimates of airflow and motion in the test set with MSEs of 2.82 ± 0.71% and 3.58 ± 0.82%, respectively.
This study has some limitations. First, snoring can interfere with the analysis of airflow assessed by tracheal sound. Because we did not identify and quantify snoring, we did not specifically filter it out. However, we used several strategies to mitigate any potential adverse effect of snoring on our model of airflow estimation. These included use of tracheo-sternal movements as our main signal, which are less sensitive to snoring than tracheal sounds, filtering of the tracheal sounds in a range that would at least partially filter out snoring, and applying tracheal sound modulation to tracheo-sternal motion only during unstable breathing. Second, we were not able to clearly distinguish central from obstructive respiratory events from estimated motion and airflow signals. However, the observation that tracheo-sternal motion was lower during central than obstructive events suggests that algorithms can be developed to distinguish central from obstructive respiratory events in our future work. Third, since our study was designed primarily to assess accuracy of tracheo-sternal motion and sound in estimating respiratory airflow, we did not use oximetry in this study. Addition of oximetry to the patch signals will likely improve respiratory event detection, which will be addressed in future studies.
Conclusion
To our knowledge, this is the first study to estimate respiratory motion and airflow from tracheo-sternal motion and sound recordings during complete overnight PSG. We demonstrated that use of such signals provides highly accurate and robust estimates of changes in airflow during wakefulness and sleep for both normal breathing, and for unstable breathing with apneas and hypopneas. Furthermore, our findings support the potential for tracheo-sternal motion and sound recordings to automatically detect respiratory events during sleep and classify them as obstructive or central. If so, the patch device could provide a novel, accurate, simple and easy-to-use means of portable sleep apnea testing. Finally, the patch provides excellent visual representation of respiratory motion and airflow. Therefore, technicians and physicians could inspect these signals to increase the accuracy of event detection and assessment of sleep apnea severity beyond automatic scoring.
Abbreviations
SA, sleep apnea; UA, upper airway; OSA, obstructive sleep apnea; CSA, central sleep apnea; AHI, apnea/hypopnea index; PSG, polysomnography; BMI, body mass index; UHN, University Health Network; RIP, respiratory inductance plethysmography; SaO2, arterial oxyhemoglobin saturation; AASM, American Academy of Sleep Medicine; PELT, pruned exact linear time; MSE, mean square error; ANOVA, analysis of variance.
Disclosure
Dr. Nasim Montazeri Ghahjaverestan reports personal fees from Bresotec Inc., during the conduct of the study. Dr. Cristiano Aguiar reports a Provisional patent pending to Bresotec Inc. Mr Jackson Yu reports a Provisional patent pending to Bresotec Inc. Dr. T. Douglas Bradley reports personal fees from Bresotec Inc., during the conduct of the study.
References
1. Young T, Peppard PE, Gottlieb DJ. Epidemiology of obstructive sleep apnea: a population health perspective. Am J Respir Crit Care Med. 2002;165(9):1217–1239. doi:10.1164/rccm.2109080
2. Kasai T, Bradley TD. Obstructive sleep apnea and heart failure: pathophysiologic and therapeutic implications. J Am Coll Cardiol. 2011;57(2):119–127. doi:10.1016/j.jacc.2010.08.627
3. Muxfeldt ES, Margallo VS, Guimarães GM, Salles GF. Prevalence and associated factors of obstructive sleep apnea in patients with resistant hypertension. Am J Hypertens. 2014;27(8):1069–1078. doi:10.1093/ajh/hpu023
4. Martínez-García M, Capote F, Campos-Rodríguez F, et al. Effect of CPAP on blood pressure in patients with obstructive sleep apnea and resistant hypertension: the HIPARCO randomized clinical trial. JAMA. 2013;310(22):2407–2415. doi:10.1001/jama.2013.281250
5. Seiler A, Camilo M, Korostovtseva L, et al. Prevalence of sleep-disordered breathing after stroke and TIA: a meta-analysis. Neurology. 2019;92(7):e648–e654. doi:10.1212/WNL.0000000000006904
6. Pack AI. Sleep-disordered breathing: access is the issue. Am J Respir Crit Care Med. 2004;169(6):666–667. doi:10.1164/rccm.2401008
7. Kapur V, Strohl KP, Redline S, Iber C, O’connor G, Nieto J. Underdiagnosis of sleep apnea syndrome in US communities. Sleep Breath. 2002;6(02):49. doi:10.1055/s-2002-32318
8. Malhotra A, Ayappa I, Ayas N, et al. Metrics of sleep apnea severity: beyond the apnea-hypopnea index. Sleep. 2021;44(7):zsab030. doi:10.1093/sleep/zsab030
9. Dolfin T, Duffty P, Wilkes D, England S, Bryan H. Effects of a face mask and pneumotachograph on breathing in sleeping infants. Am Rev Respir Dis. 1983;128(6):977–979. doi:10.1164/arrd.1983.128.6.977
10. Yadollahi A, Moussavi ZM. A robust method for estimating respiratory flow using tracheal sounds entropy. IEEE Trans Biomed Eng. 2006;53(4):662–668. doi:10.1109/TBME.2006.870231
11. Sierra G, Telfort V, Popov B, Durand LG, Agarwal R, Lanzo V. Monitoring respiratory rate based on tracheal sounds. First Experiences. 2004;1:317–320.
12. Montazeri Ghahjaverestan N, Kabir MM, Saha S, et al. Relative tidal volume and respiratory airflow estimation using tracheal sound and movement during sleep. J Sleep Res. 2021;30(4):e13279. doi:10.1111/jsr.13279
13. Chen G, de la Cruz I, Rodriguez-Villegas E. Automatic lung tidal volumes estimation from tracheal sounds. Conf Proc IEEE Eng Med Biol Soc. 2014:1497–1500. doi:10.1109/EMBC.2014.6943885
14. Yap YL, Moussavi Z. Acoustic airflow estimation from tracheal sound power. Can Conf Electr Comput Eng. 2002;2:1073–1076.
15. Reljin N, Reyes BA, Chon KH. Tidal volume estimation using the blanket fractal dimension of the tracheal sounds acquired by smartphone. Sensors. 2015;15(5):9773–9790. doi:10.3390/s150509773
16. Ciftci K, Kahya YP. Respiratory airflow estimation by time varying autoregressive modeling. Ann Conf IEEE Eng Med Biol Soc. 2008;2008:347–350. doi:10.1109/IEMBS.2008.4649161
17. Yadollahi A, Montazeri A, Azarbarzin A, Moussavi Z. Respiratory flow–sound relationship during both wakefulness and sleep and its variation in relation to sleep apnea. Ann Biomed Eng. 2013;41(3):537–546. doi:10.1007/s10439-012-0692-3
18. Berry RB, Quan SF, Abreu AR, et al. The AASM Manual for the Scoring of Sleep and Associated Events: Rules, Terminology and Technical Specifications. American Academy of Sleep Medicine; 2020.
19. Fang Y, Jiang Z, Wang H. A novel sleep respiratory rate detection method for obstructive sleep apnea based on characteristic moment waveform. J Healthc Eng. 2018;2018:1–10. doi:10.1155/2018/1902176
20. Killick R, Fearnhead P, Eckley IA. Optimal detection of changepoints with a linear computational cost. J Am Stat Assoc. 2012;107(500):1590–1598. doi:10.1080/01621459.2012.737745
21. Reichert S, Gass R, Brandt C, Andrès E. Analysis of respiratory sounds: state of the art. Clin Med Circ Respir Pulm Med. 2008;2:S530. doi:10.4137/CCRPM.S530
22. Lee G, Lee L, Wang C, et al. The frequency and energy of snoring sounds are associated with common carotid artery intima-media thickness in obstructive sleep apnea patients. Sci Rep. 2016;6(1):1–11. doi:10.1038/s41598-016-0001-8
23. McDonald GC. Ridge regression. Wiley Interdiscip Rev Comput Stat. 2009;1(1):93–100. doi:10.1002/wics.14
24. Hoerl AE, Kennard RW. Ridge regression: applications to nonorthogonal problems. Technometrics. 1970;12(1):69–82. doi:10.1080/00401706.1970.10488635
25. Freedman DA. Bootstrapping regression models. Ann Stat. 1981;9(6):1218–1228. doi:10.1214/aos/1176345638
26. Shan G, Zhang H, Jiang T. Correlation coefficients for a study with repeated measures. Comput Math Methods Med. 2020;2020:1–11. doi:10.1155/2020/7398324
27. Bakdash JZ, Marusich LR. Repeated measures correlation. Front Psychol. 2017;8:456. doi:10.3389/fpsyg.2017.00456
28. Montazeri Ghahjaverestan N, Kabir M, Saha S, et al. Automatic respiratory phase identification using tracheal sounds and movements during sleep. Ann Biomed Eng. 2021;49(6):1521–1533. doi:10.1007/s10439-020-02651-5
29. Yadollahi A, Moussavi ZM. The effect of anthropometric variations on acoustical flow estimation: proposing a novel approach for flow estimation without the need for individual calibration. IEEE Trans Biomed Eng. 2011;58(6):1663–1670. doi:10.1109/TBME.2011.2109717
30. Pasterkamp H, Schäfer J, Wodicka GR. Posture-dependent change of tracheal sounds at standardized flows in patients with obstructive sleep apnea. Chest. 1996;110(6):1493–1498. doi:10.1378/chest.110.6.1493
 © 2022 The Author(s). This work is published and licensed by Dove Medical Press Limited. The full terms of this license are available at https://www.dovepress.com/terms.php and incorporate the Creative Commons Attribution - Non Commercial (unported, v3.0) License.
By accessing the work you hereby accept the Terms. Non-commercial uses of the work are permitted without any further permission from Dove Medical Press Limited, provided the work is properly attributed. For permission for commercial use of this work, please see paragraphs 4.2 and 5 of our Terms.
© 2022 The Author(s). This work is published and licensed by Dove Medical Press Limited. The full terms of this license are available at https://www.dovepress.com/terms.php and incorporate the Creative Commons Attribution - Non Commercial (unported, v3.0) License.
By accessing the work you hereby accept the Terms. Non-commercial uses of the work are permitted without any further permission from Dove Medical Press Limited, provided the work is properly attributed. For permission for commercial use of this work, please see paragraphs 4.2 and 5 of our Terms.