")
Back to Journals » International Journal of Chronic Obstructive Pulmonary Disease » Volume 10 » Issue 1
Respiratory infectious phenotypes in acute exacerbation of COPD: an aid to length of stay and COPD Assessment Test
Authors Dai M, Qiao J, Xu Y , Fei G
Received 10 July 2015
Accepted for publication 7 September 2015
Published 20 October 2015 Volume 2015:10(1) Pages 2257—2263
DOI https://doi.org/10.2147/COPD.S92160
Checked for plagiarism Yes
Review by Single anonymous peer review
Peer reviewer comments 3
Editor who approved publication: Dr Richard Russell
Meng-Yuan Dai,1 Jin-Ping Qiao,2 Yuan-Hong Xu,2 Guang-He Fei1
1Pulmonary Department, 2Department of Clinical Laboratory, First Affiliated Hospital of Anhui Medical University, Hefei, Anhui, People’s Republic of China
Purpose: To investigate the respiratory infectious phenotypes and their impact on length of stay (LOS) and the COPD Assessment Test (CAT) Scale in acute exacerbation of COPD (AECOPD).
Patients and methods: We categorized 81 eligible patients into bacterial infection, viral infection, coinfection, and non-infectious groups. The respiratory virus examination was determined by a liquid bead array xTAG Respiratory Virus Panel in pharyngeal swabs, while bacterial infection was studied by conventional sputum culture. LOS and CAT as well as demographic information were recorded.
Results: Viruses were detected in 38 subjects, bacteria in 17, and of these, seven had both. Influenza virus was the most frequently isolated virus, followed by enterovirus/rhinovirus, coronavirus, bocavirus, metapneumovirus, parainfluenza virus types 1, 2, 3, and 4, and respiratory syncytial virus. Bacteriologic analyses of sputum showed that Pseudomonas aeruginosa was the most common bacteria, followed by Acinetobacter baumannii, Klebsiella, Escherichia coli, and Streptococcus pneumoniae. The longest LOS and the highest CAT score were detected in coinfection group. CAT score was positively correlated with LOS.
Conclusion: Respiratory infection is a common causative agent of exacerbations in COPD. Respiratory coinfection is likely to be a determinant of more severe acute exacerbations with longer LOS. CAT score may be a predictor of longer LOS in AECOPD.
Keywords: COPD, acute exacerbation, respiratory infectious, phenotypes, LOS, CAT
Introduction
COPD has become a major cause of chronic morbidity and mortality throughout the world, and the economic and social burden are projected to increase in the coming decades.1 Hospitalization for acute exacerbation of COPD (AECOPD) is recognized as a major event in the natural history of COPD due to its adverse effect on lung function, survival, risk of readmission, and quality of life.2–6 It is generally believed that exacerbations are important targets for treatments and prevention of disease progression of COPD.7
Exploration of causative phenotypes of exacerbations would identify differences in population characteristics and clinical outcomes, which can lead to therapeutic consequences.8 Respiratory infection is recognized as an important trigger for AECOPD, and has also been shown to be associated with more severe disease. However, little is known about the spectrum of virus and bacteria of respiratory tract of AECOPD.
The prolonged length of stay (LOS) indicates more fragile patients who need more attention from healthy subjects.7 However, there is a lack of identified predictors of long LOS. Although previous studies suggest that there was a correlation of LOS with respiratory infection,9 the respiratory infectious phenotypes in LOS have not been explored in AECOPD. The COPD Assessment Test (CAT) with good internal consistency and test–retest reliability is suitable for routine clinical use for both stable and exacerbating COPD in recent years.10–13 However, there was no information about the correlation between CAT and respiratory infectious phenotypes as well as LOS.
Our current study, therefore, is to explore respiratory infectious phenotypes and their impact on LOS and the CAT scale during the exacerbations of COPD, which provides a better understanding of the disease and health-care planning.
Materials and methods
Study population
In all, 110 patients with clinician-diagnosed COPD exacerbation were screened according to the strategies illustrated in Figure 1 from January to June 2014 in our hospital. Among them, 81 eligible patients were enrolled. The AECOPD is defined as an acute event characterized by a worsening of respiratory symptoms (dyspnea, sputum purulence, or sputum volume) that is beyond normal day-to-day variations, and leads to a change in medication.7 Patients with an established history of COPD were recruited, with a post-bronchodilator forced expiratory volume in 1 second (FEV1) to forced vital capacity (FVC) ratio <70% at diagnosis. Standardized pulmonary function test was performed with a dry spirometer device (Erich Jaeger GmbH, Hoechberg, Germany) at 15 minutes after inhaling salbutamol 400 μg (Ventolin, GlaxoSmithKline, London, UK), and the FVC, FEV1, and FEV1/FVC ratio were recorded. In addition, the patients should be able to understand and complete the CAT independently. Exclusion criteria were as follows: patients with a primary diagnosis of asthma, bronchiectasis or other active chronic respiratory disease requiring treatments, interventions or diagnostics, or any other severe or uncontrolled co-morbidities; patients with mental disorders or any other condition associated with an immuno-inflammatory response; and patients who had received antibiotic or corticosteroids during the past 4 weeks. This study was approved by the ethical committee of Anhui Medical University, and written informed consent was obtained from all patients.
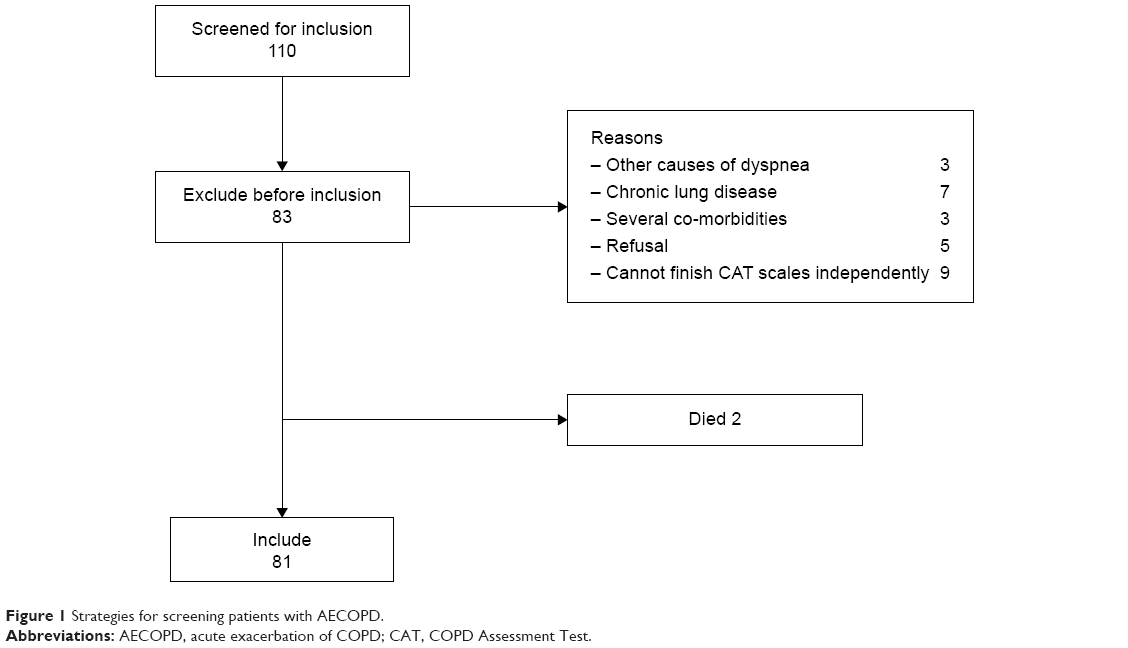 | Figure 1 Strategies for screening patients with AECOPD. |
Clinical parameters
Clinical characteristics of the patients were recorded, including demographic information, smoking history, Charlson’s index, the new Global initiative for chronic Obstructive Lung Disease (GOLD) staging system (grades A–D) using spirometry, exacerbation history, modified British Medical Research Council, and/or CAT results, long-term oxygen therapy, CAT scale, and LOS (Table 1). Co-morbidities included hypertension, diabetes mellitus, cerebral infarction, coronary artery disease, and these co-morbidities were in stable state which was confirmed by physicians from related departments. LOS was defined as the duration from admission to discharge from our hospital.7
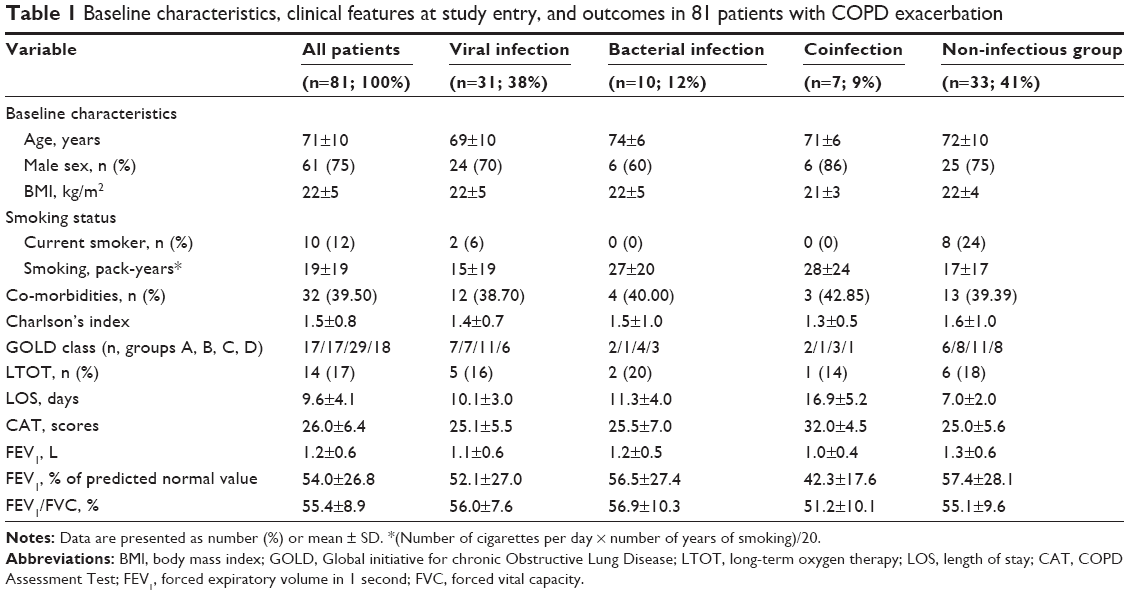 | Table 1 Baseline characteristics, clinical features at study entry, and outcomes in 81 patients with COPD exacerbation |
Microbiological analyses
Virological assays
During collecting samples, a pharyngeal swab was rotated five to six times and allowed to remain for 5 seconds.14 The swab was then immediately immersed in 3 mL viral preservation liquid (Youkang Technology Co., Beijing, People’s Republic of China) and stored at −80°C until examined. Total nucleic acids (DNA and RNA) were extracted and purified using mini kit (QIAamp MinElute Virus Spin Kit, Cat. No 57704, Hilden, Germany) and stored at −70°C until use. All pharyngeal swabs were analyzed consecutively for the presence of respiratory viruses upon arrival at the Department of Clinical Laboratory in the First Affiliated Hospital of Anhui Medical University. Analyses included influenza A (H1, H3, and H1N1), influenza B, respiratory syncytial virus, human metapneumovirus, parainfluenza virus types 1, 2, 3, and 4, coronaviruses (CoV OC43, CoV 229E, CoV NL-63, and HKU1), enterovirus/rhinovirus, adenovirus, and human bocavirus by a Respiratory Viral Panel FAST v2 kit which is based on the multiplex polymerase chain reaction (PCR), Flexible Multi-Analyte Profiling (xMAP), and xTAG techniques (Luminex, Toronto, Canada).
Bacteriological assays
Spontaneously, sputum was obtained in a sterile container prior to the initiation of AECOPD treatment and examined within 30 minutes. The bacterial analysis was performed at the Department of Clinical Laboratory in the First Affiliated Hospital of Anhui Medical University. The analyses consisted of bacterium culture, identification, and antibiotic susceptibility testing. Evaluation of bacterial content of the sample was done following the normal procedure. Gram-staining of sputum was evaluated by technicians and microbiologists. Secretions containing epithelium from the deeper parts of the airways by microscopic evaluation were considered sufficient materials. Bacteria in association with such epithelium were considered as being possible pathogens. Cultures of these diluted samples were made on blood agar and chocolate agar. The plates were incubated at 37°C in an incubator in the atmosphere of 10% CO2. After overnight incubation, the plates were studied by standard techniques and all pathogenic organisms were subjected to antibiotic sensitivity (Micro Scan Walk Away 96, West Sacramento, CA, USA).
Statistical analyses
Demographic and clinical characteristics of patients were summarized descriptively. Data were expressed as mean ± standard deviation. SPSS Statistics version 16.0 was used for statistical analysis. Group comparisons were tested using analysis of variance test or Chi-squared test. Pearson’s regression was used to analyze the correlation between CAT score and LOS. Groups were compared using analysis of variance. A P-value <0.05 was considered significant in all statistical analyses.
Results
Patient characteristics
From January to June 2014, a total of 110 patients were screened at admission to our study. In all, 81 patients were eligible, 29 patients were excluded, and two patients died from acute respiratory failure (Figure 1). We categorized those 81 patients into four groups (viral infection, bacterial infection, coinfection, and non-infectious groups) based on the pathogens isolated from respiratory tract specimens. Coinfection was defined as both viral and bacterial infection. There were no differences among the baseline characteristics in terms of sex distribution, age, body mass index, pack-years of smoking, current smoking status, Charlson’s index, and long-term oxygen therapy (Table 1).
Spectrum of respiratory virus and bacteria
Viral assays of the 81 pharyngeal swabs showed an overall positivity rate of 47% (n=38). Influenza virus was the most frequently detected virus (n=21), followed by enterovirus/rhinovirus (n=11), coronavirus (n=9), bocavirus (n=6), metapneumovirus (n=5), parainfluenza virus types 1, 2, 3, and 4 (n=3), and respiratory syncytial virus (n=3) (Figure 2). In addition, 12 patients were found with multiple viral infections.
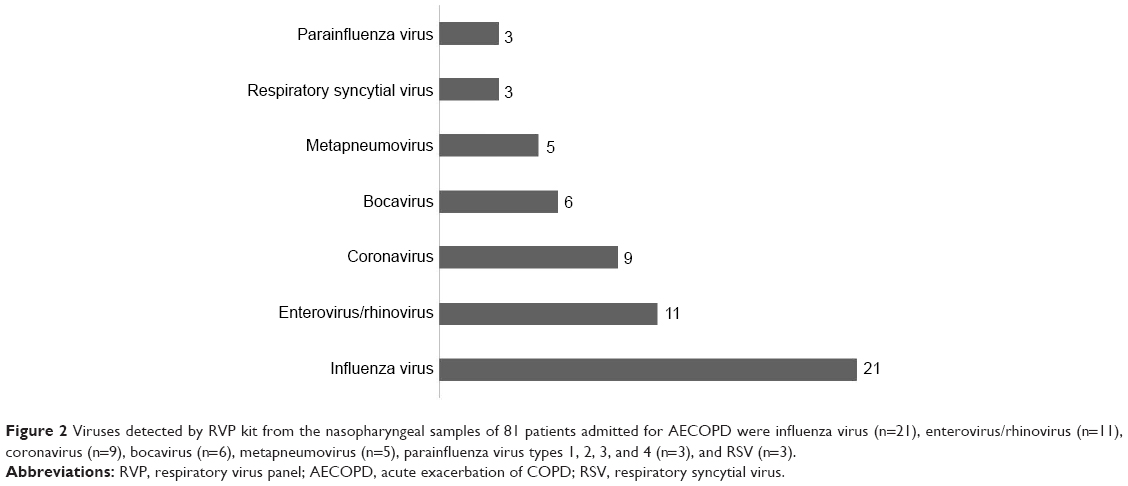 | Figure 2 Viruses detected by RVP kit from the nasopharyngeal samples of 81 patients admitted for AECOPD were influenza virus (n=21), enterovirus/rhinovirus (n=11), coronavirus (n=9), bocavirus (n=6), metapneumovirus (n=5), parainfluenza virus types 1, 2, 3, and 4 (n=3), and RSV (n=3). |
We found that 17 of 81 had a positive sputum culture for the following bacteria: Pseudomonas aeruginosa (n=6), Acinetobacter baumannii (n=5), Klebsiella (n=4), Escherichia coli (n=1), and Streptococcus pneumoniae (n=1). Ten patients with coinfection were found.
Relationships between the respiratory infectious phenotypes and LOS and CAT
Mean LOS was 9.6±4.1 days as a whole. Coinfection with virus and bacteria resulted in statistically significant longer LOS (coinfection 16.9±5.2 days vs bacterial 11.3±4.0 days [P=0.041], coinfection vs viral 10.1±3.0 days [P=0.000], coinfection vs non-infectious 7.0±2.0 days [P=0.004]). We found no significant difference in LOS between patients with virus and bacteria infection in AECOPD (viral vs bacterial, P>0.05). Consistently, LOS of non-infectious group was shorter than the other groups (Figure 3).
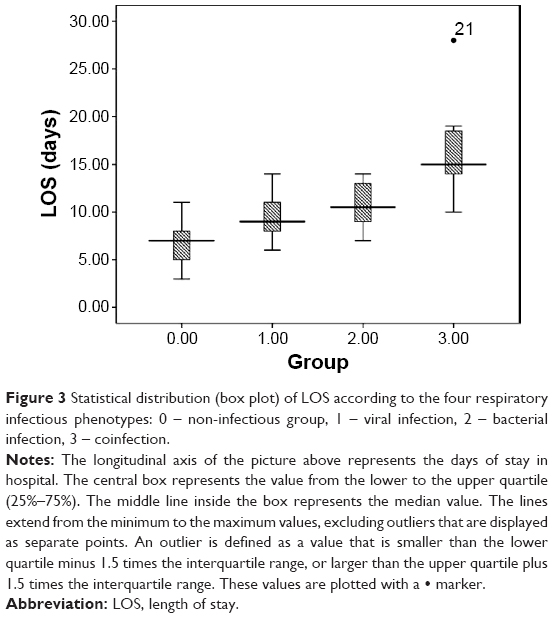 | Figure 3 Statistical distribution (box plot) of LOS according to the four respiratory infectious phenotypes: 0 – non-infectious group, 1 – viral infection, 2 – bacterial infection, 3 – coinfection. |
CAT scores are shown in Table 1. Coinfection with virus and bacteria resulted in a statistically significant increase in CAT score as compared with other groups (coinfection 32.0±4.5 vs bacterial 25.1±5.5 [P=0.019], coinfection vs viral 25.5±7.0 [P=0.009], coinfection vs non-infectious 25.0±5.6 [P=0.004]). We found no significant difference between patients with virus and bacteria infection in terms of CAT scores (Figure 4). Finally, we also found that CAT scores was positively correlated with LOS during AECOPD (r=0.372, P<0.001, Figure 5).
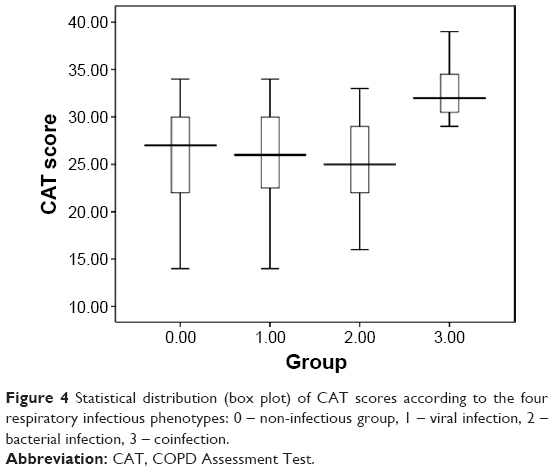 | Figure 4 Statistical distribution (box plot) of CAT scores according to the four respiratory infectious phenotypes: 0 – non-infectious group, 1 – viral infection, 2 – bacterial infection, 3 – coinfection. |
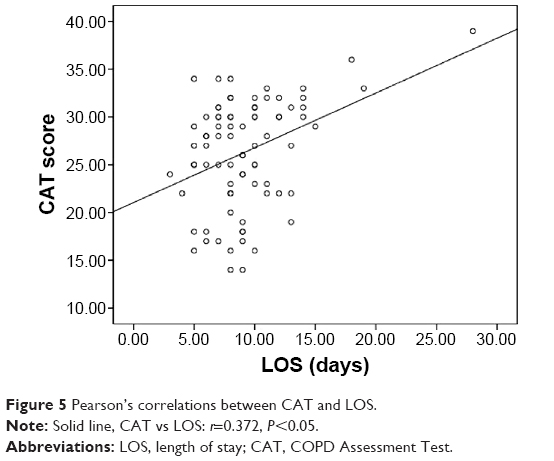 | Figure 5 Pearson’s correlations between CAT and LOS. |
Relationships between the respiratory infectious phenotypes and FEV1 and the new GOLD staging system
Data of FEV1 is shown in Table 1. We found no statistically significant difference in FEV1 among different infectious phenotypes (P>0.05). Moreover, there was no statistically significant difference in the classification of patients according to the new GOLD staging system among the four groups.
Discussion
AECOPD often facilitate the progressive course of COPD, mainly due to infection.14,15 Several studies have measured the burden of viral or bacterial infections in COPD exacerbation. However, little information is available about the respiratory infectious phenotypes as causative agent of exacerbations of COPD, and their relationships with LOS and CAT scale.
In the present study, 81 cases were examined. The results showed that 38 cases were viral infection, 17 were bacterial infection, and seven had both (Figure 2). Our detection rates of respiratory viruses were in line with recent reports, but two to three times higher than that using the conventional viral culture methods.16,17 The discrepancy could be explained by the use of Luminex multiplex PCR technique since this examining system allows the inclusion of new viruses such as human metapneumovirus and bocavirus in the more recent studies. Our study found that influenza virus is the most common virus associated with AECOPD, consistent with our results, a study from Hong Kong has shown influenza to be the most detected virus in exacerbations of COPD,18 which supports our results that influenza virus might be the most causative agent in the exacerbations of COPD in Asia. However, picornavirus was the most common one in studies from Western countries.16 This disparity in distribution of virus could be related to the geographical variation or different strains circulating at that particular year and time. Alternatively, the wider coverage of influenza vaccination in Western countries compared to Asia may also contribute to the difference of virus seen in the study.19,20 Interestingly, our study also detected five patients infected with human metapneumovirus and six patients with bocavirus in AECOPD for the first time, which provides a new insight into understanding of etiological agents in AECOPD. Further studies are needed to explore these less well-studied etiological pathogens for AECOPD. Potential bacterium was detected in 21% of acute exacerbation events, demonstrating the predominance of P. aeruginosa, A. baumannii, and Klebsiella.
Although we strictly followed the standard procedure to collect specimens, the detection rate with conventional examination method was relatively lower than modern culture-independent molecular approach, which could identify many unrecognized bacterial species in samples from COPD patients that may be clinically relevant.21 This bacterial spectrum was generally in agreement with those reported previously in People’s Republic of China.22 The difference with that of Western countries could be due to the regional disparity of bacterial infection.
The other main aim of this study was to evaluate the potential relationship between respiratory tract infectious phenotypes and LOS as well as the CAT scale. LOS has been widely used to measure the acute impact on patients with AECOPD.23 Our results showed the longest LOS for coinfection group and shortest LOS for the non-infectious group, which was consistent with previously reports.8,24 Wilkinson et al25 had demonstrated that exacerbation symptoms and FEV1 decline were more severe in the presence of bacteria and colds (as a surrogate of viral infection) than with a cold or bacterial pathogen alone. Exacerbations associated with human rhinovirus and Haemophilus influenzae coinfection exhibited a greater bacterial load and inflammation than those with no infection or viral or bacterial infection alone. These results showed that viral and bacterial coinfection would lead to a more severe symptom and longer LOS for patients to recover, which inversely increases chances of nosocomial infection, and also social and economic burden dramatically. Therefore, we may conclude that the different infectious phenotypes are closely associated with different LOS and health status in AECOPD patients. It is worth mentioning that some researches have found that cardiovascular events, pulmonary embolism, and blood stream infections may also contribute to the prolonged stay in patients with COPD.9,26 However, we did not check all of the relevant factors or diseases associated with prolonged stay in hospital which may have an impact on our results. We will take it into consideration in future study.
CAT is a recently introduced, patient-completed instrument to assess and quantify symptom and inflammation burden in patients of COPD. Therefore, we hypothesized that there may be a correlation between respiratory infectious phenotypes and CAT, which has not been explored yet. Since patients with coinfection exhibited a greater inflammation than those with single infection or non-infection, we infer that coinfection would lead to a higher CAT score, which was supported by our results. Furthermore, we also found that CAT was positively correlated with LOS, which makes CAT a useful tool to assess the impact of AECOPD symptoms on health status.
In our study, coinfection group has a lower FEV1 than the other three groups. There was, however, no statistically significant difference which was in agreement with some previous researches.27–29 Wark et al30 has demonstrated that there was no difference in acute FEV1 between those with and without virus infection. At review 6 weeks following their admission, those with virus infection had a greater decline in lung function compared with those without a virus having been isolated. How this occurs still need further investigation. Furthermore, a study investigating the relationship between potentially pathogenic bacteria isolation frequency and GOLD stages in AECOPD found no relationship between stage and bacteria isolation, which bear some resemblance to our research.28
Mortality is the most important parameter in predicting prognosis. Two patients infected with influenza virus died in our study. Researches had showed that influenza virus pandemic poses a potentially grave public health threat because of the high mortality rates observed in infected people.31 Therefore, whether respiratory influenza viral infection could be attributed to mortality of COPD exacerbations still needs further investigation.
Conclusion
Respiratory infectious phenotypes are associated with LOS and severity of symptoms in AECOPD. Furthermore, respiratory viral infection plays an important role in exacerbations of COPD. CAT may be a predictor of longer LOS with coinfection.
Acknowledgments
The authors would like to sincerely thank Jing Li, You-Hui Tu, Wen Chen, Rui Xu, Xian-Wei Hu, and Yong-Huai Li for the assistance with recruitment and clinical assessment of participants. This work was funded by the Natural Science Foundation of China (NSFC grant 81270081).
Author contributions
All authors participated in the conception and design of experiment. Meng-Yuan Dai carried out the experiment, drafted the manuscript, and performed the statistical analysis. Luminex multi-PCR and conventional sputum culture were carried out by Jin-Ping Qiao and Yuan-Hong Xu. The manuscript was revised coordination and critically by Guang-He Fei. All authors contributed toward data analysis, drafting and revising the paper and agree to be accountable for all aspects of the work. All authors read and approved the final manuscript.
Disclosure
The authors report no conflicts of interest in this work.
References
Lopez AD, Shibuya K, Rao C, et al. Chronic obstructive pulmonary disease: current burden and future projections. Eur Respir J. 2006;27(2):397–412. | ||
Seemungal TA, Donaldson GC, Paul EA, Bestall JC, Jeffries DJ, Wedzicha JA. Effect of exacerbation on quality of life in patients with chronic obstructive pulmonary disease. Am J Respir Crit Care Med. 1998;157(5 Pt 1):1418–1422. | ||
Connors AF Jr, Dawson NV, Thomas C, et al. Outcomes following acute exacerbation of severe chronic obstructive lung disease. The SUPPORT investigators (Study to Understand Prognoses and Preferences for Outcomes and Risks of Treatments). Am J Respir Crit Care Med. 1996;154(4 Pt 1):959–967. | ||
Donaldson GC, Seemungal TA, Bhowmik A, Wedzicha JA. Relationship between exacerbation frequency and lung function decline in chronic obstructive pulmonary disease. Thorax. 2002;57(10):847–852. | ||
Almagro P, Barreiro B, Ochoa de Echaguen A, et al. Risk factors for hospital readmission in patients with chronic obstructive pulmonary disease. Respir; Int Rev Thoracic Dis. 2006;73(3):311–317. | ||
Garcia-Aymerich J, Farrero E, Felez MA, et al. Risk factors of readmission to hospital for a COPD exacerbation: a prospective study. Thorax. 2003;58(2):100–105. | ||
Vestbo J, Hurd SS, Agusti AG, et al. Global strategy for the diagnosis, management, and prevention of chronic obstructive pulmonary disease: GOLD executive summary. Am J Respir Crit Care Med. 2013;187(4):347–365. | ||
MacDonald M, Korman T, King P, Hamza K, Bardin P. Exacerbation phenotyping in chronic obstructive pulmonary disease. Respirology. 2013;18(8):1280–1281. | ||
Wang Y, Stavem K, Dahl FA, Humerfelt S, Haugen T. Factors associated with a prolonged length of stay after acute exacerbation of chronic obstructive pulmonary disease (AECOPD). Int J Chron Obstruct Pulmon Dis. 2014;9:99–105. | ||
Marchand E, Maury G. Evaluation of the COPD Assessment Test in patients with stable COPD. Rev Mal Respir. 2012;29(3):391–397. | ||
Kelly JL, Bamsey O, Smith C, et al. Health status assessment in routine clinical practice: the chronic obstructive pulmonary disease assessment test score in outpatients. Respir: Int Rev Thoracic Dis. 2012;84(3):193–199. | ||
Jones PW, Harding G, Wiklund I, et al. Tests of the responsiveness of the COPD assessment test following acute exacerbation and pulmonary rehabilitation. Chest. 2012;142(1):134–140. | ||
Mackay AJ, Donaldson GC, Patel AR, Jones PW, Hurst JR, Wedzicha JA. Usefulness of the Chronic Obstructive Pulmonary Disease Assessment Test to evaluate severity of COPD exacerbations. Am J Respir Crit Care Med. 2012;185(11):1218–1224. | ||
Kherad O, Kaiser L, Bridevaux PO, et al. Upper-respiratory viral infection, biomarkers, and COPD exacerbations. Chest. 2010;138(4):896–904. | ||
Sethi S, Murphy TF. Infection in the pathogenesis and course of chronic obstructive pulmonary disease. New Engl J Med. 2008;359(22):2355–2365. | ||
Mohan A, Chandra S, Agarwal D, et al. Prevalence of viral infection detected by PCR and RT-PCR in patients with acute exacerbation of COPD: a systematic review. Respirology. 2010;15(3):536–542. | ||
Tager I, Speizer FE. Role of infection in chronic bronchitis. New Engl J Med. 1975;292(11):563–571. | ||
Ko FW, Ip M, Chan PK, et al. Viral etiology of acute exacerbations of COPD in Hong Kong. Chest. 2007;132(3):900–908. | ||
Camargo CA Jr, Ginde AA, Clark S, Cartwright CP, Falsey AR, Niewoehner DE. Viral pathogens in acute exacerbations of chronic obstructive pulmonary disease. Intern Emerg Med. 2008;3(4):355–359. | ||
Hutchinson AF, Ghimire AK, Thompson MA, et al. A community-based, time-matched, case-control study of respiratory viruses and exacerbations of COPD. Respir Med. 2007;101(12):2472–2481. | ||
Rogers GB, Daniels TW, Tuck A, et al. Studying bacteria in respiratory specimens by using conventional and molecular microbiological approaches. BMC Pulm Med. 2009;9:14. | ||
Ye F, He LX, Cai BQ, et al. Spectrum and antimicrobial resistance of common pathogenic bacteria isolated from patients with acute exacerbation of chronic obstructive pulmonary disease in mainland of China. Chin Med J. 2013;126(12):2207–2214. | ||
Tsimogianni AM, Papiris SA, Stathopoulos GT, Manali ED, Roussos C, Kotanidou A. Predictors of outcome after exacerbation of chronic obstructive pulmonary disease. J Gen Intern Med. 2009;24(9):1043–1048. | ||
Wong AW, Gan WQ, Burns J, Sin DD, van Eeden SF. Acute exacerbation of chronic obstructive pulmonary disease: influence of social factors in determining length of hospital stay and readmission rates. Can Respir J: J Can Thorac Soc. 2008;15(7):361–364. | ||
Wilkinson TM, Hurst JR, Perera WR, Wilks M, Donaldson GC, Wedzicha JA. Effect of interactions between lower airway bacterial and rhinoviral infection in exacerbations of COPD. Chest. 2006;129(2):317–324. | ||
Bahloul M, Chaari A, Tounsi A, et al. Incidence and impact outcome of pulmonary embolism in critically ill patients with severe exacerbation of chronic obstructive pulmonary diseases. Clin Respir J. 2015;9(3):270–277. | ||
Seemungal T, Harper-Owen R, Bhowmik A, et al. Respiratory viruses, symptoms, and inflammatory markers in acute exacerbations and stable chronic obstructive pulmonary disease. Am J Respir Crit Care Med. 2001;164(9):1618–1623. | ||
Aydemir Y, Aydemir O, Kalem F. Relationship between the GOLD combined COPD assessment staging system and bacterial isolation. Int J Chron Obstruct Pulmon Dis. 2014;9:1045–1051. | ||
Perotin JM, Dury S, Renois F, et al. Detection of multiple viral and bacterial infections in acute exacerbation of chronic obstructive pulmonary disease: a pilot prospective study. J Med Virol. 2013;85(5):866–873. | ||
Wark PA, Tooze M, Powell H, Parsons K. Viral and bacterial infection in acute asthma and chronic obstructive pulmonary disease increases the risk of readmission. Respirology. 2013;18(6):996–1002. | ||
Huang F, Guo J, Zou Z, et al. Angiotensin II plasma levels are linked to disease severity and predict fatal outcomes in H7N9-infected patients. Nature Commun. 2014;5:3595. |
 © 2015 The Author(s). This work is published and licensed by Dove Medical Press Limited. The full terms of this license are available at https://www.dovepress.com/terms.php and incorporate the Creative Commons Attribution - Non Commercial (unported, v3.0) License.
By accessing the work you hereby accept the Terms. Non-commercial uses of the work are permitted without any further permission from Dove Medical Press Limited, provided the work is properly attributed. For permission for commercial use of this work, please see paragraphs 4.2 and 5 of our Terms.
© 2015 The Author(s). This work is published and licensed by Dove Medical Press Limited. The full terms of this license are available at https://www.dovepress.com/terms.php and incorporate the Creative Commons Attribution - Non Commercial (unported, v3.0) License.
By accessing the work you hereby accept the Terms. Non-commercial uses of the work are permitted without any further permission from Dove Medical Press Limited, provided the work is properly attributed. For permission for commercial use of this work, please see paragraphs 4.2 and 5 of our Terms.