")
Back to Journals » OncoTargets and Therapy » Volume 13
Repression of PCGF1 Decreases the Proliferation of Glioblastoma Cells in Association with Inactivation of c-Myc Signaling Pathway
Authors Yan R , Cui F, Dong L, Liu Y, Chen X , Fan R
Received 13 October 2019
Accepted for publication 12 December 2019
Published 9 January 2020 Volume 2020:13 Pages 253—261
DOI https://doi.org/10.2147/OTT.S234517
Checked for plagiarism Yes
Review by Single anonymous peer review
Peer reviewer comments 2
Editor who approved publication: Prof. Dr. Nicola Silvestris
Rui Yan,1,* Fengmei Cui,2,* Lijin Dong,3,* Yong Liu,4 Xuewei Chen,5 Rong Fan4
1Department of Thoracic Surgery, The Third Medical Center, Chinese People’s Liberation Army General Hospital, Beijing 100039, People’s Republic of China; 2Department of Radiation Medicine, School of Radiation Medicine and Protection, Medical College of Soochow University, Suzhou 215123, People’s Republic of China; 3Editorial Department, Logistic University of Chinese People’s Armed Police Force, Tianjin 300309, People’s Republic of China; 4Central Laboratory, Xi Qing Hospital, Tianjin 300380, People’s Republic of China; 5Department of Operational Medicine, Tianjin Institute of Environmental and Operational Medicine, Tianjin 300050, People’s Republic of China
*These authors contributed equally to this work
Correspondence: Xuewei Chen; Rong Fan Email [email protected]; [email protected]
Purpose: Glioblastoma (GBM) is the most common primary brain tumor with a poor therapeutic outcome. Polycomb group factor 1 (PCGF1), a member of the PcG (Polycomb group) family, is highly expressed in the developing nervous system of mice. However, the function and the mechanism of PCGF1 in GBM proliferation still remain unclear.
Methods: Knockdown of PCGF1 was performed in U87 GBM cell by shRNA strategy via lentivirus vector. MTT assay, colony formation assays, and flow cytometry were used to measure the properties of cell proliferation and cell cycle distribution, respectively. GeneChip analysis was performed to identify the downstream effector molecules. Rescue assay was constructed to verify the screening results.
Results: We first found that knockdown of PCGF1 led to the inhibition of U87 cells proliferation and decreased colony formation ability. The data from GeneChip expression profiling and Ingenuity Pathway Analysis (IPA) indicated that many of the altered gene cells are associated with the cell proliferation control pathways. We have further confirmed the suppression of AKT/GSK3β/c-Myc/cyclinD1 expressions by Western blotting analysis. The over-expression of c-Myc could partly restore the attenuated proliferation ability caused by knockdown of PCGF1.
Conclusion: All the above evidences suggested that PCGF1 might be closely associated with tumorigenesis and progression of glioblastoma (GBM), in which process the oncoprotein c-Myc may participate. PCGF1 could thus be a potential therapeutic target for the treatment of glioblastoma (GBM).
Keywords: glioblastoma, GBM, PCGF1, cell proliferation, polycomb group
Introduction
Glioma is one of the most malignant forms of brain tumors in adults, which make up 80% of all malignant brain tumors.1,2 Although many treatment measures such as surgical resection, external radiotherapy, chemotherapy and biological therapy have been performed,3–8 the median survival time of patients for the most malignant type of glioma, glioblastoma (GBM), is only 15 months and the survival rate over 5 years is less than 10%.9,10 The low survival time could be attributed to the difficulty in complete resection, invasion into surrounding tissues, high recurrence rate in situ, and the presence of the blood-brain barrier (BBB).11 Although our understanding of glioblastoma (GBM) carcinogenesis is steadily increasing, the mechanism of this process remains unclear. Therefore, it is very important to further understand the etiology of gliomas and identify potential therapeutic targets for achieving a radical cure as well as preventing disease recurrence.
As a member of PcG, polycomb group factor 1 (PCGF1) was originally identified as a novel mammalian polycomb gene which is highly expressed in the developing nervous system. Until now, most of the studies about the function of PCGF1 focused on the self-renewal of cells and the development of embryo.12–16 Sequence alignment indicated PCGF1 is highly homologous with BMI-1, which was a star molecule of PcG. Previous studies showed that Bmi-1 absence caused premature brain degeneration,17 and its over-expression in neural stem/progenitor cells increased proliferation and neurogenesis in culture.18 In addition, silencing of Bmi-1 gene led to the increased chemotherapy sensitivity of human glioblastoma (GBM) cells, and a specific inhibitor of Bmi-1, PTC-209, could significantly attenuate the glioblastoma growth in murine orthotopic xenograft model.19,20 In consideration of PCGF1 associated with nervous system development, we were very interested in its expression and its functions in a nervous system tumor. To the best of our knowledge, there are only a few studies till date on the therapeutic potential and regulation mechanism of PCGF1 in glioblastoma (GBM) cell lines.
In the present study, we showed a novel role of PCGF1 in the growth of malignant glioblastoma (GBM) U87 cells, as well as its underlying mechanisms, by microarray analysis. Thus, the results obtained suggested that targeting of PCGF1 may be used as a potential and specific therapeutic tool for the treatment of glioblastoma (GBM).
Materials and Methods
Cell Lines and Culture
The glioma cell line, U87, and renal epithelial cell line, 293T, were purchased from the Cell Bank of Chinese Academy of Sciences (Beijing, People’s Republic of China). Cells were maintained in Dulbecco’s modified Eagle’s medium (Gibco) containing 10% fetal bovine serum (Hyclone), under a humidified atmosphere of 5% CO2 at 37°C.
Construction of Plasmid
For the lentivirus-shRNA-mediated silencing of the PCGF1 gene, 3 shRNA sequences were designed and employed (GENECHEM Co., Shanghai, China), as follows:
shRNA1: 5ʹ- AGAGTTGTATTGTGAAGTA-3ʹ;
shRNA2: 5ʹ-AGACACAGCCACTGCTCAA-3ʹ;
shRNA3: 5ʹ- CATGCAGGACATCGTGTAT-3ʹ.
The non-silencing control shRNA was synthesized using scrambled sequences. These nucleotide sequences were inserted into the plasmids using GV118 vector. Lentivirus particles were generated by triple transfection of 80% confluent 293T cells using Lipofectamine3000. Then, the cells were transduced with the constructed lentiviruses containing PCGF1 shRNA (KD1, KD2, and KD3) and non-silencing shRNA (NC), at an MOI of 10 and 15, respectively. The gene coding c-Myc was amplified from the cDNA of U87 cells, and the product was cloned into pcDNA3.1 vector. Finally, the control and c-Myc plasmids were transfected into U87 KD cells.
Isolation of RNA and Quantitative Real-Time PCR
Total RNA from cell cultures was prepared by using EasyPure RNA Kit (TransGen Biotech, China), following the manufacturer’s instructions. The PCGF1 (forward: 5ʹ-TTAAGATGGCGTCTCCTCAGG-3ʹ; reverse: 5ʹ-AGTGGCTGTGTCTCGTGGAT-3ʹ) and GAPDH (forward: 5ʹ-TGACTTCAACAGCGACACCCA-3ʹ; reverse: 5ʹ-CACCCTGTTGCTGTAGCCAAA-3ʹ) specific primers were used in the qPCR reactions. Each sample was analyzed in triplicate by qPCR with SYBR Green Supermix (Promega, USA) on Applied Biosystems StepOnePlus instruments, with GAPDH as the internal control. Amplification data were collected by Mastercycler ep realplex and analyzed by the realplex2.0 software (Eppendorf, Germany).
Cell Extracts and Western Blotting
Cell lysates were subjected to Western blot analysis with the following antibodies and dilutions: rabbit anti-PCGF1 (1:4000; Abcam, USA), mouse anti-β-Actin (1:4000; CWBIO, China), rabbit anti-AKT (1:4000, Abcam, USA), rabbit anti-pAKT (1:4000, Abcam, USA), rabbit anti-GSK-3β (1:4000, Abcam, USA), rabbit anti-c-Myc (1:4000, Abcam, USA), and rabbit anti-CyclinD1 (1:4000, Abcam, USA). The signals were amplified by HRP-conjugated secondary antibodies (Bio-Rad, Hercules, CA, USA), and detected via ECL Plus (Amersham Pharmacia Biotech, USA). The acquired images were then analyzed on a computer using Image J software.
Cell Cycle Assay
The cells were cultured for 24 hrs in 6-well plates at a concentration of 2×10⁴ cells per well, before cell cycle analysis. The cells were washed with phosphate buffered saline (PBS) and fixed with 80% (v/v) cold ethanol, overnight. Subsequently, cells were incubated with 100μg/mL RNase A for 30 min at 37°C, and then incubated with 20 μg/mL propidium iodide (PI) for 15 min at room temperature. Cell cycle analysis was performed via flow cytometry (BD, Biosciences, USA).
MTT Assay
The cells were seeded into 96-well plates at a concentration of 2×10³ cells per well. Following incubation for 1, 2, 3, 4, or 5 days, 20 μL of MTT (5.0 mg/mL, Sigma-Aldrich) was added to each well. Following incubation at 37°C for 4 h, 200 μL of dimethyl sulfoxide was added after removing the medium and MTT from the wells. The absorbance was measured at 490 nm using a micro-plate reader (Bio-Rad Laboratories, Hercules, CA, USA).
Colony Formation Assay
The cells were seeded into six-well plates at a concentration of 800 cells per well. After 9 days of culturing, the cells were fixed with 4% paraformaldehyde for 30 min and stained with freshly prepared Giemsa stain for 20 min. A colony is defined to be consisting of at least 50 cells. Colonies were counted via light/fluorescence microscopy.
Microarray Analysis
This part of the work was completed in collaboration with Genechem Corp. Total RNA were extracted from KD and NC cells by using Trizol (Invitrogen, CA, USA), following the manufacturer’s instructions. The quantity and quality of RNA were assessed via NanoDrop 2000 (Thermo Fisher SCIENTIFIC, USA) and Agilent 2100 Bioanalyzer (Agilent Technologies, Santa Clara, CA, USA). The 260/280 ratios of all samples were between 2.04 and 2.11, and all RNA integrity number (RIN) values were ≥7.0. Gene expression profiling was performed with Affymetrix human GeneChip PrimeView for microarray processing, as per the manufacturer’s instructions. Afterwards, the samples were hybridized, washed, stained, and scanned, to collect and produce raw data (CEL files). For each sample, the Chip hybridization was done in triplicate to ensure the reproducibility of the results. The analysis of potential target genes of PCGF1 was carried by using IPA. Genes which showed a statistically significant (P < 0.05) and absolute fold change > 2 were identified as differentially expressed.
Statistical Analysis
All experiments were performed in triplicate. Statistical analyses were performed using GraphPad Prism 8.0 software. Data are presented as the mean±standard deviation, for at least three independent experiments. The asterisks in each graph indicate statistically significant changes, with P values calculated by Student′s t-test: *P< 0.05, **P≤ 0.01 and ***P≤ 0.001. P-values <0.05 were considered statistically significant.
Results
Effect of PCGF1 Knock-Down on the Cell Cycle Distributions of U87 Cells
To investigate the biological function of PCGF1, we first established the PCGF1-silenced cells mediated by lentivirus-shRNA strategy. Three different shRNA sequences and vectors were designed and constructed to knockdown the expression of PCGF1. The real-time PCR data showed that these shRNA decreased PCGF1 RNA by approximately 13.7%, 76.6%, and 32%, respectively, (Figure 1A) compared to the control group (NC). Consistent with the real-time PCR result, the Western blotting analysis also demonstrated that a specific shRNA, KD2, was the most efficient in interfering with PCGF1 expression (more than 70%) among the three shRNAs (Figure 1B). Therefore, shRNA KD2 was further used in the following experiments, and henceforth dubbed “KD”.
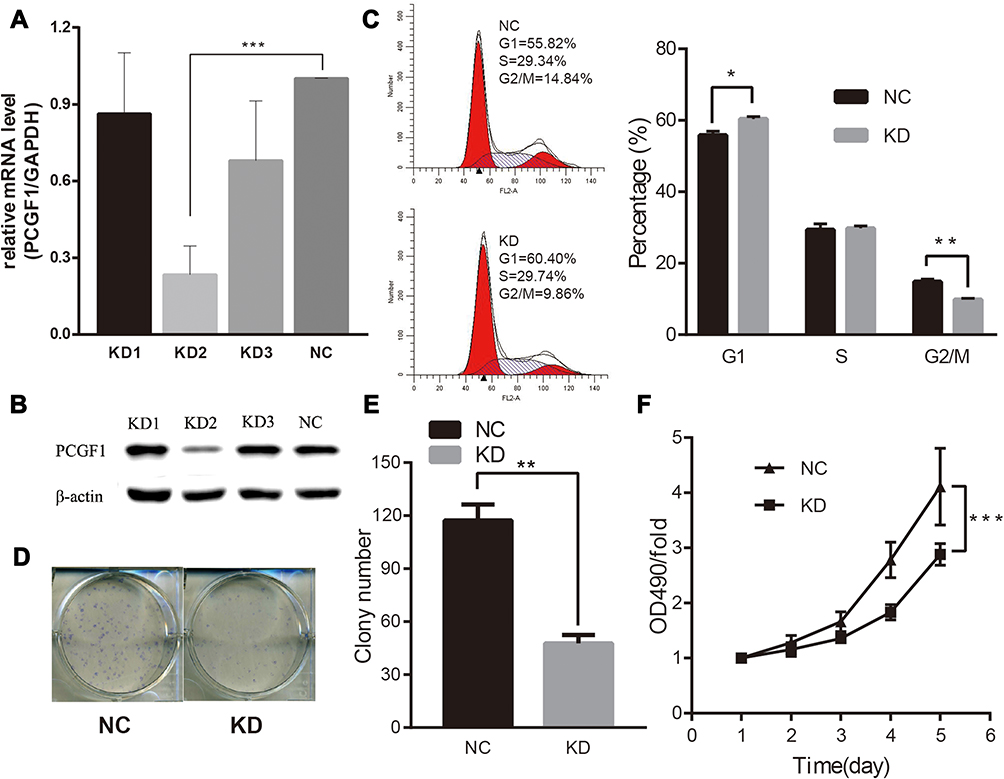 |
Figure 1 Knockdown of PCGF1 by lentivirus-mediated short hairpin RNA (shRNA)-induced cell cycle arrested at G0/G1 phase and attenuation of proliferation in U87 cells. Notes: (A) Expression analysis of PCGF1 mRNA by RT-qPCR analysis. (B) Expression of PCGF1 proteins in infected cells was analyzed by Western blot. (C) Cell cycle distribution of U87 cells was analyzed by flow cytometry. The cell population of G0/G1 phases was increased, and the number of cells in G2/M phases was decreased in KD groups. (D) These represent images of U87 colonies under light microscope. (E) Statistical analysis of the number of colonies. (F) Effect of PCGF1 knockdown on the proliferation of U87 cells. The KD group was significantly inhibited, as detected by the MTT assay. NC group contained cells infected by the lentivirus-shRNA-control construct, while KD group contained the cells infected by the lentivirus-shRNA-PCGF1 construct. *P<0.05, **P<0.01, ***P<0.001. |
The effect of PCGF1 knock-down on cell cycle of U87 cells was detected (Figure 1C). A remarkably increased percentage of G1 population and decreased G2/M population were observed in U87 KD cells, as compared to NC cells, which implied that PCGF1 could play an important role in the proliferation of U87 cells. There is no difference in cell distributions in the S phase between KD and NC cells.
Effect of PCGF1 Knock-Down on the Proliferation and Growth of U87 Cells
To explore the effect of PCGF1 knock-down on the growth and proliferation of glioma cells, MTT and colony formation assays were performed for U87 cells. As shown in Figure 1D, the size of each single colony of KD cells was much smaller than that of NC cells under the conditions of same culture time after plating. Moreover, the number of colonies was significantly decreased in KD cells (Figure 1E), as compared to NC groups. The MTT assay indicated that the growth of KD cells was much slower as compared to NC cells (Figure 1F). These results indicated that knockdown of PCGF1 could remarkably inhibit the proliferation of U87 cells.
Identification of the PCGF1-Associated Genes by Gene Expression Microarray Analysis
To further explore the PCGF1-associated genes and potential-related signal pathways involved in proliferation regulation of glioma cells, we used GeneChip DNA microarray analysis to compare the gene expression profiles in KD and NC U87 cells. We have submitted the raw data for microarray to the GEO repository and got the accession number, GSE 121463. Using a log 2-fold change of ±1.3 and P<0.05 as a cutoff, we identified 469 genes showing significant differential expressions, within which 295 genes were up-regulated and 174 were down-regulated. The IPA analysis displayed that differentially expressed genes were remarkably enriched in 18 pathways, based on a P < 0.01 and the absolute value of z-score >1 threshold, in which PI3K/AKT signaling was predicted to be significantly repressed. Most of these pathways are critical for tumor development and progression (Figure 2A). Furthermore, IPA was performed to show that both cell death and survival were prominently influenced (Figure 2B).
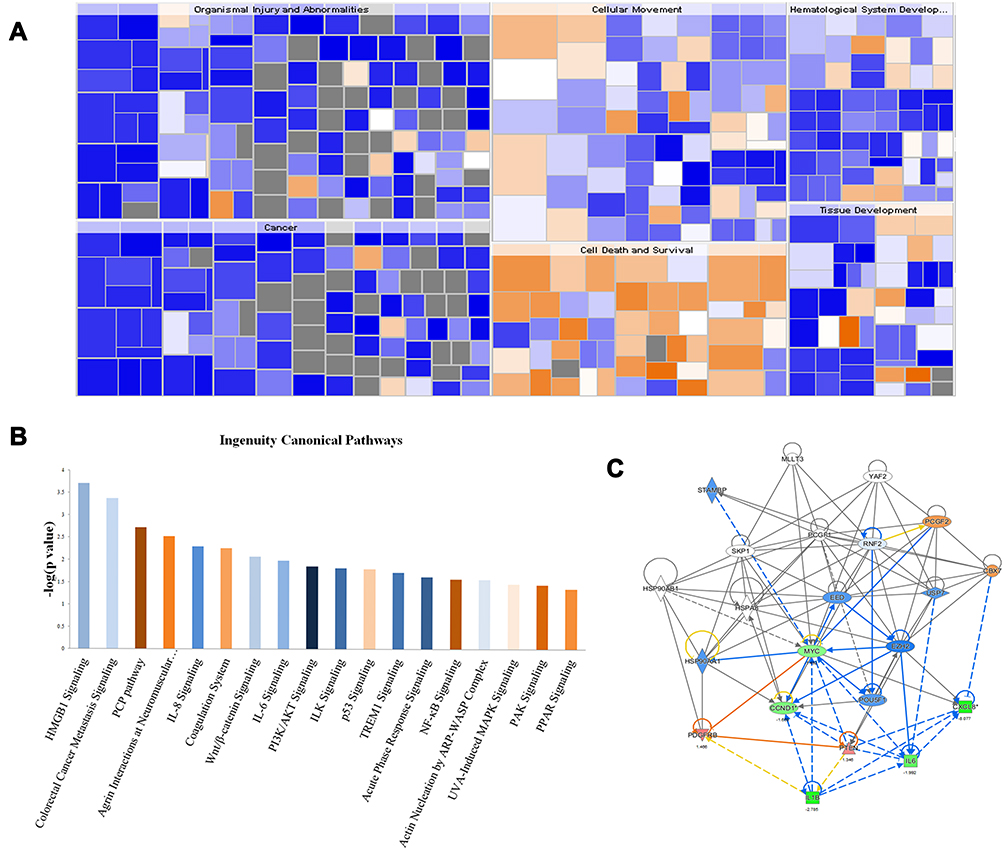 |
Figure 2 Ingenuity pathway analysis (IPA) of GeneChip DNA microarray data. Notes: (A) Diseases and heat map show the relationship of gene expression and disease. Orange represents Z-score >0, blue represents Z-score <0, gray indicates no Z-score value; Z-score >2 on behalf of the function is significantly activated, Z-score <-2 representing the function was significantly inhibited. (B) The analysis of functional pathway enrichment of differential genes was performed based on IPA databases. Here, the 18 significantly enriched pathways based on a P<0.01 were shown. The statistical significance shown on the Y axis is indicated by the inverse log of the P value, and yellow for z-score >0, blue for z-score <0, the darker color represented the greater absolute z-score value. (C) Networks were constructed between PCGF1 and genes involved in cell death and survival pathway involving MYC. Green represents down-regulated genes and red represents up-regulated genes in extreme situation. Orange represents predicted activation gene and blue represents predicted inhibition gene. |
Functional interaction network analysis was further performed to investigate the relationship between PCGF1 and the genes involved in the above-mentioned signaling pathways and functions (Figure 2C), which include the c-Myc signal network. Therefore, we further verified the effect of PCGF1 knock-down on the expression of some genes in the c-Myc interaction network by Western blot analysis. The results demonstrated that the levels of AKT, pAKT, GSK3β, c-Myc, and cyclinD1 proteins were remarkably decreased following knockdown of PCGF1 (Figure 3).
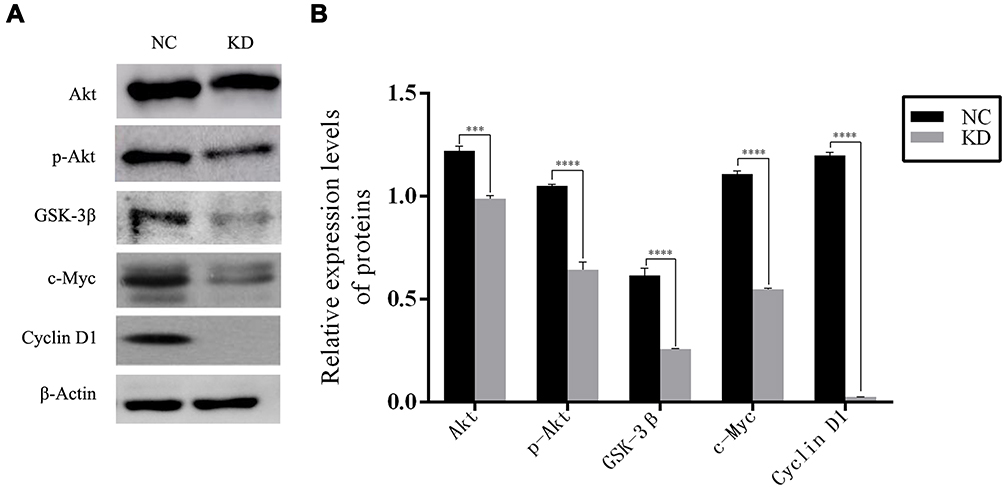 |
Figure 3 The expression of downstream protein selected by microarray in U87 cells. Notes: (A) Western blotting indicated that the protein levels of AKT, pAKT, GSK-3β, c-Myc, and cyclinD1 decreased following the knockdown of PCGF1 in U87 cells. (B) The protein levels from three independent experiments are quantified and presented as mean ± SD. ***P<0.001, ****P<0.0001. |
Overexpression of c-Myc Can Rescue the Decreased Proliferation of U87 Cells Induced by PCGF1 Knock-Down
To verify the inhibitory effect on c-Myc and proliferation, caused by PCGF1 knockdown, we transfected the c-Myc plasmid into KD cells. The transfection efficiency was confirmed by Western blot analysis (Figure 4A). The results of MTT and colony formation assays showed that c-Myc overexpression reversed the suppressive effect mediated by PCGF1 knock-down in U87 KD cells (Figure 4B and C), which suggested that PCGF1 regulated the proliferation of glioblastoma (GBM) cells at least partly via c-Myc pathway.
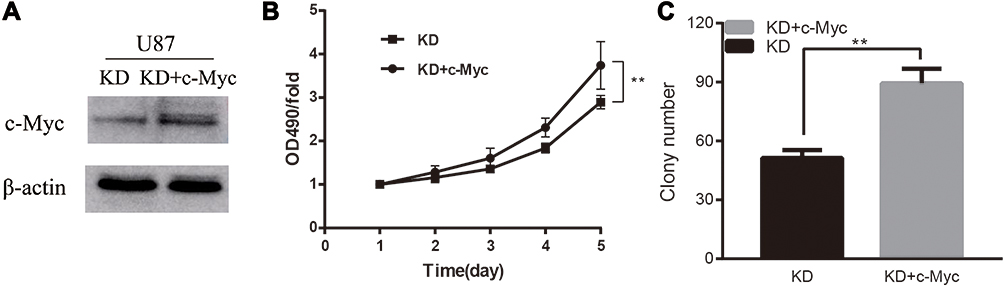 |
Figure 4 The recovery expression of c-Myc restored the proliferation ability of U87 KD cells. Notes: (A) Following transfection of the exogenous c-Myc, the protein levels of c-Myc increased significantly as compared to KD-only cells. (B and C) The overexpression of c-Myc significantly restored the attenuated proliferation ability caused by knockdown of PCGF1, as detected by the MTT and colony-forming assay. **P<0.01. |
Discussion
Glioblastoma (GBM) represents the most common type of CNS malignancies, accounting for 45% of all malignant central nervous system (CNS) tumors and 80% of all primary malignant CNS tumors.21,22 Polycomb group (PcG) genes are epigenetic regulators which play a vital role in gene silencing by forming polycomb repressor complexes.23,24 Recent research has indicated that polycomb group members, such as EZH2, Bmi1, KDM2B, PHF19, SUZ12, CBX8, and so on, are involved in the proliferation of cancer cell including glioma cells.20,25–31 In the present study, we revealed the association between PCGF1 and various characteristics of glioblastoma (GBM).
In cancer cells, cell cycle alteration is a critical event which is closely related to the capability of proliferation, development, progression, resistance to treatment, and relapse.32 Aberrant functioning of cell cycle regulators generally alters the properties of growth, differentiation, and apoptosis in cancer cells.33 The increased ratio of G1 phase population hints that the knockdown of PCGF1 could prevent U87 cells progressing from G0/G1 to S phase, and consequently, decrease the activity of cell proliferation. The same was confirmed by MTT and colony formation assays.
To unravel the mechanisms involved, we conducted mRNA expression profiling experiment. Further analysis revealed that many of the changed genes are enriched in tumor proliferation pathways, including PI3K/AKT signaling, which plays a key role in the cell proliferation, apoptosis, metabolism, motility, and angiogenesis in glioblastoma (GBM).34–36 As known, pAKT could activate GSK-3β, mTOR, etc., to promote proliferation and neovascularization, while inhibiting apoptosis.37,38 Early studies showed that GSK-3β was a key molecule in the regulation of multiple signaling pathways, such as c-Myc, which were closely associated with the progression and development of tumor as a proto-oncogene.39 Tian found that over-expression of miR-101 could make GBM cells sensitive to Temozolomide (TMZ) by down-regulating GSK-3β.40 Similarly, Nowicki MO found that the inhibition of GSK-3β could repress the growth of glioma cells effectively in the cell wound scratch assay.41 Previous studies showed that the level of MYC was frequently up-regulated in malignant glioma, and down-regulation of c-Myc could promote G1/S arrest and apoptosis in vitro.42 In addition, c-Myc plays a critical role in regulating the formation and progression of brain tumors.43–45 CyclinD1 is frequently overexpressed in a wide range of tumors. There was a higher expression of cyclinD1 in the patients with high-grade malignant gliomas than low-grade gliomas.46 CyclinD1 is a key G1 phase checkpoint protein that controls proliferation and adhesion of tumor, and knockout of CyclinD1, resulting in cell cycle blockage at G1/S phase, inhibition of proliferation, and induction of apoptosis.47,48 In contrast, overexpression of cyclinD1 enhanced the proliferation and invasive potential, and reduced apoptosis.49,50
Based on the information from IPA analysis of GeneChip data, we chose the PI3K/AKT signaling pathway to test crucial downstream genes and found the expression levels of AKT, pAKT, GSK-3β, c-Myc, and cyclinD1 were significantly decreased following the knockdown of PCGF1. Furthermore, the rescue assay results suggested that overexpression of c-Myc can restore the disruption of proliferative ability caused by PCGF1 knockdown. These data implied that PCGF1 knockdown inactivated the PI3K/AKT signaling pathway and decreased the levels of c-Myc and cyclinD1, which further prevented the progression of U87 cells from G0/G1 to S phase, resulting in cell cycle arrest in the G0/G1 phase and inhibiting cell proliferation. These results suggested that PCGF1 might be an upstream factor that can accelerate cancer development and progression. These findings were consistent with the previous conclusion that knockdown of PCGF1 in stem cell-like glioma cells resulted in impaired neurosphere formation and self-renewal abilities.51 To draw the network, PCGF1 is involved in glioma cells, it is worth elucidating the detailed mechanism behind how PCGF1 regulates the downstream genes.
Conclusion
Our study identified PCGF1 as a key regulator of proliferation in GBM cells. Knockdown of PCGF1 led to a significant reduction of cell proliferation, which was accounted for by G1 cell cycle arrest. The data also explored some downstream genes of PCGF1 that control GBM proliferation such as c-MYC, cyclinD1.
Acknowledgments
The authors thank Prof. Ping-Kun Zhou, Beijing Institute of Radiation Medicine, for his comments and editorial assistance on this work.
Author Contributions
All authors contributed to data analysis, drafting and revising the article, gave final approval of the version to be published, and agree to be accountable for all aspects of the work.
Disclosure
The authors report no conflicts of interest in this work.
References
1. Weller M, Wick W, Aldape K, et al. Glioma. Nat Rev Dis Primers. 2015;1:15017. doi:10.1038/nrdp.2015.17
2. Louis DN, Perry A, Reifenberger G, et al. The 2016 World Health Organization classification of tumors of the central nervous system: a summary. Acta Neuropathol. 2016;131(6):803–820. doi:10.1007/s00401-016-1545-1
3. Hatoum A, Mohammed R, Zakieh O. The unique invasiveness of glioblastoma and possible drug targets on extracellular matrix. Cancer Manag Res. 2019;11:1843–1855. doi:10.2147/CMAR.S186142
4. Peng H, Li Z, Fu J, Zhou R. Growth and differentiation factor 15 regulates PD-L1 expression in glioblastoma. Cancer Manag Res. 2019;11:2653–2661. doi:10.2147/CMAR.S192095
5. Syed M, Liermann J, Verma V, et al. Survival and recurrence patterns of multifocal glioblastoma after radiation therapy. Cancer Manag Res. 2018;10:4229–4235. doi:10.2147/CMAR
6. Ren Z, Liang J, Zhang P, Chen J, Wen J. Inhibition of human glioblastoma cell invasion involves PION@E6 mediated autophagy process. Cancer Manag Res. 2019;11:2643–2652. doi:10.2147/CMAR.S200151
7. Pan SJ, Zhan SK, Pan YX, et al. Tetraspanin 8-rictor-integrin alpha3 complex is required for glioma cell migration. Int J Mol Sci. 2015;16(3):5363–5374. doi:10.3390/ijms16035363
8. Chen Z, Xu N, Zhao C, Xue T, Wu X, Wang Z. Bevacizumab combined with chemotherapy vs single-agent therapy in recurrent glioblastoma: evidence from randomized controlled trials. Cancer Manag Res. 2018;10:2193–2205. doi:10.2147/CMAR
9. Ostrom QT, Bauchet L, Davis FG, et al. The epidemiology of glioma in adults: a “state of the science” review. Neuro-Oncology. 2014;16(7):896–913. doi:10.1093/neuonc/nou087
10. Stupp R, Hegi ME, Mason WP, et al. Effects of radiotherapy with concomitant and adjuvant temozolomide versus radiotherapy alone on survival in glioblastoma in a randomised Phase III study: 5-year analysis of the EORTC-NCIC trial. Lancet Oncol. 2009;10(5):459–466. doi:10.1016/S1470-2045(09)70025-7
11. Cuddapah VA, Robel S, Watkins S, Sontheimer H. A neurocentric perspective on glioma invasion. Nat Rev Neurosci. 2014;15(7):455–465. doi:10.1038/nrn3765
12. Liang Z, Wang Y, Li H, Sun Y, Gong Y. lncRNAs combine and crosstalk with NSPc1 in ATRA-induced differentiation of U87 glioma cells. Oncol Lett. 2019;17(6):5821–5829. doi:10.3892/ol.2019.10254
13. Ross K, Sedello AK, Todd GP, et al. Polycomb group ring finger 1 cooperates with Runx1 in regulating differentiation and self-renewal of hematopoietic cells. Blood. 2012;119(18):4152–4161. doi:10.1182/blood-2011-09-382390
14. Wu XD, Zhang M, Gong YH, et al. [Expression pattern of polycomb gene Nspc1 at the early developmental stage in zebrafish]. Zhongguo Yi Xue Ke Xue Yuan Xue Bao. 2008;30(5):550–553.
15. Li H, Fan R, Sun M, Jiang T, Gong Y. Nspc1 regulates the key pluripotent Oct4-Nanog-Sox2 axis in P19 embryonal carcinoma cells via directly activating Oct4. Biochem Biophys Res Commun. 2013;440(4):527–532. doi:10.1016/j.bbrc.2013.09.095
16. Yan Y, Zhao W, Huang Y, et al. Loss of polycomb group protein Pcgf1 severely compromises proper differentiation of embryonic stem cells. Sci Rep. 2017;7:46276. doi:10.1038/srep46276
17. Cao G, Gu M, Zhu M, et al. Bmi-1 absence causes premature brain degeneration. PLoS One. 2012;7(2):e32015. doi:10.1371/journal.pone.0032015
18. He S, Iwashita T, Buchstaller J, Molofsky AV, Thomas D, Morrison SJ. Bmi-1 over-expression in neural stem/progenitor cells increases proliferation and neurogenesis in culture but has little effect on these functions in vivo. Dev Biol. 2009;328(2):257–272. doi:10.1016/j.ydbio.2009.01.020
19. Hong Y, Shang C, Xue YX, Liu YH. Silencing of Bmi-1 gene enhances chemotherapy sensitivity in human glioblastoma cells. Med Sci Monit. 2015;21:1002–1007. doi:10.12659/MSM.893754
20. Kong Y, Ai C, Dong F, et al. Targeting of BMI-1 with PTC-209 inhibits glioblastoma development. Cell Cycle. 2018;17(10):1199–1211. doi:10.1080/15384101.2018.1469872
21. Ostrom QT, Gittleman H, Stetson L, Virk SM, Barnholtz-Sloan JS. Epidemiology of gliomas. Cancer Treat Res. 2015;163:1–14.
22. Schneider T, Mawrin C, Scherlach C, Skalej M, Firsching R. Gliomas in adults. Dtsch Arztebl Int. 2010;107(45):
23. Sauvageau M, Sauvageau G. Polycomb group proteins: multi-faceted regulators of somatic stem cells and cancer. Cell Stem Cell. 2010;7(3):299–313. doi:10.1016/j.stem.2010.08.002
24. Mathews LA, Crea F, Farrar WL. Epigenetic gene regulation in stem cells and correlation to cancer. Differentiation. 2009;78(1):1–17. doi:10.1016/j.diff.2009.04.002
25. Ma L, Lin K, Chang G, et al. Aberrant activation of beta-catenin signaling drives glioma tumorigenesis via USP1-mediated stabilization of EZH2. Cancer Res. 2019;79(1):72–85. doi:10.1158/0008-5472.CAN-18-1304
26. Isshiki Y, Nakajima-Takagi Y, Oshima M, et al. KDM2B in polycomb repressive complex 1.1 functions as a tumor suppressor in the initiation of T-cell leukemogenesis. Blood Adv. 2019;3(17):2537–2549. doi:10.1182/bloodadvances.2018028522
27. Deng Q, Hou J, Feng L, et al. PHF19 promotes the proliferation, migration, and chemosensitivity of glioblastoma to doxorubicin through modulation of the SIAH1/beta-catenin axis. Cell Death Dis. 2018;9(11):1049. doi:10.1038/s41419-018-1082-z
28. Cheng T, Xu Y. Effects of Enhancer of Zeste Homolog 2 (EZH2) expression on brain glioma cell proliferation and tumorigenesis. Med Sci Monit. 2018;24:7249–7255. doi:10.12659/MSM.909814
29. Zhang Y, Chen H, Zhu H, Sun X. CBX8 promotes tumorigenesis and confers radioresistance in esophageal squamous cell carcinoma cells through targeting APAF1. Gene. 2019;711:143949. doi:10.1016/j.gene.2019.143949
30. Li G, Warden C, Zou Z, et al. Altered expression of polycomb group genes in glioblastoma multiforme. PLoS One. 2013;8(11):e80970. doi:10.1371/journal.pone.0080970
31. Zhang J, Xu S, Xu J, et al. miR7675p inhibits glioma proliferation and metastasis by targeting SUZ12. Oncol Rep. 2019;42(1):55–66. doi:10.3892/or.2019.7156
32. Sun J, Zhang L, Zhao H, et al. CHD1L regulates cell cycle, apoptosis, and migration in glioma. Cell Mol Neurobiol. 2016;36(4):565–576. doi:10.1007/s10571-015-0237-z
33. Chukkapalli S, Amessou M, Dekhil H, et al. Ehd3, a regulator of vesicular trafficking, is silenced in gliomas and functions as a tumor suppressor by controlling cell cycle arrest and apoptosis. Carcinogenesis. 2014;35(4):877–885. doi:10.1093/carcin/bgt399
34. Li X, Wu C, Chen N, et al. PI3K/Akt/mTOR signaling pathway and targeted therapy for glioblastoma. Oncotarget. 2016;7(22):33440–33450. doi:10.18632/oncotarget.7961
35. Zhao HF, Wang J, Shao W, et al. Recent advances in the use of PI3K inhibitors for glioblastoma multiforme: current preclinical and clinical development. Mol Cancer. 2017;16(1):100. doi:10.1186/s12943-017-0670-3
36. Kalhori MR, Irani S, Soleimani M, Arefian E, Kouhkan F. The effect of miR-579 on the PI3K/AKT pathway in human glioblastoma PTEN mutant cell lines. J Cell Biochem. 2019;120(10):16760–16774. doi:10.1002/jcb.v120.10
37. Zhang X, Zheng K, Li C, et al. Nobiletin inhibits invasion via inhibiting AKT/GSK3beta/beta-catenin signaling pathway in Slug-expressing glioma cells. Oncol Rep. 2017;37(5):2847–2856. doi:10.3892/or.2017.5522
38. Atkins RJ, Stylli SS, Luwor RB, Kaye AH, Hovens CM. Glycogen synthase kinase-3beta (GSK-3beta) and its dysregulation in glioblastoma multiforme. J Clin Neurosci. 2013;20(9):1185–1192. doi:10.1016/j.jocn.2013.02.003
39. Kotliarova S, Pastorino S, Kovell LC, et al. Glycogen synthase kinase-3 inhibition induces glioma cell death through c-MYC, nuclear factor-kappaB, and glucose regulation. Cancer Res. 2008;68(16):6643–6651. doi:10.1158/0008-5472.CAN-08-0850
40. Tian T, Mingyi M, Qiu X, Qiu Y. MicroRNA-101 reverses temozolomide resistance by inhibition of GSK3beta in glioblastoma. Oncotarget. 2016;7(48):79584–79595. doi:10.18632/oncotarget.12861
41. Nowicki MO, Dmitrieva N, Stein AM, et al. Lithium inhibits invasion of glioma cells; possible involvement of glycogen synthase kinase-3. Neuro-Oncology. 2008;10(5):690–699. doi:10.1215/15228517-2008-041
42. Hu YH, Kong SQ, Kong HB, Wu JL, Chen Z. Targeting c-Myc on cell growth and vascular endothelial growth factor expression in IN500 glioblastoma cells. Chin Med J. 2012;125(11):2025–2031.
43. Guo P, Nie Q, Lan J, Ge J, Qiu Y, Mao Q. C-Myc negatively controls the tumor suppressor PTEN by upregulating miR-26a in glioblastoma multiforme cells. Biochem Biophys Res Commun. 2013;441(1):186–190. doi:10.1016/j.bbrc.2013.10.034
44. Ishida CT, Shu C, Halatsch ME, et al. Mitochondrial matrix chaperone and c-myc inhibition causes enhanced lethality in glioblastoma. Oncotarget. 2017;8(23):37140–37153. doi:10.18632/oncotarget.16202
45. Wang T, Chen W, Wu J. H2-P, a honokiol derivative, exerts anti-angiogenesis effects via c-MYC signaling pathway in glioblastoma. J Cell Biochem. 2018;119(4):3142–3148. doi:10.1002/jcb.v119.4
46. Liu W, Lv G, Li Y, Li L, Wang B. Downregulation of CDKN2A and suppression of cyclin D1 gene expressions in malignant gliomas. J Exp Clin Cancer Res. 2011;30:76. doi:10.1186/1756-9966-30-76
47. Holmes B, Lee J, Landon KA, et al. Mechanistic target of rapamycin (mTOR) inhibition synergizes with reduced internal ribosome entry site (IRES)-mediated translation of cyclin D1 and c-MYC mRNAs to treat glioblastoma. J Biol Chem. 2016;291(27):14146–14159. doi:10.1074/jbc.M116.726927
48. Xu Z, Zeng X, Tian D, et al. MicroRNA-383 inhibits anchorage-independent growth and induces cell cycle arrest of glioma cells by targeting CCND1. Biochem Biophys Res Commun. 2014;453(4):833–838. doi:10.1016/j.bbrc.2014.10.047
49. Wang J, Wang Q, Cui Y, et al. Knockdown of cyclin D1 inhibits proliferation, induces apoptosis, and attenuates the invasive capacity of human glioblastoma cells. J Neurooncol. 2012;106(3):473–484. doi:10.1007/s11060-011-0692-4
50. Wang C, Zhao N, Zheng Q, Zhang D, Liu Y. BHLHE41 promotes U87 and U251 cell proliferation via ERK/cyclinD1 signaling pathway. Cancer Manag Res. 2019;11:7657–7672. doi:10.2147/CMAR.S214697
51. PS H, Xia QS, Wu F, et al. NSPc1 promotes cancer stem cell self-renewal by repressing the synthesis of all-trans retinoic acid via targeting RDH16 in malignant glioma. Oncogene. 2017;36(33):4706–4718. doi:10.1038/onc.2017.34
 © 2020 The Author(s). This work is published and licensed by Dove Medical Press Limited. The full terms of this license are available at https://www.dovepress.com/terms.php and incorporate the Creative Commons Attribution - Non Commercial (unported, v3.0) License.
By accessing the work you hereby accept the Terms. Non-commercial uses of the work are permitted without any further permission from Dove Medical Press Limited, provided the work is properly attributed. For permission for commercial use of this work, please see paragraphs 4.2 and 5 of our Terms.
© 2020 The Author(s). This work is published and licensed by Dove Medical Press Limited. The full terms of this license are available at https://www.dovepress.com/terms.php and incorporate the Creative Commons Attribution - Non Commercial (unported, v3.0) License.
By accessing the work you hereby accept the Terms. Non-commercial uses of the work are permitted without any further permission from Dove Medical Press Limited, provided the work is properly attributed. For permission for commercial use of this work, please see paragraphs 4.2 and 5 of our Terms.